Nitrogenous Fertilizer Market Report Scope & Overview:
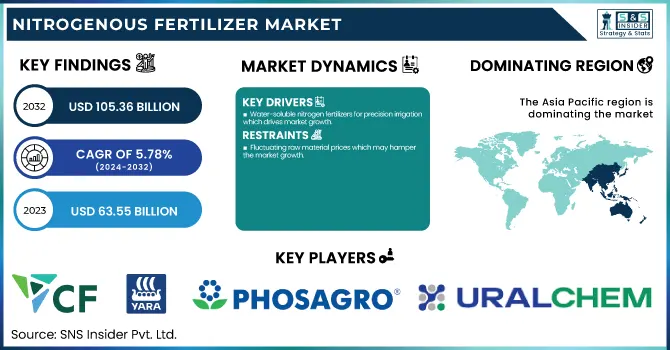
The Nitrogenous Fertilizer Market size was USD 63.55 Billion in 2023 and is expected to reach USD 105.36 Billion by 2032 and grow at a CAGR of 5.78% over the forecast period of 2024-2032.
To Get more information on Nitrogenous Fertilizer Market - Request Free Sample Report
The nitrogenous fertilizer market report provides a comprehensive analysis of key industry metrics. It includes production capacity and utilization rates by country and fertilizer type in 2023, offering insights into supply dynamics. The report also examines feedstock price trends across major markets, highlighting cost fluctuations. Regulatory impacts by country are assessed, focusing on policies affecting production and trade. Additionally, it covers environmental metrics, including emissions data, waste management practices, and sustainability initiatives across regions. Innovation and R&D investments by fertilizer type are analyzed to track advancements. Lastly, the report evaluates the market adoption of digital solutions and software for fertilizer management, emphasizing key features and regulatory compliance.
Nitrogenous Fertilizer Market Dynamics
Drivers
-
Water-soluble nitrogen fertilizers for precision irrigation which drives market growth.
The increasing adoption of water-soluble nitrogen fertilizers for precision irrigation. Drip and fertigation systems taught through the Precision irrigation program have farmers injecting nitrogen at the root zone of the plant in small, controlled amounts allowing the uptake of the nutrients to be maximized and the wastage of the nutrient to be minimized. It facilitates more efficient production with a lesser amount of the essentials required for irrigation helping with crop yield, reduced run-off in the environment & freshwater conservation making it the perfect method implemented in the areas where there is a lack of water but not too little cultivation. Moreover, the rising focus on the improvement of smart irrigation systems, artificial intelligence-based nutrient monitoring, and automation of dosing systems are also contributing to the demand for water-soluble nitrogen fertilizers. With sustainable and highly efficient farming taking precedence among the farmers, especially nitrogen fertilizers market is anticipated to grow over the forecast period namely, urea ammonium nitrate (UAN) and calcium nitrate in horticulture and high-value crops.
Restraint
-
Fluctuating raw material prices which may hamper the market growth.
Variable prices of raw materials are one of the major hurdles influencing the growth of the global nitrogenous fertilizer market. According to the statement, significant price fluctuations in these basic feedstocks natural gas, ammonia, and phosphate, all of which provide the nitrogen basis for nitrogen-based fertilizers have been evident as a result of ongoing global supply chain disruptions, escalating geopolitical tensions, and increasing global energy price volatility. Natural gas contributes up to 70–80% to the ammonia production cost, and price surges in natural gas are common, thereby affecting the fertilizer production costs. Also, production shortages can be caused by trade restrictions and export limitations from significant producing nations, leading to an increase in prices as well. Such price variations shrink profit margins for manufacturers while increasing costs for farmers, making fertilizers unattractive in many regions, especially developing regions. Consequently, farmers may turn to other sources of nutrients, such as organic fertilizers or precision farming practices leading to restricted growth of the market.
Opportunity
-
Advancements in biotechnology & microbial nitrogen fixation create an opportunity in the market.
Biotechnology and microbes are changing the dynamics of the nitrogenous fertilizer market by providing sustainable alternatives to synthetic fertilizers. Researchers and agritech companies have been inventing new bio-engineered nitrogen-fixing microbes, including rhizobacteria and mycorrhizal fungi, that naturally convert atmospheric nitrogen into forms that plants can use. Such innovations can decrease agricultural reliance on fertilizer and thus, can reduce production costs and adverse environmental impacts like nitrate leaching and greenhouse gas emissions. Moreover, crop improvement is also undertaken by using genetic engineering and CRISPR-based techniques to improve the efficiency of nitrogen fixation in non-leguminous crops such as wheat and maize, thus, creating a larger market segment. Now with governments and agriculture bodies pushing for biofertilizer as a part of sustainable agriculture, investments in microbial nitrogen solutions are set to further expand, paving the way for biotech-powered nitrogen management innovations in global agriculture.
Challenges
-
Uneven government policies & subsidies may challenge the market growth.
The nitrogenous fertilizer market faces major challenges from uneven government policies and subsidies. Most governments subsidize or incentivize fertilizer for farmers to ensure they remain affordable, but things vary greatly between regions leading to market distortions. Based on heavy subsidies in some countries, fertilizer prices are driven down and demand is stimulated, while the reduction or absence of support in other countries makes fertilizers unaffordable and restricts access to food. Turning to frequent policy changes, import-export bans, and environmental regulations creates uncertainty for manufacturers and distributors, and impulse demand from market factors must be adjusted. These differences impact international market access, pricing, and capital investment in production facilities which makes it impossible to plan for the long hauler. Decoupling demand and supply are a major underlying trend and new government-imposed bans on nitrogen fertilizer use (to reduce carbon emissions) will add to market pressures and/or eliminate growth potential.
Nitrogenous Fertilizer Market Segmentation Analysis
By Product
Urea held the largest market share around 38% in 2023. Due to ease of handling, high solubility, and compatibility with a wide range of soils, it is the fertilizer most commonly used in agriculture. Moreover, urea is cheaper and more accessible so it is farmers' number one option, especially in developing parts of the world where fertilizer subsidized promotes urea application. It is also applied by employing broadcasting, foliar spraying, and fertigated, making it more adapted. In addition, there will be ongoing development of slow-release and stabilized urea formulations, which enhance nitrogen efficiency, minimize losses, and contribute to sustainable agriculture. These are the parameters that overall drive the leadership of urea in the nitrogenous fertilizer space.
By Application
Cereals & Grains held the largest market share around 34% in 2023. It is owing to the high demand for cereals & grains across the globe and their large-scale production. Nitrogen inputs are important for the growth, yield, and soil fertility of staple crops such as wheat, rice, corn, and barley. Nitrogenous fertilizers are placed before other fertilizers is an essential step given the global population and concerns about food security. Moreover, the demand for nitrogen-based fertilizers is further created in this segment due to intensive farming practices and the growing areas under high-yield hybrid varieties. Increased fertilizer application is also a consequence of the rapidly expanding biofuel sector, especially in corn ethanol production. This means that we can expect cereals and grains, on which the majority of the global food supply chains stand, to remain on the market in a strong place, because they depend on nitrogen fertilizers.
Nitrogenous Fertilizer Market Regional Outlook
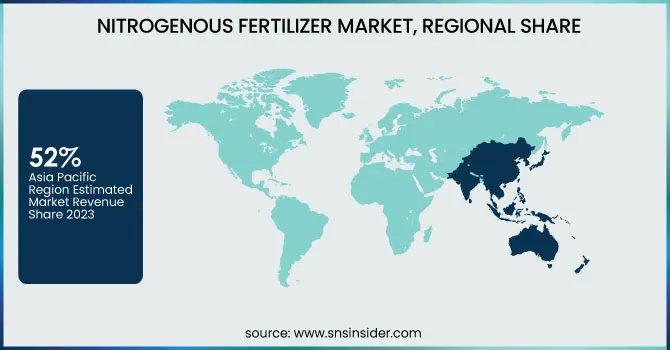
Asia Pacific held the largest market share around 52% in 2023. Due to the high agricultural practices, huge population, and the rising requirement of food the nitrogenous fertilizer market is highly growing in the Asia Pacific region which has become the leading market segment in terms of market share. China, India, and Indonesia turn out to be the largest consumers and producers of fertilizers on the globe due to the immense cultivation of cereals/grains/rice/wheat and maize. In particular, the availability of nitrogen fertilizer at subsidized prices in many countries, especially India and China, also contributes to the increase in nitrogen fertilizer consumption this year. This is critical, as increasingly rapid urbanization and decreasing fertile land will require high-yield fertilizers to meet the food needs of the population. Increased presence by the major fertilizer manufacturers, advancement in precision farming, and increasing adoption of fertigation techniques have further led to the dominance of this region. The global nitrogenous fertilizer market is followed by Asia Pacific owing to supportive government initiatives and increasing agricultural exports.
North America is said to occupy a significant portion of the nitrogenous fertilizer market considering that the region possesses a very high level of adoption of advanced agricultural technologies and at the same time is the stronghold for high-yield food crops like corn, wheat soybean, etc. Canada and the United States are the leading users of nitrogen fertilizers (urea and ammonia, in particular) to increase crop yield, thereby meeting the demands of food, animal feed, and biofuels. Some of these gains have also been made possible through the presence of well-developed supply chains, modern watering a garden and precision cultivating in the area. Domestic production can be backed up by rich major fertilizer producers and natural gas resources a key raw material for ammonia production to reduce reliance on imports. Additionally, continued market growth in North America is supported by governmental backing of sustainable farming practices and the consumer shift towards specialty fertilizers.
Get Customized Report as per Your Business Requirement - Enquiry Now
Key Players
-
CF Industries (Nitram, Anhydrous Ammonia)
-
Yara International (YaraBela, YaraMila)
-
PhosAgro (Urea N 46.2, Ammophos)
-
Uralchem (Ammonium Nitrate (AN), Urea)
-
Grupa Azoty (Pulan, Saletrosan)
-
OCI Global (Dynamon, Urea Ammonium Nitrate (UAN))
-
SABIC (Granular Urea, Ammonia)
-
Qatar Fertilizer Company (QAFCO) (Prilled Urea, Ammonia)
-
K+S Group (soluCN, Korn-Kali)
-
CSBP Fertilizers (Flexi-N, Urea)
-
Coromandel International (Gromor Urea, Gromor 28:28:0)
-
Nutrien (ESN Smart Nitrogen, Ammonium Sulfate)
-
EuroChem (Nitroammophoska (NPK), Urea)
-
Koch Fertilizer (Anhydrous Ammonia, Urea)
-
Indian Farmers Fertilizer Cooperative Limited (IFFCO) (Urea, DAP)
-
Sinofert Holdings Limited (Urea, Ammonium Bicarbonate)
-
The Mosaic Company (MicroEssentials, Ammonia)
-
OCI Nitrogen (Calcium Ammonium Nitrate (CAN), Urea)
-
Petrobras Fertilizantes (Ammonia, Urea)
-
Borealis AG (Ammonium Nitrate, Urea)
Recent Development:
-
In February 2024, Pivot Bio introduced the N-Ovator program, linking companies such as Nestlé and Heineken with farmers utilizing nitrogen-fixing microbes as an alternative to synthetic fertilizers, to lower greenhouse gas emissions.
-
In December 2023, CF Industries completed the USD 1.68 billion acquisition of the Waggaman ammonia production facility in Louisiana from Australia's Incitec Pivot. The facility boasts an annual ammonia production capacity of 880,000 tonnes.
| Report Attributes | Details |
|---|---|
| Market Size in 2023 | USD 63.55 Billion |
| Market Size by 2032 | USD 105.26 Billion |
| CAGR | CAGR of 5.78 % From 2024 to 2032 |
| Base Year | 2023 |
| Forecast Period | 2024-2032 |
| Historical Data | 2020-2022 |
| Report Scope & Coverage | Market Size, Segments Analysis, Competitive Landscape, Regional Analysis, DROC & SWOT Analysis, Forecast Outlook |
| Key Segments | •By Product (Urea, Methylene Urea, Ammonium Nitrate, Ammonium Sulfate, Ammonia, Calcium Ammonium Nitrate, Others) •By Application (Cereals & Grains, Oilseeds & Pulses, Fruits & Vegetables, Others) |
| Regional Analysis/Coverage | North America (US, Canada, Mexico), Europe (Eastern Europe [Poland, Romania, Hungary, Turkey, Rest of Eastern Europe] Western Europe] Germany, France, UK, Italy, Spain, Netherlands, Switzerland, Austria, Rest of Western Europe]), Asia Pacific (China, India, Japan, South Korea, Vietnam, Singapore, Australia, Rest of Asia Pacific), Middle East & Africa (Middle East [UAE, Egypt, Saudi Arabia, Qatar, Rest of Middle East], Africa [Nigeria, South Africa, Rest of Africa], Latin America (Brazil, Argentina, Colombia, Rest of Latin America) |
| Company Profiles | CF Industries, Yara International, PhosAgro, Uralchem, Grupa Azoty, OCI Global, SABIC, Qatar Fertilizer Company (QAFCO), K+S Group, CSBP Fertilisers, Coromandel International, Nutrien, EuroChem, Koch Fertilizer, Indian Farmers Fertiliser Cooperative Limited (IFFCO), Sinofert Holdings Limited, The Mosaic Company, OCI Nitrogen, Petrobras Fertilizantes, Borealis AG |
