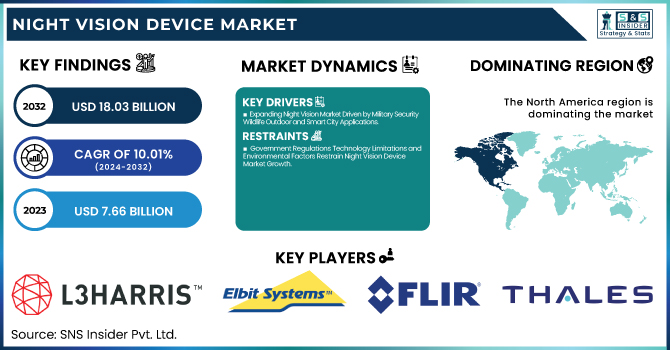
The Night Vision Device Market Size was valued at USD 7.66 Billion in 2023 and is expected to reach USD 18.03 Billion by 2032 and grow at a CAGR of 10.01% over the forecast period 2024-2032. The Night Vision Device market is witnessing advancements in fab capacity utilization, with increased production of CMOS and infrared sensors to meet growing demand. Technology performance metrics are improving, including enhanced image resolution, longer battery life, and lightweight designs. AI and machine learning are driving real-time object recognition and noise reduction in low-light conditions. However, rising cybersecurity risks pose concerns, as wireless night vision devices and surveillance systems are increasingly vulnerable to hacking and unauthorized access. U.S. Night Vision Device Market is Growing Due to Military Modernization, Law Enforcement Needs, and Increasing Civilian Applications: 2024. More than 10,000 Enhanced Night Vision Goggle-Binocular (ENVG-B) units have been fielded with divisions including the 1st Infantry and 82nd Airborne among others, according to the U.S. Army. So far 3,100 ENVG-B units have been acquired for the U.S. Marine Corps.
The U.S. Night Vision Device Market is estimated to be USD 2.24 Billion in 2023 and is projected to grow at a CAGR of 9.84%. The U.S. Night Vision Device market is growing due to growing demand across various applications military, security, and commercial is further driven by technological advancements in AI-driven imaging, thermal sensors, and cost-effective solutions.
Key Drivers:
Expanding Night Vision Market Driven by Military Security Wildlife Outdoor and Smart City Applications
The Night Vision Device (NVD) market is anticipated to grow substantially due to an increase in military, defense, and security applications. Governments all over the world are pouring money into new technologies to strengthen border security, fight terrorism, and improve law enforcement practices. Moreover, the growing use of night vision technology for wildlife spotting, hunting, and outdoor recreational activities is also driving the growth of the market. The reduced cost of manufacturing, combined with technological advances like thermal imaging, infrared illumination, and AI-powered enhancements executes device performance to newer heights, thus expanding the horizon for NVD beyond just military applications to commercial and civilian usage as well. In addition, the use of Night Vision among automotive and smart city surveillance systems has opened up opportunities for the market.
Restrain:
Government Regulations Technology Limitations and Environmental Factors Restrain Night Vision Device Market Growth
The important factor hampering the growth of the night vision device (NVD) market is the strict norms imposed by the government for NVD applications, especially in cases of civilian and commercial use. Night vision technology is one of a few dozen topics in the world upon which most nations impose tight export controls and licensing requirements due to its importance for military and defense purposes. Moreover, the potential abuse and unlawful access to advanced non-vulnerability descriptors (NVDs) has resulted in limitation that restricts the market growth. The other one is the technical throat above the evening imaginative and prescient tools, that is, they may be reliant on exterior light sources, might have a smaller detection variety within the severe darkness, and will also be extremely affected by dank, rain or smoke and can lose effectiveness at sure times due to those environmental conditions.
Opportunity:
Advancements in Technology and Expanding Applications Drive Growth Opportunities in Night Vision Device Market
As manufacturing technologies mature, there are ample opportunities in this market, especially with many low-cost, lightweight, and portable near-eye displays entering the civilian market. Demand is also partly driven by the increasing embrace of night vision-enabled smart cameras and Augmented Reality (AR) based headgear for security and personal safety. Moreover, high investment in research & development of next-generation imaging intensifiers and advanced thermal imaging solutions will likely bolster various future innovations. The increase in NVDs for rescue and navigation and wildlife conservation use is also an area for opportunity. Continued unlocking of use cases beyond conventional defense domains is set to persist as a pivotal trend determining the future of the night vision device landscape.
Challenges:
Emerging Technologies and Portability Challenges Pose Competition and Innovation Needs for Night Vision Devices
Meanwhile, NVDs face competition from alternative technologies achieving rapid advancements, such as LiDAR-based night vision or AI-powered low-light imaging. The resolvability of images from these emerging solutions is greater than what we have today from conventional night vision systems, and smaller size, weight, and power will allow properly engineered SOF-optimized systems to replace conventional systems for some applications. Moreover, because of the size and high power consumption in the case of traditional night vision devices often means that their portability and long-term use by the end-user is limited. The ability to miniaturize devices, improve their battery life, and allow them to function in a variety of environments will need to be addressed if these technological gaps are to be eliminated in the future.
By Type
Goggles accounted for the largest share of the night vision devices market during the year 2023, with a value of 28.2% as they are extensively used in military, law enforcement, and security. NVGs, on the other hand, are a hands-free option that can add great additional tactical and situational awareness as well as depth perception making them an excellent option for tactical purposes, operations, and surveillance. In defense and aviation, their integration with helmet-mounted systems also drives up demand. Meanwhile, better lightweight designs and new imaging technology are making it more appealing for both military and civilian users.
Monocular & binocular night vision devices are expected to register the fastest CAGR from 2024 to 2032, owing to increasing demand for wildlife enthusiasts, hunters, and adventurers. Their portability, low cost, and flexibility allow for commercial and personal applications. The growing use of night vision monoculars in search & rescue activities and navigation is another factor boosting the market growth, providing enormous opportunities in the upcoming years.
By Technology
In 2023, thermal imaging held 40.2% of the market for night vision devices, thanks to its ability to find heat signatures in complete darkness, smoke, and rain. Thermal imaging, which is heavily applicable in the military, defense, surveillance, and industrial inspections, provides an effective solution for accuracy in threat detection, search & rescue, and border security. Drones, autonomous vehicles, and smart security systems see an increasing integration of AI, all of which only reinforce its market leadership. Furthermore, recent developments in uncooled thermal sensors have made them more cost-effective for commercial and civil use.
The imaging intensifier technology is predicted to grow the fastest between 2024-2032 owing to its cost, lightweight designs, and real-time image enhancement. It is employed in military night vision goggles, scopes, and low-light cameras. Continuous enhancements in the field of high-resolution intensifiers and digital night vision capabilities will further enhance its penetration in the market, which is expected to continue to remain one of the prominent growth segments of the global combat systems industry.
By Application
The night vision device market for security & surveillance held the largest market share of about 25.2% in 2023, owing to the higher demand for night vision devices for various applications such as border security, law enforcement, and critical infrastructure protection. Even now, governmental and private security agencies alike are investing in night-vision cameras, goggles, and scopes to improve 24-hour surveillance. Moreover, using thermal imaging and Artificial Intelligence (AI)-based analytics in security systems improving threat detection enhanced night vision into a necessity for crime prevention and defense purposes.
The wildlife spotting & hunting segment is projected to register the fastest car over the forecast duration (2024 to 2032) owing to the increasing preference for hunting during nights, wildlife watching, and an increase in ecotourism. Rising demand for affordable and lightweight night vision monoculars, binoculars, and thermal scopes is boosting the market growth. In addition, conservationists and researchers have adopted night vision devices for tracking endangered species and monitoring the behavior of nocturnal wildlife, presenting high-growth market opportunities.
By End-use
The largest market share of 63.5% is accounted to the Government, Military & Defense sector for the night vision device market in 2023 and this is due to the increasing investment in border security, tactical missions, and military modernization programs. Many defense forces across the globe are adopting night vision goggles, thermal scopes, and imaging systems to improve capabilities in low-light poison. Moreover, general concerns over terrorism, cross-border conflicts, and internal security threats are increasing the demand for high-performance night vision solutions. Its market position is also being further solidified with this integration right into AI usage, augmented reality (AR), and next-gen sensor technologies.
The consumer segment is projected to register the highest CAGR from 2024 to 2032, owing to the growing usage of night vision devices for hunting, wildlife viewing, adventure activity, and personal security. New developments in inexpensive, lightweight, and high-resolution night vision monoculars, binoculars, and day/night digital night vision cameras bring these sought-after devices into the price range of the average consumer. Additionally, smart home security is highly popular and enhances market growth with scouting activities.
Regional Analysis
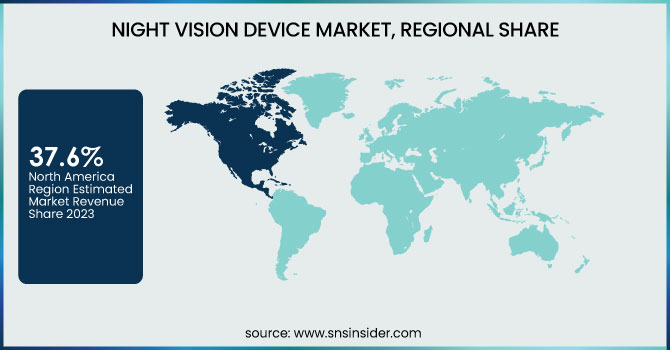
North America accounted for a 37.6% share of the night vision device market in 2023, owing to high government expenditures on defense, homeland security, and law enforcement. As an example, the U.S. DoD (Department of Defense) and CBP (Customs and Border Protection) are full speed ahead on advanced night vision goggles, thermal cameras, and surveillance system purchases to support military and border operations. Also, increasing usage of night vision technology solutions for wildlife research, outdoor sports, and private security, is expected to foster market growth during the forecast period. Leading companies such as FLIR Systems (Teledyne FLIR) and L3Harris Technologies developed next-gen night vision solutions that can be used in military as well as commercial applications.
During the forecast period of 2024 to 2032, the Asia-Pacific region is anticipated to dominate with the fastest-growing CAGR, bolstered by growing defense budgets, escalating security risks, and expanding adoption of consumer applications. Demand for night vision devices is being driven by aggressive upgrades of defense and surveillance infrastructure in countries such as China and India. As an illustration, the BSF of India is procuring high-performance night vision goggles and thermal imagers especially those developed by the Chinese PLA for border security through LAC. Further aiding the growth of the market are also the trends of night hunting, adventure tourism, and wildlife conservation which are increasingly gaining popularity across Australia and Southeast Asia.
Some of the major players in the Night Vision Device Market are:
L3Harris Technologies Inc. (AN/PVS-14 Night Vision Monocular)
RTX (formerly Raytheon Technologies Corporation) (AN/PAS-13 Thermal Weapon Sight)
BAE Systems (ENVG III/FWS-I Integrated Night Vision System)
Elbit Systems Ltd. (Enhanced Night Vision Goggle – Binocular (ENVG-B))
FLIR Systems Inc. (FLIR Breach PTQ136 Thermal Monocular)
Bharat Electronics Limited (Passive Night Vision Goggles)
Thales Group (Minie-D/Minie-D NVG Night Vision Goggles)
American Technologies Network Corp. (ATN Corp.) (ATN PVS7 Night Vision Goggles)
Collins Aerospace (AN/AVS-10 Panoramic Night Vision Goggle)
Meopta Optica S.R.O (MeoNight 1.1 Night Vision Device)
Harris Corporation (F5032 Lightweight Night Vision Binocular)
Photonis (Exosens) (16mm Auto-Gated Image Intensifier Tubes)
Intevac Inc. (ISIE10 EBAPS Night Vision Sensor)
NVLS - NightVision Lasers Spain (Wide Field of View Night Vision Goggles)
N-Vision Optics (PVS-7 Night Vision Goggles)
Recent Trends
In January 2025, L3Harris Technologies secured a USD 263 million U.S. Army contract for Enhanced Night Vision Goggle–Binocular (ENVG-B) production, enhancing soldiers' situational awareness and battlefield connectivity.
Report Attributes | Details |
Market Size in 2023 | USD 7.66 Billion |
Market Size by 2032 | USD 18.03 Billion |
CAGR | CAGR of 10.01% From 2024 to 2032 |
Base Year | 2023 |
Forecast Period | 2024-2032 |
Historical Data | 2020-2022 |
Report Scope & Coverage | Market Size, Segments Analysis, Competitive Landscape, Regional Analysis, DROC & SWOT Analysis, Forecast Outlook |
Key Segments | • By Type (Camera, Goggles, Scope, Monocular & Binoculars, Others) • By Technology (Imaging Intensifier, Thermal Imaging, Infrared Illumination, Other Emerging Technologies) • By Product (Security & Surveillance, Wildlife Spotting & Hunting, Wildlife Conservation, Navigation, Paranormal Research, Others) • By End-use (Government, Military & Defense, Consumer) |
Regional Analysis/Coverage | North America (US, Canada, Mexico), Europe (Eastern Europe [Poland, Romania, Hungary, Turkey, Rest of Eastern Europe] Western Europe] Germany, France, UK, Italy, Spain, Netherlands, Switzerland, Austria, Rest of Western Europe]), Asia Pacific (China, India, Japan, South Korea, Vietnam, Singapore, Australia, Rest of Asia Pacific), Middle East & Africa (Middle East [UAE, Egypt, Saudi Arabia, Qatar, Rest of Middle East], Africa [Nigeria, South Africa, Rest of Africa], Latin America (Brazil, Argentina, Colombia, Rest of Latin America) |
Company Profiles | L3Harris Technologies Inc., RTX (formerly Raytheon Technologies Corporation), BAE Systems, Elbit Systems Ltd., FLIR Systems Inc., Bharat Electronics Limited, Thales Group, American Technologies Network Corp. (ATN Corp.), Collins Aerospace, Meopta Optica S.R.O, Harris Corporation, Photonis (Exosens), Intevac Inc., NVLS - NightVision Lasers Spain, N-Vision Optics. |
Ans: The Night Vision Device Market is expected to grow at a CAGR of 10.01%.
Ans: The Night Vision Device Market size was USD 2.88 billion in 2023 and is expected to Reach USD 18.03 billion by 2032.
Ans: The major key drivers for the growth of the Night Vision Device Market include increasing defense and military expenditures, rising demand for security and surveillance, advancements in thermal imaging technology, and growing consumer adoption for outdoor and commercial applications.
Ans: The Goggle segment dominated the Night Vision Device market in 2023.
Ans: In 2023, the North American region led the Night Vision Device market, capturing approximately 37.64% of the total market share.
Table of Contents:
1. Introduction
1.1 Market Definition
1.2 Scope (Inclusion and Exclusions)
1.3 Research Assumptions
2. Executive Summary
2.1 Market Overview
2.2 Regional Synopsis
2.3 Competitive Summary
3. Research Methodology
3.1 Top-Down Approach
3.2 Bottom-up Approach
3.3. Data Validation
3.4 Primary Interviews
4. Market Dynamics Impact Analysis
4.1 Market Driving Factors Analysis
4.1.1 Drivers
4.1.2 Restraints
4.1.3 Opportunities
4.1.4 Challenges
4.2 PESTLE Analysis
4.3 Porter’s Five Forces Model
5. Statistical Insights and Trends Reporting
5.1 Fab Capacity Utilization
5.2 Night Vision Technology Performance Metrics
5.3 AI & Machine Learning in Night Vision Devices
5.4 Cybersecurity Risks & Hacking Concerns in Night Vision Devices
6. Competitive Landscape
6.1 List of Major Companies, By Region
6.2 Market Share Analysis, By Region
6.3 Product Benchmarking
6.3.1 Product specifications and features
6.3.2 Pricing
6.4 Strategic Initiatives
6.4.1 Marketing and promotional activities
6.4.2 Distribution and Supply Chain Strategies
6.4.3 Expansion plans and new product launches
6.4.4 Strategic partnerships and collaborations
6.5 Technological Advancements
6.6 Market Positioning and Branding
7. Night Vision Device Market Segmentation, By Type
7.1 Chapter Overview
7.2 Camera
7.2.1 Camera Market Trends Analysis (2020-2032)
7.2.2 Camera Market Size Estimates and Forecasts to 2032 (USD Billion)
7.3 Goggle
7.3.1 Goggle Market Trends Analysis (2020-2032)
7.3.2 Goggle Market Size Estimates and Forecasts to 2032 (USD Billion)
7.4 Scope
7.4.1 Scope Market Trends Analysis (2020-2032)
7.4.2 Scope Market Size Estimates and Forecasts to 2032 (USD Billion)
7.5 Monocular & Binoculars
7.5.1 Monocular & Binoculars Market Trends Analysis (2020-2032)
7.5.2 Monocular & Binoculars Market Size Estimates and Forecasts to 2032 (USD Billion)
7.6 Others
7.6.1 Others Market Trends Analysis (2020-2032)
7.6.2 Others Market Size Estimates and Forecasts to 2032 (USD Billion)
8. Night Vision Device Market Segmentation, By Technology
8.1 Chapter Overview
8.2 Imaging Intensifier
8.2.1 Imaging Intensifier Market Trends Analysis (2020-2032)
8.2.2 Imaging Intensifier Market Size Estimates and Forecasts to 2032 (USD Billion)
8.3 Thermal Imaging
8.3.1 Thermal Imaging Market Trends Analysis (2020-2032)
8.3.2 Thermal Imaging Market Size Estimates and Forecasts to 2032 (USD Billion)
8.4 Infrared Illumination
8.4.1 Infrared Illumination Market Trends Analysis (2020-2032)
8.4.2 Infrared Illumination Market Size Estimates and Forecasts to 2032 (USD Billion)
8.5 Other Emerging Technologies
8.5.1 Other Emerging Technologies Market Trends Analysis (2020-2032)
8.5.2 Other Emerging Technologies Market Size Estimates and Forecasts to 2032 (USD Billion)
9. Night Vision Device Market Segmentation, By Application
9.1 Chapter Overview
9.2 Security & Surveillance
9.2.1 Security & Surveillance Market Trends Analysis (2020-2032)
9.2.2 Security & Surveillance Market Size Estimates and Forecasts to 2032 (USD Billion)
9.3 Wildlife Spotting & Hunting
9.3.1 Wildlife Spotting & Hunting Market Trends Analysis (2020-2032)
9.3.2 Wildlife Spotting & Hunting Market Size Estimates and Forecasts to 2032 (USD Billion)
9.4 Wildlife Conservation
9.4.1 Wildlife Conservation Market Trends Analysis (2020-2032)
9.4.2 Wildlife Conservation Market Size Estimates and Forecasts to 2032 (USD Billion)
9.5 Navigation
9.5.1 Navigation Market Trends Analysis (2020-2032)
9.5.2 Navigation Market Size Estimates and Forecasts to 2032 (USD Billion)
9.6 Paranormal Research
9.6.1 Paranormal Research Market Trends Analysis (2020-2032)
9.6.2 Paranormal Research Market Size Estimates and Forecasts to 2032 (USD Billion)
9.7 Others
9.7.1 Others Market Trends Analysis (2020-2032)
9.7.2 Others Market Size Estimates and Forecasts to 2032 (USD Billion)
10. Night Vision Device Market Segmentation, By End-use
10.1 Chapter Overview
10.2 Government, Military & Defense
10.2.1 Government, Military & Defense Market Trends Analysis (2020-2032)
10.2.2 Government, Military & Defense Market Size Estimates and Forecasts to 2032 (USD Billion)
10.3 Consumer
10.3.1 Consumer Market Trends Analysis (2020-2032)
10.3.2 Consumer Market Size Estimates and Forecasts to 2032 (USD Billion)
11. Regional Analysis
11.1 Chapter Overview
11.2 North America
11.2.1 Trends Analysis
11.2.2 North America Night Vision Device Market Estimates and Forecasts, by Country (2020-2032) (USD Billion)
11.2.3 North America Night Vision Device Market Estimates and Forecasts, By Type (2020-2032) (USD Billion)
11.2.4 North America Night Vision Device Market Estimates and Forecasts, By Technology (2020-2032) (USD Billion)
11.2.5 North America Night Vision Device Market Estimates and Forecasts, By Application (2020-2032) (USD Billion)
11.2.6 North America Night Vision Device Market Estimates and Forecasts, By End-use (2020-2032) (USD Billion)
11.2.7 USA
11.2.7.1 USA Night Vision Device Market Estimates and Forecasts, By Type (2020-2032) (USD Billion)
11.2.7.2 USA Night Vision Device Market Estimates and Forecasts, By Technology (2020-2032) (USD Billion)
11.2.7.3 USA Night Vision Device Market Estimates and Forecasts, By Application (2020-2032) (USD Billion)
11.2.7.4 USA Night Vision Device Market Estimates and Forecasts, By End-use (2020-2032) (USD Billion)
11.2.8 Canada
11.2.8.1 Canada Night Vision Device Market Estimates and Forecasts, By Type (2020-2032) (USD Billion)
11.2.8.2 Canada Night Vision Device Market Estimates and Forecasts, By Technology (2020-2032) (USD Billion)
11.2.8.3 Canada Night Vision Device Market Estimates and Forecasts, By Application (2020-2032) (USD Billion)
11.2.8.4 Canada Night Vision Device Market Estimates and Forecasts, By End-use (2020-2032) (USD Billion)
11.2.9 Mexico
11.2.9.1 Mexico Night Vision Device Market Estimates and Forecasts, By Type (2020-2032) (USD Billion)
11.2.9.2 Mexico Night Vision Device Market Estimates and Forecasts, By Technology (2020-2032) (USD Billion)
11.2.9.3 Mexico Night Vision Device Market Estimates and Forecasts, By Application (2020-2032) (USD Billion)
11.2.9.4 Mexico Night Vision Device Market Estimates and Forecasts, By End-use (2020-2032) (USD Billion)
11.3 Europe
11.3.1 Eastern Europe
11.3.1.1 Trends Analysis
11.3.1.2 Eastern Europe Night Vision Device Market Estimates and Forecasts, by Country (2020-2032) (USD Billion)
11.3.1.3 Eastern Europe Night Vision Device Market Estimates and Forecasts, By Type (2020-2032) (USD Billion)
11.3.1.4 Eastern Europe Night Vision Device Market Estimates and Forecasts, By Technology (2020-2032) (USD Billion)
11.3.1.5 Eastern Europe Night Vision Device Market Estimates and Forecasts, By Application (2020-2032) (USD Billion)
11.3.1.6 Eastern Europe Night Vision Device Market Estimates and Forecasts, By End-use (2020-2032) (USD Billion)
11.3.1.7 Poland
11.3.1.7.1 Poland Night Vision Device Market Estimates and Forecasts, By Type (2020-2032) (USD Billion)
11.3.1.7.2 Poland Night Vision Device Market Estimates and Forecasts, By Technology (2020-2032) (USD Billion)
11.3.1.7.3 Poland Night Vision Device Market Estimates and Forecasts, By Application (2020-2032) (USD Billion)
11.3.1.7.4 Poland Night Vision Device Market Estimates and Forecasts, By End-use (2020-2032) (USD Billion)
11.3.1.8 Romania
11.3.1.8.1 Romania Night Vision Device Market Estimates and Forecasts, By Type (2020-2032) (USD Billion)
11.3.1.8.2 Romania Night Vision Device Market Estimates and Forecasts, By Technology (2020-2032) (USD Billion)
11.3.1.8.3 Romania Night Vision Device Market Estimates and Forecasts, By Application (2020-2032) (USD Billion)
11.3.1.8.4 Romania Night Vision Device Market Estimates and Forecasts, By End-use (2020-2032) (USD Billion)
11.3.1.9 Hungary
11.3.1.9.1 Hungary Night Vision Device Market Estimates and Forecasts, By Type (2020-2032) (USD Billion)
11.3.1.9.2 Hungary Night Vision Device Market Estimates and Forecasts, By Technology (2020-2032) (USD Billion)
11.3.1.9.3 Hungary Night Vision Device Market Estimates and Forecasts, By Application (2020-2032) (USD Billion)
11.3.1.9.4 Hungary Night Vision Device Market Estimates and Forecasts, By End-use (2020-2032) (USD Billion)
11.3.1.10 Turkey
11.3.1.10.1 Turkey Night Vision Device Market Estimates and Forecasts, By Type (2020-2032) (USD Billion)
11.3.1.10.2 Turkey Night Vision Device Market Estimates and Forecasts, By Technology (2020-2032) (USD Billion)
11.3.1.10.3 Turkey Night Vision Device Market Estimates and Forecasts, By Application (2020-2032) (USD Billion)
11.3.1.10.4 Turkey Night Vision Device Market Estimates and Forecasts, By End-use (2020-2032) (USD Billion)
11.3.1.11 Rest of Eastern Europe
11.3.1.11.1 Rest of Eastern Europe Night Vision Device Market Estimates and Forecasts, By Type (2020-2032) (USD Billion)
11.3.1.11.2 Rest of Eastern Europe Night Vision Device Market Estimates and Forecasts, By Technology (2020-2032) (USD Billion)
11.3.1.11.3 Rest of Eastern Europe Night Vision Device Market Estimates and Forecasts, By Application (2020-2032) (USD Billion)
11.3.1.11.4 Rest of Eastern Europe Night Vision Device Market Estimates and Forecasts, By End-use (2020-2032) (USD Billion)
11.3.2 Western Europe
11.3.2.1 Trends Analysis
11.3.2.2 Western Europe Night Vision Device Market Estimates and Forecasts, by Country (2020-2032) (USD Billion)
11.3.2.3 Western Europe Night Vision Device Market Estimates and Forecasts, By Type (2020-2032) (USD Billion)
11.3.2.4 Western Europe Night Vision Device Market Estimates and Forecasts, By Technology (2020-2032) (USD Billion)
11.3.2.5 Western Europe Night Vision Device Market Estimates and Forecasts, By Application (2020-2032) (USD Billion)
11.3.2.6 Western Europe Night Vision Device Market Estimates and Forecasts, By End-use (2020-2032) (USD Billion)
11.3.2.7 Germany
11.3.2.7.1 Germany Night Vision Device Market Estimates and Forecasts, By Type (2020-2032) (USD Billion)
11.3.2.7.2 Germany Night Vision Device Market Estimates and Forecasts, By Technology (2020-2032) (USD Billion)
11.3.2.7.3 Germany Night Vision Device Market Estimates and Forecasts, By Application (2020-2032) (USD Billion)
11.3.2.7.4 Germany Night Vision Device Market Estimates and Forecasts, By End-use (2020-2032) (USD Billion)
11.3.2.8 France
11.3.2.8.1 France Night Vision Device Market Estimates and Forecasts, By Type (2020-2032) (USD Billion)
11.3.2.8.2 France Night Vision Device Market Estimates and Forecasts, By Technology (2020-2032) (USD Billion)
11.3.2.8.3 France Night Vision Device Market Estimates and Forecasts, By Application (2020-2032) (USD Billion)
11.3.2.8.4 France Night Vision Device Market Estimates and Forecasts, By End-use (2020-2032) (USD Billion)
11.3.2.9 UK
11.3.2.9.1 UK Night Vision Device Market Estimates and Forecasts, By Type (2020-2032) (USD Billion)
11.3.2.9.2 UK Night Vision Device Market Estimates and Forecasts, By Technology (2020-2032) (USD Billion)
11.3.2.9.3 UK Night Vision Device Market Estimates and Forecasts, By Application (2020-2032) (USD Billion)
11.3.2.9.4 UK Night Vision Device Market Estimates and Forecasts, By End-use (2020-2032) (USD Billion)
11.3.2.10 Italy
11.3.2.10.1 Italy Night Vision Device Market Estimates and Forecasts, By Type (2020-2032) (USD Billion)
11.3.2.10.2 Italy Night Vision Device Market Estimates and Forecasts, By Technology (2020-2032) (USD Billion)
11.3.2.10.3 Italy Night Vision Device Market Estimates and Forecasts, By Application (2020-2032) (USD Billion)
11.3.2.10.4 Italy Night Vision Device Market Estimates and Forecasts, By End-use (2020-2032) (USD Billion)
11.3.2.11 Spain
11.3.2.11.1 Spain Night Vision Device Market Estimates and Forecasts, By Type (2020-2032) (USD Billion)
11.3.2.11.2 Spain Night Vision Device Market Estimates and Forecasts, By Technology (2020-2032) (USD Billion)
11.3.2.11.3 Spain Night Vision Device Market Estimates and Forecasts, By Application (2020-2032) (USD Billion)
11.3.2.11.4 Spain Night Vision Device Market Estimates and Forecasts, By End-use (2020-2032) (USD Billion)
11.3.2.12 Netherlands
11.3.2.12.1 Netherlands Night Vision Device Market Estimates and Forecasts, By Type (2020-2032) (USD Billion)
11.3.2.12.2 Netherlands Night Vision Device Market Estimates and Forecasts, By Technology (2020-2032) (USD Billion)
11.3.2.12.3 Netherlands Night Vision Device Market Estimates and Forecasts, By Application (2020-2032) (USD Billion)
11.3.2.12.4 Netherlands Night Vision Device Market Estimates and Forecasts, By End-use (2020-2032) (USD Billion)
11.3.2.13 Switzerland
11.3.2.13.1 Switzerland Night Vision Device Market Estimates and Forecasts, By Type (2020-2032) (USD Billion)
11.3.2.13.2 Switzerland Night Vision Device Market Estimates and Forecasts, By Technology (2020-2032) (USD Billion)
11.3.2.13.3 Switzerland Night Vision Device Market Estimates and Forecasts, By Application (2020-2032) (USD Billion)
11.3.2.13.4 Switzerland Night Vision Device Market Estimates and Forecasts, By End-use (2020-2032) (USD Billion)
11.3.2.14 Austria
11.3.2.14.1 Austria Night Vision Device Market Estimates and Forecasts, By Type (2020-2032) (USD Billion)
11.3.2.14.2 Austria Night Vision Device Market Estimates and Forecasts, By Technology (2020-2032) (USD Billion)
11.3.2.14.3 Austria Night Vision Device Market Estimates and Forecasts, By Application (2020-2032) (USD Billion)
11.3.2.14.4 Austria Night Vision Device Market Estimates and Forecasts, By End-use (2020-2032) (USD Billion)
11.3.2.15 Rest of Western Europe
11.3.2.15.1 Rest of Western Europe Night Vision Device Market Estimates and Forecasts, By Type (2020-2032) (USD Billion)
11.3.2.15.2 Rest of Western Europe Night Vision Device Market Estimates and Forecasts, By Technology (2020-2032) (USD Billion)
11.3.2.15.3 Rest of Western Europe Night Vision Device Market Estimates and Forecasts, By Application (2020-2032) (USD Billion)
11.3.2.15.4 Rest of Western Europe Night Vision Device Market Estimates and Forecasts, By End-use (2020-2032) (USD Billion)
11.4 Asia-Pacific
11.4.1 Trends Analysis
11.4.2 Asia-Pacific Night Vision Device Market Estimates and Forecasts, by Country (2020-2032) (USD Billion)
11.4.3 Asia-Pacific Night Vision Device Market Estimates and Forecasts, By Type (2020-2032) (USD Billion)
11.4.4 Asia-Pacific Night Vision Device Market Estimates and Forecasts, By Technology (2020-2032) (USD Billion)
11.4.5 Asia-Pacific Night Vision Device Market Estimates and Forecasts, By Application (2020-2032) (USD Billion)
11.4.6 Asia-Pacific Night Vision Device Market Estimates and Forecasts, By End-use (2020-2032) (USD Billion)
11.4.7 China
11.4.7.1 China Night Vision Device Market Estimates and Forecasts, By Type (2020-2032) (USD Billion)
11.4.7.2 China Night Vision Device Market Estimates and Forecasts, By Technology (2020-2032) (USD Billion)
11.4.7.3 China Night Vision Device Market Estimates and Forecasts, By Application (2020-2032) (USD Billion)
11.4.7.4 China Night Vision Device Market Estimates and Forecasts, By End-use (2020-2032) (USD Billion)
11.4.8 India
11.4.8.1 India Night Vision Device Market Estimates and Forecasts, By Type (2020-2032) (USD Billion)
11.4.8.2 India Night Vision Device Market Estimates and Forecasts, By Technology (2020-2032) (USD Billion)
11.4.8.3 India Night Vision Device Market Estimates and Forecasts, By Application (2020-2032) (USD Billion)
11.4.8.4 India Night Vision Device Market Estimates and Forecasts, By End-use (2020-2032) (USD Billion)
11.4.9 Japan
11.4.9.1 Japan Night Vision Device Market Estimates and Forecasts, By Type (2020-2032) (USD Billion)
11.4.9.2 Japan Night Vision Device Market Estimates and Forecasts, By Technology (2020-2032) (USD Billion)
11.4.9.3 Japan Night Vision Device Market Estimates and Forecasts, By Application (2020-2032) (USD Billion)
11.4.9.4 Japan Night Vision Device Market Estimates and Forecasts, By End-use (2020-2032) (USD Billion)
11.4.10 South Korea
11.4.10.1 South Korea Night Vision Device Market Estimates and Forecasts, By Type (2020-2032) (USD Billion)
11.4.10.2 South Korea Night Vision Device Market Estimates and Forecasts, By Technology (2020-2032) (USD Billion)
11.4.10.3 South Korea Night Vision Device Market Estimates and Forecasts, By Application (2020-2032) (USD Billion)
11.4.10.4 South Korea Night Vision Device Market Estimates and Forecasts, By End-use (2020-2032) (USD Billion)
11.4.11 Vietnam
11.4.11.1 Vietnam Night Vision Device Market Estimates and Forecasts, By Type (2020-2032) (USD Billion)
11.4.11.2 Vietnam Night Vision Device Market Estimates and Forecasts, By Technology (2020-2032) (USD Billion)
11.4.11.3 Vietnam Night Vision Device Market Estimates and Forecasts, By Application (2020-2032) (USD Billion)
11.4.11.4 Vietnam Night Vision Device Market Estimates and Forecasts, By End-use (2020-2032) (USD Billion)
11.4.12 Singapore
11.4.12.1 Singapore Night Vision Device Market Estimates and Forecasts, By Type (2020-2032) (USD Billion)
11.4.12.2 Singapore Night Vision Device Market Estimates and Forecasts, By Technology (2020-2032) (USD Billion)
11.4.12.3 Singapore Night Vision Device Market Estimates and Forecasts, By Application (2020-2032) (USD Billion)
11.4.12.4 Singapore Night Vision Device Market Estimates and Forecasts, By End-use (2020-2032) (USD Billion)
11.4.13 Australia
11.4.13.1 Australia Night Vision Device Market Estimates and Forecasts, By Type (2020-2032) (USD Billion)
11.4.13.2 Australia Night Vision Device Market Estimates and Forecasts, By Technology (2020-2032) (USD Billion)
11.4.13.3 Australia Night Vision Device Market Estimates and Forecasts, By Application (2020-2032) (USD Billion)
11.4.13.4 Australia Night Vision Device Market Estimates and Forecasts, By End-use (2020-2032) (USD Billion)
11.4.14 Rest of Asia-Pacific
11.4.14.1 Rest of Asia-Pacific Night Vision Device Market Estimates and Forecasts, By Type (2020-2032) (USD Billion)
11.4.14.2 Rest of Asia-Pacific Night Vision Device Market Estimates and Forecasts, By Technology (2020-2032) (USD Billion)
11.4.14.3 Rest of Asia-Pacific Night Vision Device Market Estimates and Forecasts, By Application (2020-2032) (USD Billion)
11.4.14.4 Rest of Asia-Pacific Night Vision Device Market Estimates and Forecasts, By End-use (2020-2032) (USD Billion)
11.5 Middle East and Africa
11.5.1 Middle East
11.5.1.1 Trends Analysis
11.5.1.2 Middle East Night Vision Device Market Estimates and Forecasts, by Country (2020-2032) (USD Billion)
11.5.1.3 Middle East Night Vision Device Market Estimates and Forecasts, By Type (2020-2032) (USD Billion)
11.5.1.4 Middle East Night Vision Device Market Estimates and Forecasts, By Technology (2020-2032) (USD Billion)
11.5.1.5 Middle East Night Vision Device Market Estimates and Forecasts, By Application (2020-2032) (USD Billion)
11.5.1.6 Middle East Night Vision Device Market Estimates and Forecasts, By End-use (2020-2032) (USD Billion)
11.5.1.7 UAE
11.5.1.7.1 UAE Night Vision Device Market Estimates and Forecasts, By Type (2020-2032) (USD Billion)
11.5.1.7.2 UAE Night Vision Device Market Estimates and Forecasts, By Technology (2020-2032) (USD Billion)
11.5.1.7.3 UAE Night Vision Device Market Estimates and Forecasts, By Application (2020-2032) (USD Billion)
11.5.1.7.4 UAE Night Vision Device Market Estimates and Forecasts, By End-use (2020-2032) (USD Billion)
11.5.1.8 Egypt
11.5.1.8.1 Egypt Night Vision Device Market Estimates and Forecasts, By Type (2020-2032) (USD Billion)
11.5.1.8.2 Egypt Night Vision Device Market Estimates and Forecasts, By Technology (2020-2032) (USD Billion)
11.5.1.8.3 Egypt Night Vision Device Market Estimates and Forecasts, By Application (2020-2032) (USD Billion)
11.5.1.8.4 Egypt Night Vision Device Market Estimates and Forecasts, By End-use (2020-2032) (USD Billion)
11.5.1.9 Saudi Arabia
11.5.1.9.1 Saudi Arabia Night Vision Device Market Estimates and Forecasts, By Type (2020-2032) (USD Billion)
11.5.1.9.2 Saudi Arabia Night Vision Device Market Estimates and Forecasts, By Technology (2020-2032) (USD Billion)
11.5.1.9.3 Saudi Arabia Night Vision Device Market Estimates and Forecasts, By Application (2020-2032) (USD Billion)
11.5.1.9.4 Saudi Arabia Night Vision Device Market Estimates and Forecasts, By End-use (2020-2032) (USD Billion)
11.5.1.10 Qatar
11.5.1.10.1 Qatar Night Vision Device Market Estimates and Forecasts, By Type (2020-2032) (USD Billion)
11.5.1.10.2 Qatar Night Vision Device Market Estimates and Forecasts, By Technology (2020-2032) (USD Billion)
11.5.1.10.3 Qatar Night Vision Device Market Estimates and Forecasts, By Application (2020-2032) (USD Billion)
11.5.1.10.4 Qatar Night Vision Device Market Estimates and Forecasts, By End-use (2020-2032) (USD Billion)
11.5.1.11 Rest of Middle East
11.5.1.11.1 Rest of Middle East Night Vision Device Market Estimates and Forecasts, By Type (2020-2032) (USD Billion)
11.5.1.11.2 Rest of Middle East Night Vision Device Market Estimates and Forecasts, By Technology (2020-2032) (USD Billion)
11.5.1.11.3 Rest of Middle East Night Vision Device Market Estimates and Forecasts, By Application (2020-2032) (USD Billion)
11.5.1.11.4 Rest of Middle East Night Vision Device Market Estimates and Forecasts, By End-use (2020-2032) (USD Billion)
11.5.2 Africa
11.5.2.1 Trends Analysis
11.5.2.2 Africa Night Vision Device Market Estimates and Forecasts, by Country (2020-2032) (USD Billion)
11.5.2.3 Africa Night Vision Device Market Estimates and Forecasts, By Type (2020-2032) (USD Billion)
11.5.2.4 Africa Night Vision Device Market Estimates and Forecasts, By Technology (2020-2032) (USD Billion)
11.5.2.5 Africa Night Vision Device Market Estimates and Forecasts, By Application (2020-2032) (USD Billion)
11.5.2.6 Africa Night Vision Device Market Estimates and Forecasts, By End-use (2020-2032) (USD Billion)
11.5.2.7 South Africa
11.5.2.7.1 South Africa Night Vision Device Market Estimates and Forecasts, By Type (2020-2032) (USD Billion)
11.5.2.7.2 South Africa Night Vision Device Market Estimates and Forecasts, By Technology (2020-2032) (USD Billion)
11.5.2.7.3 South Africa Night Vision Device Market Estimates and Forecasts, By Application (2020-2032) (USD Billion)
11.5.2.7.4 South Africa Night Vision Device Market Estimates and Forecasts, By End-use (2020-2032) (USD Billion)
11.5.2.8 Nigeria
11.5.2.8.1 Nigeria Night Vision Device Market Estimates and Forecasts, By Type (2020-2032) (USD Billion)
11.5.2.8.2 Nigeria Night Vision Device Market Estimates and Forecasts, By Technology (2020-2032) (USD Billion)
11.5.2.8.3 Nigeria Night Vision Device Market Estimates and Forecasts, By Application (2020-2032) (USD Billion)
11.5.2.8.4 Nigeria Night Vision Device Market Estimates and Forecasts, By End-use (2020-2032) (USD Billion)
11.5.2.9 Rest of Africa
11.5.2.9.1 Rest of Africa Night Vision Device Market Estimates and Forecasts, By Type (2020-2032) (USD Billion)
11.5.2.9.2 Rest of Africa Night Vision Device Market Estimates and Forecasts, By Technology (2020-2032) (USD Billion)
11.5.2.9.3 Rest of Africa Night Vision Device Market Estimates and Forecasts, By Application (2020-2032) (USD Billion)
11.5.2.9.4 Rest of Africa Night Vision Device Market Estimates and Forecasts, By End-use (2020-2032) (USD Billion)
11.6 Latin America
11.6.1 Trends Analysis
11.6.2 Latin America Night Vision Device Market Estimates and Forecasts, by Country (2020-2032) (USD Billion)
11.6.3 Latin America Night Vision Device Market Estimates and Forecasts, By Type (2020-2032) (USD Billion)
11.6.4 Latin America Night Vision Device Market Estimates and Forecasts, By Technology (2020-2032) (USD Billion)
11.6.5 Latin America Night Vision Device Market Estimates and Forecasts, By Application (2020-2032) (USD Billion)
11.6.6 Latin America Night Vision Device Market Estimates and Forecasts, By End-use (2020-2032) (USD Billion)
11.6.7 Brazil
11.6.7.1 Brazil Night Vision Device Market Estimates and Forecasts, By Type (2020-2032) (USD Billion)
11.6.7.2 Brazil Night Vision Device Market Estimates and Forecasts, By Technology (2020-2032) (USD Billion)
11.6.7.3 Brazil Night Vision Device Market Estimates and Forecasts, By Application (2020-2032) (USD Billion)
11.6.7.4 Brazil Night Vision Device Market Estimates and Forecasts, By End-use (2020-2032) (USD Billion)
11.6.8 Argentina
11.6.8.1 Argentina Night Vision Device Market Estimates and Forecasts, By Type (2020-2032) (USD Billion)
11.6.8.2 Argentina Night Vision Device Market Estimates and Forecasts, By Technology (2020-2032) (USD Billion)
11.6.8.3 Argentina Night Vision Device Market Estimates and Forecasts, By Application (2020-2032) (USD Billion)
11.6.8.4 Argentina Night Vision Device Market Estimates and Forecasts, By End-use (2020-2032) (USD Billion)
11.6.9 Colombia
11.6.9.1 Colombia Night Vision Device Market Estimates and Forecasts, By Type (2020-2032) (USD Billion)
11.6.9.2 Colombia Night Vision Device Market Estimates and Forecasts, By Technology (2020-2032) (USD Billion)
11.6.9.3 Colombia Night Vision Device Market Estimates and Forecasts, By Application (2020-2032) (USD Billion)
11.6.9.4 Colombia Night Vision Device Market Estimates and Forecasts, By End-use (2020-2032) (USD Billion)
11.6.10 Rest of Latin America
11.6.10.1 Rest of Latin America Night Vision Device Market Estimates and Forecasts, By Type (2020-2032) (USD Billion)
11.6.10.2 Rest of Latin America Night Vision Device Market Estimates and Forecasts, By Technology (2020-2032) (USD Billion)
11.6.10.3 Rest of Latin America Night Vision Device Market Estimates and Forecasts, By Application (2020-2032) (USD Billion)
11.6.10.4 Rest of Latin America Night Vision Device Market Estimates and Forecasts, By End-use (2020-2032) (USD Billion)
12. Company Profiles
12.1 L3Harris Technologies Inc
12.1.1 Company Overview
12.1.2 Financial
12.1.3 Products/ Services Offered
12.1.4 SWOT Analysis
12.2 RTX (formerly Raytheon Technologies Corporation).
12.2.1 Company Overview
12.2.2 Financial
12.2.3 Products/ Services Offered
12.2.4 SWOT Analysis
12.3 BAE Systems
12.3.1 Company Overview
12.3.2 Financial
12.3.3 Products/ Services Offered
12.3.4 SWOT Analysis
12.4 Elbit Systems Ltd
12.4.1 Company Overview
12.4.2 Financial
12.4.3 Products/ Services Offered
12.4.4 SWOT Analysis
12.5 FLIR Systems Inc
12.5.1 Company Overview
12.5.2 Financial
12.5.3 Products/ Services Offered
12.5.4 SWOT Analysis
12.6 Bharat Electronics Limited
12.6.1 Company Overview
12.6.2 Financial
12.6.3 Products/ Services Offered
12.6.4 SWOT Analysis
12.7 Thales Group
12.7.1 Company Overview
12.7.2 Financial
12.7.3 Products/ Services Offered
12.7.4 SWOT Analysis
12.8 American Technologies Network Corp.
12.8.1 Company Overview
12.8.2 Financial
12.8.3 Products/ Services Offered
12.8.4 SWOT Analysis
12.9 Collins Aerospace
12.9.1 Company Overview
12.9.2 Financial
12.9.3 Products/ Services Offered
12.9.4 SWOT Analysis
12.10 Meopta Optica S.R.O
12.10.1 Company Overview
12.10.2 Financial
12.10.3 Products/ Services Offered
12.10.4 SWOT Analysis
13. Use Cases and Best Practices
14. Conclusion
An accurate research report requires proper strategizing as well as implementation. There are multiple factors involved in the completion of good and accurate research report and selecting the best methodology to compete the research is the toughest part. Since the research reports we provide play a crucial role in any company’s decision-making process, therefore we at SNS Insider always believe that we should choose the best method which gives us results closer to reality. This allows us to reach at a stage wherein we can provide our clients best and accurate investment to output ratio.
Each report that we prepare takes a timeframe of 350-400 business hours for production. Starting from the selection of titles through a couple of in-depth brain storming session to the final QC process before uploading our titles on our website we dedicate around 350 working hours. The titles are selected based on their current market cap and the foreseen CAGR and growth.
The 5 steps process:
Step 1: Secondary Research:
Secondary Research or Desk Research is as the name suggests is a research process wherein, we collect data through the readily available information. In this process we use various paid and unpaid databases which our team has access to and gather data through the same. This includes examining of listed companies’ annual reports, Journals, SEC filling etc. Apart from this our team has access to various associations across the globe across different industries. Lastly, we have exchange relationships with various university as well as individual libraries.
Step 2: Primary Research
When we talk about primary research, it is a type of study in which the researchers collect relevant data samples directly, rather than relying on previously collected data. This type of research is focused on gaining content specific facts that can be sued to solve specific problems. Since the collected data is fresh and first hand therefore it makes the study more accurate and genuine.
We at SNS Insider have divided Primary Research into 2 parts.
Part 1 wherein we interview the KOLs of major players as well as the upcoming ones across various geographic regions. This allows us to have their view over the market scenario and acts as an important tool to come closer to the accurate market numbers. As many as 45 paid and unpaid primary interviews are taken from both the demand and supply side of the industry to make sure we land at an accurate judgement and analysis of the market.
This step involves the triangulation of data wherein our team analyses the interview transcripts, online survey responses and observation of on filed participants. The below mentioned chart should give a better understanding of the part 1 of the primary interview.
Part 2: In this part of primary research the data collected via secondary research and the part 1 of the primary research is validated with the interviews from individual consultants and subject matter experts.
Consultants are those set of people who have at least 12 years of experience and expertise within the industry whereas Subject Matter Experts are those with at least 15 years of experience behind their back within the same space. The data with the help of two main processes i.e., FGDs (Focused Group Discussions) and IDs (Individual Discussions). This gives us a 3rd party nonbiased primary view of the market scenario making it a more dependable one while collation of the data pointers.
Step 3: Data Bank Validation
Once all the information is collected via primary and secondary sources, we run that information for data validation. At our intelligence centre our research heads track a lot of information related to the market which includes the quarterly reports, the daily stock prices, and other relevant information. Our data bank server gets updated every fortnight and that is how the information which we collected using our primary and secondary information is revalidated in real time.
Step 4: QA/QC Process
After all the data collection and validation our team does a final level of quality check and quality assurance to get rid of any unwanted or undesired mistakes. This might include but not limited to getting rid of the any typos, duplication of numbers or missing of any important information. The people involved in this process include technical content writers, research heads and graphics people. Once this process is completed the title gets uploader on our platform for our clients to read it.
Step 5: Final QC/QA Process:
This is the last process and comes when the client has ordered the study. In this process a final QA/QC is done before the study is emailed to the client. Since we believe in giving our clients a good experience of our research studies, therefore, to make sure that we do not lack at our end in any way humanly possible we do a final round of quality check and then dispatch the study to the client.
Key Segments:
By Type
Camera
Goggle
Scope
Monocular & Binoculars
Others
By Technology
Imaging Intensifier
Thermal Imaging
Infrared Illumination
Other Emerging Technologies
By End-use
Security & Surveillance
Wildlife Spotting & Hunting
Wildlife Conservation
Navigation
Paranormal Research
Others
By Vertical
Government, Military & Defense
Consumer
Request for Segment Customization as per your Business Requirement: Segment Customization Request
Regional Coverage:
North America
US
Canada
Mexico
Europe
Eastern Europe
Poland
Romania
Hungary
Turkey
Rest of Eastern Europe
Western Europe
Germany
France
UK
Italy
Spain
Netherlands
Switzerland
Austria
Rest of Western Europe
Asia Pacific
China
India
Japan
South Korea
Vietnam
Singapore
Australia
Rest of Asia Pacific
Middle East & Africa
Middle East
UAE
Egypt
Saudi Arabia
Qatar
Rest of Middle East
Africa
Nigeria
South Africa
Rest of Africa
Latin America
Brazil
Argentina
Colombia
Rest of Latin America
Request for Country Level Research Report: Country Level Customization Request
Available Customization
With the given market data, SNS Insider offers customization as per the company’s specific needs. The following customization options are available for the report:
Detailed Volume Analysis
Criss-Cross segment analysis (e.g. Product X Application)
Competitive Product Benchmarking
Geographic Analysis
Additional countries in any of the regions
Customized Data Representation
Detailed analysis and profiling of additional market players
The Motion Control Market Size was valued at USD 16.27 billion in 2023 and is expected to grow at a CAGR of 5.87% to reach USD 27.10 billion by 2032.
The Gallium Nitride Semiconductor Devices Market size was valued at USD 2.25 billion in 2022. It is estimated to hit USD 13.58 billion by 2030 and grow at a growth rate of 25.2% during the forecast period of 2023-2030.
The Rotary and RF Rotary Joints Market Size was valued at USD 1.61 Billion in 2023 and is expected to grow at 5.09% CAGR to reach USD 2.52 Billion by 2032.
The Pressure Sensor Market Size was valued at USD 19.7 billion in 2023 and is expected to reach USD 28.52 billion by 2032 and grow at a CAGR of 4.2% over the forecast period 2024-2032.
LED Driver IC Market Size was valued at USD 3.79 Billion in 2023 and is expected to reach USD 16.05 Billion by 2032, at a CAGR of 17.46% During 2024-2032.
The Inspection Camera System Market size was valued at USD 351.98 Million in 2023 and is expected to reach USD 933.51 Million by 2032 and grow at a CAGR of 11.47% over the forecast period 2024-2032.
Hi! Click one of our member below to chat on Phone