Get More Information on Nicotine Replacement Therapy Market - Request Sample Report
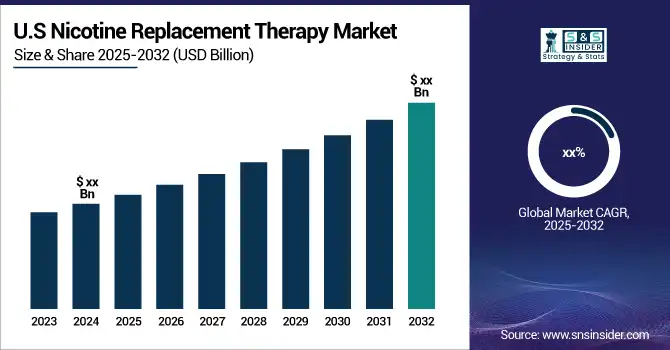
The Nicotine Replacement Therapy Market Size was valued at USD 2.83 Billion in 2023, and is expected to reach USD 4.27 Billion by 2032, and grow at a CAGR of 4.83%.
The nicotine replacement therapy (NRT) market is propelled by a global push towards reducing tobacco consumption, driven by comprehensive health initiatives and public health policies. The World Health Organization (WHO) reports that tobacco use is a major public health crisis, causing around 8 million deaths each year from smoking-related illnesses. This alarming statistic underscores the urgent need for effective smoking cessation tools. In the United States, the Centers for Disease Control and Prevention (CDC) reveals that more than half of smokers express a strong desire to quit, and approximately 30% are actively seeking assistance through various cessation aids. This heightened awareness about the health risks of smoking and the effectiveness of cessation products is contributing to the growing demand for NRT solutions.
Country
|
Total Smokers 2022
|
Nauru | 48.30% |
Myanmar | 44.40% |
Kiribati | 39.70% |
Papua New Guinea | 39.60% |
Bulgaria | 39.50% |
Serbia | 39.50% |
Timor Leste | 38.70% |
Indonesia | 38.20% |
Croatia | 37% |
Solomon Islands | 36.90% |
Notes: High Smoking Prevalence: Nauru has the highest smoking rate among the listed countries, with 48.30% of the population being smokers. Myanmar, Kiribati, and Papua New Guinea also have relatively high smoking rates, ranging from 38.20% to 44.40%.
Regional Variations: The countries listed exhibit a range of smoking rates, suggesting that there are regional variations in smoking prevalence. For example, countries in Oceania (Nauru, Kiribati, Papua New Guinea, Solomon Islands) generally have higher smoking rates compared to those in Europe (Bulgaria, Serbia, Croatia).
Potential Factors Influencing Smoking Rates: Several factors can influence smoking rates in different countries, including cultural norms, socioeconomic conditions, tobacco control policies, and public health initiatives.
Governments worldwide are playing a crucial role in this shift by investing in public health campaigns designed to promote smoking cessation and reduce tobacco use. These campaigns often include educational programs, smoking cessation support services, and subsidies for NRT products, making them more affordable and accessible. Furthermore, stricter anti-smoking regulations, such as smoke-free laws in public places and higher tobacco taxes, are reinforcing efforts to discourage smoking and encourage the use of NRT products. The global regulatory environment is also becoming increasingly supportive of smoking cessation efforts. For example, the implementation of standardized packaging for tobacco products and plain packaging laws are being adopted in various countries to reduce the appeal of smoking and increase the visibility of health warnings. These measures, combined with government-sponsored cessation programs and incentives, are expected to drive further growth in the NRT market, highlighting the importance of these products in global tobacco control strategies.
Key Drivers:
Shifting Preference Toward Use of OTC Nicotine Replacement Therapy (NRT) Products for Smoking Cessation.
Increasing Awareness Coupled with Rising Government Initiatives to Promote NRT Adoption, Fueling Market Growth.
Restraints:
Side Effects Associated with NRT Products are expected to Hamper the Growth of the Market.
Availability of Alternative Products Such as electronic cigarettes (e-cigarettes) Impeding the Market Growth.
Opportunity:
A Growing Demand for Personalized NRT Approaches Tailored to Individual Needs and Preferences Opens Up Significant Opportunities in Nicotine Replacement Therapy Market.
Integration with Digital Health Technologies Present Substantial Growth Opportunities.
By Type
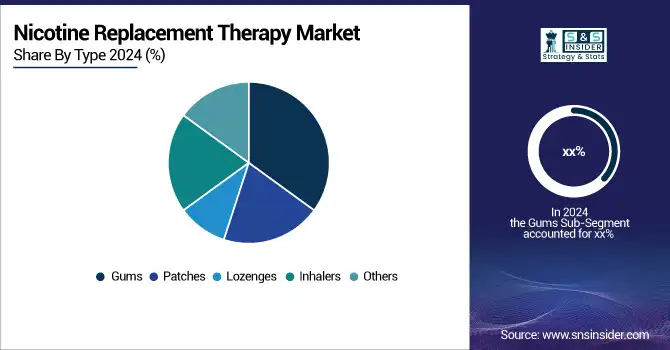
In 2023, nicotine gums captured 35% of the market share. This dominant position can be attributed to several key factors. Nicotine gums offer a direct and effective means to reduce cravings and withdrawal symptoms, which is crucial for individuals attempting to quit smoking. They are widely available over the counter, making them easily accessible to a broad audience. Additionally, nicotine gums are often recommended by healthcare professionals due to their proven efficacy and user-friendly nature. Government data from the National Institute on Drug Abuse (NIDA) highlights that nicotine gums are frequently included in smoking cessation programs and guidelines due to their effectiveness in managing nicotine cravings and supporting long-term quitting success. The popularity of nicotine gums is further supported by their flexibility in usage, as they can be used as needed throughout the day, which helps users manage their cravings more effectively. Moreover, advancements in gum formulations, such as improved flavors and extended-release options, have contributed to their sustained market leadership. The convenience and effectiveness of nicotine gums make them a preferred choice for many smokers seeking to quit, thereby reinforcing their significant share of the NRT market.
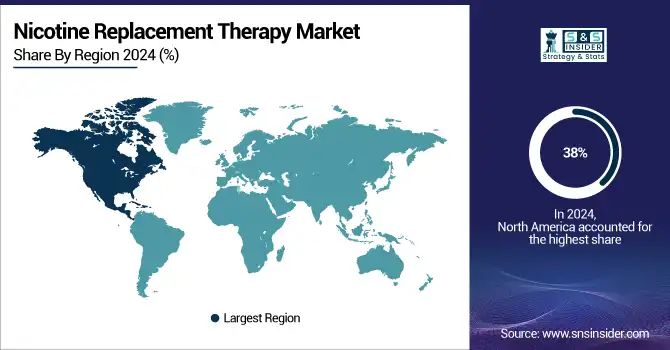
In 2023, North America was the dominant region in the NRT market, with 45% of the market share. The region's leadership can be attributed to a combination of factors, including a well-established healthcare infrastructure, high levels of public awareness about smoking cessation, and robust government support for tobacco control initiatives. Government statistics from the U.S. Food and Drug Administration (FDA) indicate that North America has implemented a range of effective tobacco control measures, such as comprehensive smoke-free laws, higher tobacco taxes, and extensive public health campaigns. These policies have significantly contributed to the high utilization of NRT products in the region. Additionally, the presence of major NRT manufacturers and suppliers in North America has played a crucial role in the market's growth. The region's strong emphasis on research and development, coupled with a favorable regulatory environment, has facilitated the introduction of innovative NRT products and solutions. This dynamic market environment, combined with substantial investments in smoking cessation programs and resources, has solidified North America's position as the leading region in the NRT market.
Need any customization research on Nicotine Replacement Therapy Market - Enquiry Now
Report Attributes | Details |
---|---|
Market Size in 2023 | US$ 2.83 Billion |
Market Size by 2032 | US$ 4.27 Billion |
CAGR | CAGR of 4.83% From 2024 to 2032 |
Base Year | 2023 |
Forecast Period | 2024-2032 |
Historical Data | 2020-2022 |
Report Scope & Coverage | Market Size, Segments Analysis, Competitive Landscape, Regional Analysis, DROC & SWOT Analysis, Forecast Outlook |
Key Segments | •By Type (Gums, Patches, Lozenges, Inhalers, and Others) •By Distribution Channel (Hospital & Retail Pharmacies, Retail Stores, and Online Channels) |
Regional Analysis/Coverage | North America (US, Canada, Mexico), Europe (Eastern Europe [Poland, Romania, Hungary, Turkey, Rest of Eastern Europe] Western Europe] Germany, France, UK, Italy, Spain, Netherlands, Switzerland, Austria, Rest of Western Europe]), Asia Pacific (China, India, Japan, South Korea, Vietnam, Singapore, Australia, Rest of Asia Pacific), Middle East & Africa (Middle East [UAE, Egypt, Saudi Arabia, Qatar, Rest of Middle East], Africa [Nigeria, South Africa, Rest of Africa], Latin America (Brazil, Argentina, Colombia, Rest of Latin America) |
Company Profiles | Imperial Brands plc, Fertin Pharma, Cipla Inc., GLENMARK PHARMACEUTICALS LTD., British American Tobacco plc, Philip Morris Products S.A., Japan Tobacco Inc., Pfizer Inc., Johnson & Johnson Private Limited, and PL Developments & Other players |
Key Drivers | •Shifting Preference Toward Use of OTC Nicotine Replacement Therapy (NRT) Products for Smoking Cessation. •Increasing Awareness Coupled with Rising Government Initiatives to Promote NRT Adoption, Fueling Market Growth. |
RESTRAINTS | •Side Effects Associated with NRT Products are expected to Hamper the Growth of the Market. •Availability of Alternative Products Such as electronic cigarettes (e-cigarettes) Impeding the Market Growth. |
Ans: The Nicotine Replacement Therapy Market size is expected to grow at a CAGR of 4.83% over the forecast period of 2024-2032.
Ans: The Nicotine Replacement Therapy Market is expected to Reach USD 4.27 billion by 2032.
Ans: Side Effects Associated with NRT Products and Availability of Alternative Products Such as electronic cigarettes (e-cigarettes) Impeding the Market Growth.
Ans: Shifting Preference Toward Use of OTC Nicotine Replacement Therapy (NRT) Products and Increasing Awareness Coupled with Rising Government Initiatives to Promote NRT Adoption, Fueling Market Growth.
Ans: The largest geographical market for Nicotine Replacement Therapy is North America.
Table of Contents
1. Introduction
1.1 Market Definition
1.2 Scope (Inclusion and Exclusions)
1.3 Research Assumptions
2. Executive Summary
2.1 Market Overview
2.2 Regional Synopsis
2.3 Competitive Summary
3. Research Methodology
3.1 Top-Down Approach
3.2 Bottom-up Approach
3.3. Data Validation
3.4 Primary Interviews
4. Market Dynamics Impact Analysis
4.1 Market Driving Factors Analysis
4.1.1 Drivers
4.1.2 Restraints
4.1.3 Opportunities
4.1.4 Challenges
4.2 PESTLE Analysis
4.3 Porter’s Five Forces Model
5. Statistical Insights and Trends Reporting
5.1 Production Capacity and Utilization Analysis by Region
5.2 Pricing Analysis by Region
5.3 Regulatory Impact: Effects of regulations on production and usage.
5.4 Environmental Metrics Analysis by Region
5.5 Innovation and R&D
6. Competitive Landscape
6.1 List of Major Companies, By Region
6.2 Market Share Analysis, By Region
6.3 Product Benchmarking
6.3.1 Product specifications and features
6.3.2 Pricing
6.4 Strategic Initiatives
6.4.1 Marketing and promotional activities
6.4.2 Distribution and Supply Chain Strategies
6.4.3 Expansion plans and new product launches
6.4.4 Strategic partnerships and collaborations
6.5 Technological Advancements
6.6 Market Positioning and Branding
7. Nicotine Replacement Therapy Market Segmentation, by Type
7.1 Chapter Overview
7.2 Gums
7.2.1 Gums Market Trends Analysis (2020-2032)
7.2.2 Gums Market Size Estimates and Forecasts to 2032 (USD Billion)
7.3 Patches
7.3.1 Patches Market Trends Analysis (2020-2032)
7.3.2 Patches Market Size Estimates and Forecasts to 2032 (USD Billion)
7.4 Lozenges
7.4.1 Lozenges Market Trends Analysis (2020-2032)
7.4.2 Lozenges Market Size Estimates and Forecasts to 2032 (USD Billion)
7.5 Inhalers
7.5.1 Inhalers Market Trends Analysis (2020-2032)
7.5.2 Inhalers Market Size Estimates and Forecasts to 2032 (USD Billion)
7.6 Others
7.6.1 Others Market Trends Analysis (2020-2032)
7.6.2 Others Market Size Estimates and Forecasts to 2032 (USD Billion)
8. Nicotine Replacement Therapy Market Segmentation, by Distribution Channel
8.1 Chapter Overview
8.2 Hospitals & Retail Pharmacies
8.2.1 Hospitals & Retail Pharmacies Market Trends Analysis (2020-2032)
8.2.2 Hospitals & Retail Pharmacies Market Size Estimates and Forecasts to 2032 (USD Billion)
8.3 Retail Stores
8.3.1 Retail Stores Market Trends Analysis (2020-2032)
8.3.2 Retail Stores Market Size Estimates and Forecasts to 2032 (USD Billion)
8.4 Online Channels
8.3.1 Online Channels Market Trends Analysis (2020-2032)
8.3.2 Online Channels Market Size Estimates and Forecasts to 2032 (USD Billion)
9. Regional Analysis
9.1 Chapter Overview
9.2 North America
9.2.1 Trends Analysis
9.2.2 North America Nicotine Replacement Therapy Market Estimates and Forecasts, by Country (2020-2032) (USD Billion)
9.2.3 North America Nicotine Replacement Therapy Market Estimates and Forecasts, by Type (2020-2032) (USD Billion)
9.2.4 North America Nicotine Replacement Therapy Market Estimates and Forecasts, by Distribution Channel (2020-2032) (USD Billion)
9.2.6 USA
9.2.6.1 USA Nicotine Replacement Therapy Market Estimates and Forecasts, by Type (2020-2032) (USD Billion)
9.2.6.2 USA Nicotine Replacement Therapy Market Estimates and Forecasts, by Distribution Channel (2020-2032) (USD Billion)
9.2.7 Canada
9.2.7.1 Canada Nicotine Replacement Therapy Market Estimates and Forecasts, by Type (2020-2032) (USD Billion)
9.2.7.2 Canada Nicotine Replacement Therapy Market Estimates and Forecasts, by Distribution Channel (2020-2032) (USD Billion)
9.2.8 Mexico
9.2.8.1 Mexico Nicotine Replacement Therapy Market Estimates and Forecasts, by Type (2020-2032) (USD Billion)
9.2.8.2 Mexico Nicotine Replacement Therapy Market Estimates and Forecasts, by Distribution Channel (2020-2032) (USD Billion)
9.3 Europe
9.3.1 Eastern Europe
9.3.1.1 Trends Analysis
9.3.1.2 Eastern Europe Nicotine Replacement Therapy Market Estimates and Forecasts, by Country (2020-2032) (USD Billion)
9.3.1.3 Eastern Europe Nicotine Replacement Therapy Market Estimates and Forecasts, by Type (2020-2032) (USD Billion)
9.3.1.4 Eastern Europe Nicotine Replacement Therapy Market Estimates and Forecasts, by Distribution Channel (2020-2032) (USD Billion)
9.3.1.6 Poland
9.3.1.6.1 Poland Nicotine Replacement Therapy Market Estimates and Forecasts, by Type (2020-2032) (USD Billion)
9.3.1.6.2 Poland Nicotine Replacement Therapy Market Estimates and Forecasts, by Distribution Channel (2020-2032) (USD Billion)
9.3.1.7 Romania
9.3.1.7.1 Romania Nicotine Replacement Therapy Market Estimates and Forecasts, by Type (2020-2032) (USD Billion)
9.3.1.7.2 Romania Nicotine Replacement Therapy Market Estimates and Forecasts, by Distribution Channel (2020-2032) (USD Billion)
9.3.1.8 Hungary
9.3.1.8.1 Hungary Nicotine Replacement Therapy Market Estimates and Forecasts, by Type (2020-2032) (USD Billion)
9.3.1.8.2 Hungary Nicotine Replacement Therapy Market Estimates and Forecasts, by Distribution Channel (2020-2032) (USD Billion)
9.3.1.9 Turkey
9.3.1.9.1 Turkey Nicotine Replacement Therapy Market Estimates and Forecasts, by Type (2020-2032) (USD Billion)
9.3.1.9.2 Turkey Nicotine Replacement Therapy Market Estimates and Forecasts, by Distribution Channel (2020-2032) (USD Billion)
9.3.1.9 Rest of Eastern Europe
9.3.1.9.1 Rest of Eastern Europe Nicotine Replacement Therapy Market Estimates and Forecasts, by Type (2020-2032) (USD Billion)
9.3.1.9.2 Rest of Eastern Europe Nicotine Replacement Therapy Market Estimates and Forecasts, by Distribution Channel (2020-2032) (USD Billion)
9.3.2 Western Europe
9.3.2.1 Trends Analysis
9.3.2.2 Western Europe Nicotine Replacement Therapy Market Estimates and Forecasts, by Country (2020-2032) (USD Billion)
9.3.2.3 Western Europe Nicotine Replacement Therapy Market Estimates and Forecasts, by Type (2020-2032) (USD Billion)
9.3.2.4 Western Europe Nicotine Replacement Therapy Market Estimates and Forecasts, by Distribution Channel (2020-2032) (USD Billion)
9.3.2.6 Germany
9.3.2.6.1 Germany Nicotine Replacement Therapy Market Estimates and Forecasts, by Type (2020-2032) (USD Billion)
9.3.2.6.2 Germany Nicotine Replacement Therapy Market Estimates and Forecasts, by Distribution Channel (2020-2032) (USD Billion)
9.3.2.7 France
9.3.2.7.1 France Nicotine Replacement Therapy Market Estimates and Forecasts, by Type (2020-2032) (USD Billion)
9.3.2.7.2 France Nicotine Replacement Therapy Market Estimates and Forecasts, by Distribution Channel (2020-2032) (USD Billion)
9.3.2.8 UK
9.3.2.8.1 UK Nicotine Replacement Therapy Market Estimates and Forecasts, by Type (2020-2032) (USD Billion)
9.3.2.8.2 UK Nicotine Replacement Therapy Market Estimates and Forecasts, by Distribution Channel (2020-2032) (USD Billion)
9.3.2.9 Italy
9.3.2.9.1 Italy Nicotine Replacement Therapy Market Estimates and Forecasts, by Type (2020-2032) (USD Billion)
9.3.2.9.2 Italy Nicotine Replacement Therapy Market Estimates and Forecasts, by Distribution Channel (2020-2032) (USD Billion)
9.3.2.9 Spain
9.3.2.9.1 Spain Nicotine Replacement Therapy Market Estimates and Forecasts, by Type (2020-2032) (USD Billion)
9.3.2.9.2 Spain Nicotine Replacement Therapy Market Estimates and Forecasts, by Distribution Channel (2020-2032) (USD Billion)
9.3.2.10 Netherlands
9.3.2.10.1 Netherlands Nicotine Replacement Therapy Market Estimates and Forecasts, by Type (2020-2032) (USD Billion)
9.3.2.10.2 Netherlands Nicotine Replacement Therapy Market Estimates and Forecasts, by Distribution Channel (2020-2032) (USD Billion)
9.3.2.12 Switzerland
9.3.2.12.1 Switzerland Nicotine Replacement Therapy Market Estimates and Forecasts, by Type (2020-2032) (USD Billion)
9.3.2.12.2 Switzerland Nicotine Replacement Therapy Market Estimates and Forecasts, by Distribution Channel (2020-2032) (USD Billion)
9.3.2.13 Austria
9.3.2.13.1 Austria Nicotine Replacement Therapy Market Estimates and Forecasts, by Type (2020-2032) (USD Billion)
9.3.2.13.2 Austria Nicotine Replacement Therapy Market Estimates and Forecasts, by Distribution Channel (2020-2032) (USD Billion)
9.3.2.14 Rest of Western Europe
9.3.2.14.1 Rest of Western Europe Nicotine Replacement Therapy Market Estimates and Forecasts, by Type (2020-2032) (USD Billion)
9.3.2.14.2 Rest of Western Europe Nicotine Replacement Therapy Market Estimates and Forecasts, by Distribution Channel (2020-2032) (USD Billion)
9.4 Asia Pacific
9.4.1 Trends Analysis
9.4.2 Asia Pacific Nicotine Replacement Therapy Market Estimates and Forecasts, by Country (2020-2032) (USD Billion)
9.4.3 Asia Pacific Nicotine Replacement Therapy Market Estimates and Forecasts, by Type (2020-2032) (USD Billion)
9.4.4 Asia Pacific Nicotine Replacement Therapy Market Estimates and Forecasts, by Distribution Channel (2020-2032) (USD Billion)
9.4.6 China
9.4.6.1 China Nicotine Replacement Therapy Market Estimates and Forecasts, by Type (2020-2032) (USD Billion)
9.4.6.2 China Nicotine Replacement Therapy Market Estimates and Forecasts, by Distribution Channel (2020-2032) (USD Billion)
9.4.7 India
9.4.7.1 India Nicotine Replacement Therapy Market Estimates and Forecasts, by Type (2020-2032) (USD Billion)
9.4.7.2 India Nicotine Replacement Therapy Market Estimates and Forecasts, by Distribution Channel (2020-2032) (USD Billion)
9.4.8 Japan
9.4.8.1 Japan Nicotine Replacement Therapy Market Estimates and Forecasts, by Type (2020-2032) (USD Billion)
9.4.8.2 Japan Nicotine Replacement Therapy Market Estimates and Forecasts, by Distribution Channel (2020-2032) (USD Billion)
9.4.9 South Korea
9.4.9.1 South Korea Nicotine Replacement Therapy Market Estimates and Forecasts, by Type (2020-2032) (USD Billion)
9.4.9.2 South Korea Nicotine Replacement Therapy Market Estimates and Forecasts, by Distribution Channel (2020-2032) (USD Billion)
9.4.9 Vietnam
9.4.9.1 Vietnam Nicotine Replacement Therapy Market Estimates and Forecasts, by Type (2020-2032) (USD Billion)
9.4.9.2 Vietnam Nicotine Replacement Therapy Market Estimates and Forecasts, by Distribution Channel (2020-2032) (USD Billion)
9.4.10 Singapore
9.4.10.1 Singapore Nicotine Replacement Therapy Market Estimates and Forecasts, by Type (2020-2032) (USD Billion)
9.4.10.2 Singapore Nicotine Replacement Therapy Market Estimates and Forecasts, by Distribution Channel (2020-2032) (USD Billion)
9.4.12 Australia
9.4.12.1 Australia Nicotine Replacement Therapy Market Estimates and Forecasts, by Type (2020-2032) (USD Billion)
9.4.12.2 Australia Nicotine Replacement Therapy Market Estimates and Forecasts, by Distribution Channel (2020-2032) (USD Billion)
9.4.13 Rest of Asia Pacific
9.4.13.1 Rest of Asia Pacific Nicotine Replacement Therapy Market Estimates and Forecasts, by Type (2020-2032) (USD Billion)
9.4.13.2 Rest of Asia Pacific Nicotine Replacement Therapy Market Estimates and Forecasts, by Distribution Channel (2020-2032) (USD Billion)
9.5 Middle East and Africa
9.5.1 Middle East
9.5.1.1 Trends Analysis
9.5.1.2 Middle East Nicotine Replacement Therapy Market Estimates and Forecasts, by Country (2020-2032) (USD Billion)
9.5.1.3 Middle East Nicotine Replacement Therapy Market Estimates and Forecasts, by Type (2020-2032) (USD Billion)
9.5.1.4 Middle East Nicotine Replacement Therapy Market Estimates and Forecasts, by Distribution Channel (2020-2032) (USD Billion)
9.5.1.6 UAE
9.5.1.6.1 UAE Nicotine Replacement Therapy Market Estimates and Forecasts, by Type (2020-2032) (USD Billion)
9.5.1.6.2 UAE Nicotine Replacement Therapy Market Estimates and Forecasts, by Distribution Channel (2020-2032) (USD Billion)
9.5.1.7 Egypt
9.5.1.7.1 Egypt Nicotine Replacement Therapy Market Estimates and Forecasts, by Type (2020-2032) (USD Billion)
9.5.1.7.2 Egypt Nicotine Replacement Therapy Market Estimates and Forecasts, by Distribution Channel (2020-2032) (USD Billion)
9.5.1.8 Saudi Arabia
9.5.1.8.1 Saudi Arabia Nicotine Replacement Therapy Market Estimates and Forecasts, by Type (2020-2032) (USD Billion)
9.5.1.8.2 Saudi Arabia Nicotine Replacement Therapy Market Estimates and Forecasts, by Distribution Channel (2020-2032) (USD Billion)
9.5.1.9 Qatar
9.5.1.9.1 Qatar Nicotine Replacement Therapy Market Estimates and Forecasts, by Type (2020-2032) (USD Billion)
9.5.1.9.2 Qatar Nicotine Replacement Therapy Market Estimates and Forecasts, by Distribution Channel (2020-2032) (USD Billion)
9.5.1.9 Rest of Middle East
9.5.1.9.1 Rest of Middle East Nicotine Replacement Therapy Market Estimates and Forecasts, by Type (2020-2032) (USD Billion)
9.5.1.9.2 Rest of Middle East Nicotine Replacement Therapy Market Estimates and Forecasts, by Distribution Channel (2020-2032) (USD Billion)
9.5.2 Africa
9.5.2.1 Trends Analysis
9.5.2.2 Africa Nicotine Replacement Therapy Market Estimates and Forecasts, by Country (2020-2032) (USD Billion)
9.5.2.3 Africa Nicotine Replacement Therapy Market Estimates and Forecasts, by Type (2020-2032) (USD Billion)
9.5.2.4 Africa Nicotine Replacement Therapy Market Estimates and Forecasts, by Distribution Channel (2020-2032) (USD Billion)
9.5.2.6 South Africa
9.5.2.6.1 South Africa Nicotine Replacement Therapy Market Estimates and Forecasts, by Type (2020-2032) (USD Billion)
9.5.2.6.2 South Africa Nicotine Replacement Therapy Market Estimates and Forecasts, by Distribution Channel (2020-2032) (USD Billion)
9.5.2.7 Nigeria
9.5.2.7.1 Nigeria Nicotine Replacement Therapy Market Estimates and Forecasts, by Type (2020-2032) (USD Billion)
9.5.2.7.2 Nigeria Nicotine Replacement Therapy Market Estimates and Forecasts, by Distribution Channel (2020-2032) (USD Billion)
9.5.2.8 Rest of Africa
9.5.2.8.1 Rest of Africa Nicotine Replacement Therapy Market Estimates and Forecasts, by Type (2020-2032) (USD Billion)
9.5.2.8.2 Rest of Africa Nicotine Replacement Therapy Market Estimates and Forecasts, by Distribution Channel (2020-2032) (USD Billion)
9.6 Latin America
9.6.1 Trends Analysis
9.6.2 Latin America Nicotine Replacement Therapy Market Estimates and Forecasts, by Country (2020-2032) (USD Billion)
9.6.3 Latin America Nicotine Replacement Therapy Market Estimates and Forecasts, by Type (2020-2032) (USD Billion)
9.6.4 Latin America Nicotine Replacement Therapy Market Estimates and Forecasts, by Distribution Channel (2020-2032) (USD Billion)
9.6.6 Brazil
9.6.6.1 Brazil Nicotine Replacement Therapy Market Estimates and Forecasts, by Type (2020-2032) (USD Billion)
9.6.6.2 Brazil Nicotine Replacement Therapy Market Estimates and Forecasts, by Distribution Channel (2020-2032) (USD Billion)
9.6.7 Argentina
9.6.7.1 Argentina Nicotine Replacement Therapy Market Estimates and Forecasts, by Type (2020-2032) (USD Billion)
9.6.7.2 Argentina Nicotine Replacement Therapy Market Estimates and Forecasts, by Distribution Channel (2020-2032) (USD Billion)
9.6.8 Colombia
9.6.8.1 Colombia Nicotine Replacement Therapy Market Estimates and Forecasts, by Type (2020-2032) (USD Billion)
9.6.8.2 Colombia Nicotine Replacement Therapy Market Estimates and Forecasts, by Distribution Channel (2020-2032) (USD Billion)
9.6.9 Rest of Latin America
9.6.9.1 Rest of Latin America Nicotine Replacement Therapy Market Estimates and Forecasts, by Type (2020-2032) (USD Billion)
9.6.9.2 Rest of Latin America Nicotine Replacement Therapy Market Estimates and Forecasts, by Distribution Channel (2020-2032) (USD Billion)
10. Company Profiles
10.1 Imperial Brands plc
10.1.1 Company Overview
10.1.2 Financial
10.1.3 Products/ Services Offered
10.1.4 SWOT Analysis
10.2 Fertin Pharma
10.2.1 Company Overview
10.2.2 Financial
10.2.3 Products/ Services Offered
10.2.4 SWOT Analysis
10.3 Cipla Inc.
10.3.1 Company Overview
10.3.2 Financial
10.3.3 Products/ Services Offered
10.3.4 SWOT Analysis
10.4 Glenmark Pharmaceuticals Ltd.
10.4.1 Company Overview
10.4.2 Financial
10.4.3 Products/ Services Offered
10.4.4 SWOT Analysis
10.5 British American Tobacco plc
10.5.1 Company Overview
10.5.2 Financial
10.5.3 Products/ Services Offered
10.5.4 SWOT Analysis
10.6 Philip Morris Products S.A.
10.6.1 Company Overview
10.6.2 Financial
10.6.3 Products/ Services Offered
10.6.4 SWOT Analysis
10.7 Japan Tobacco Inc.
10.7.1 Company Overview
10.7.2 Financial
10.7.3 Products/ Services Offered
10.7.4 SWOT Analysis
10.8 Pfizer Inc.
10.8.1 Company Overview
10.8.2 Financial
10.8.3 Products/ Services Offered
10.8.4 SWOT Analysis
10.9 Johnson & Johnson Private Limited
10.9.1 Company Overview
10.9.2 Financial
10.9.3 Products/ Services Offered
10.9.4 SWOT Analysis
10.10 PL Developments
10.10.1 Company Overview
10.10.2 Financial
10.10.3 Products/ Services Offered
10.10.4 SWOT Analysis
11. Use Cases and Best Practices
12. Conclusion
An accurate research report requires proper strategizing as well as implementation. There are multiple factors involved in the completion of good and accurate research report and selecting the best methodology to compete the research is the toughest part. Since the research reports we provide play a crucial role in any company’s decision-making process, therefore we at SNS Insider always believe that we should choose the best method which gives us results closer to reality. This allows us to reach at a stage wherein we can provide our clients best and accurate investment to output ratio.
Each report that we prepare takes a timeframe of 350-400 business hours for production. Starting from the selection of titles through a couple of in-depth brain storming session to the final QC process before uploading our titles on our website we dedicate around 350 working hours. The titles are selected based on their current market cap and the foreseen CAGR and growth.
The 5 steps process:
Step 1: Secondary Research:
Secondary Research or Desk Research is as the name suggests is a research process wherein, we collect data through the readily available information. In this process we use various paid and unpaid databases which our team has access to and gather data through the same. This includes examining of listed companies’ annual reports, Journals, SEC filling etc. Apart from this our team has access to various associations across the globe across different industries. Lastly, we have exchange relationships with various university as well as individual libraries.
Step 2: Primary Research
When we talk about primary research, it is a type of study in which the researchers collect relevant data samples directly, rather than relying on previously collected data. This type of research is focused on gaining content specific facts that can be sued to solve specific problems. Since the collected data is fresh and first hand therefore it makes the study more accurate and genuine.
We at SNS Insider have divided Primary Research into 2 parts.
Part 1 wherein we interview the KOLs of major players as well as the upcoming ones across various geographic regions. This allows us to have their view over the market scenario and acts as an important tool to come closer to the accurate market numbers. As many as 45 paid and unpaid primary interviews are taken from both the demand and supply side of the industry to make sure we land at an accurate judgement and analysis of the market.
This step involves the triangulation of data wherein our team analyses the interview transcripts, online survey responses and observation of on filed participants. The below mentioned chart should give a better understanding of the part 1 of the primary interview.
Part 2: In this part of primary research the data collected via secondary research and the part 1 of the primary research is validated with the interviews from individual consultants and subject matter experts.
Consultants are those set of people who have at least 12 years of experience and expertise within the industry whereas Subject Matter Experts are those with at least 15 years of experience behind their back within the same space. The data with the help of two main processes i.e., FGDs (Focused Group Discussions) and IDs (Individual Discussions). This gives us a 3rd party nonbiased primary view of the market scenario making it a more dependable one while collation of the data pointers.
Step 3: Data Bank Validation
Once all the information is collected via primary and secondary sources, we run that information for data validation. At our intelligence centre our research heads track a lot of information related to the market which includes the quarterly reports, the daily stock prices, and other relevant information. Our data bank server gets updated every fortnight and that is how the information which we collected using our primary and secondary information is revalidated in real time.
Step 4: QA/QC Process
After all the data collection and validation our team does a final level of quality check and quality assurance to get rid of any unwanted or undesired mistakes. This might include but not limited to getting rid of the any typos, duplication of numbers or missing of any important information. The people involved in this process include technical content writers, research heads and graphics people. Once this process is completed the title gets uploader on our platform for our clients to read it.
Step 5: Final QC/QA Process:
This is the last process and comes when the client has ordered the study. In this process a final QA/QC is done before the study is emailed to the client. Since we believe in giving our clients a good experience of our research studies, therefore, to make sure that we do not lack at our end in any way humanly possible we do a final round of quality check and then dispatch the study to the client.
Key Segments
By Type
Gums
Patches
Lozenges
Inhalers
Others
By Distribution Channel
Hospitals & Retail Pharmacies
Retail Stores
Online Channels
Request for Segment Customization as per your Business Requirement: Segment Customization Request
Regional Coverage:
North America
US
Canada
Mexico
Europe
Eastern Europe
Poland
Romania
Hungary
Turkey
Rest of Eastern Europe
Western Europe
Germany
France
UK
Italy
Spain
Netherlands
Switzerland
Austria
Rest of Western Europe
Asia Pacific
China
India
Japan
South Korea
Vietnam
Singapore
Australia
Rest of Asia Pacific
Middle East & Africa
Middle East
UAE
Egypt
Saudi Arabia
Qatar
Rest of the Middle East
Africa
Nigeria
South Africa
Rest of Africa
Latin America
Brazil
Argentina
Colombia
Rest of Latin America
Request for Country Level Research Report: Country Level Customization Request
Available Customization
With the given market data, SNS Insider offers customization as per the company’s specific needs. The following customization options are available for the report:
Product Analysis
Criss-Cross segment analysis (e.g. Product X Application)
Product Matrix which gives a detailed comparison of the product portfolio of each company
Geographic Analysis
Additional countries in any of the regions
Company Information
Detailed analysis and profiling of additional market players (Up to five)
The Stem Cell Therapy Market Size was valued at USD 287 million in 2023 and is witnessed to reach USD 1,113.12 million by 2032 and grow at a CAGR of 17.10% over the forecast period 2024-2032.
The Liver Cancer Therapeutics Market was valued at USD 3.62 billion in 2023 and is expected to reach USD 19.13 billion by 2032 at a compound annual growth rate of 20.3% during the forecast period from 2024 to 2032.
The Medical Aesthetics Market Size was valued at USD 13.27 billion in 2023 and is witnessed to reach USD 31.06 billion by 2032 and grow at a CAGR of 10.55% over the forecast period 2024-2032.
The Healthcare Quality Management Market Size was valued at USD 3.31 billion in 2023 and is expected to reach USD 10.22 billion by 2032 and grow at a CAGR of 14.18% over the forecast period 2024-2032.
The Digital Clinical Trials Market was valued at USD 8.70 Bn in 2023 and is expected to reach at $13.86 Bn in 2031 and grow at a CAGR of 6 % by 2024-2031.
The Dental Prosthetics Market size was valued at USD 10.5 Billion in 2023 & is estimated to reach USD 21.16 Billion by 2032 and increase at a compound annual growth rate of 8.1% between 2024 and 2032.
Hi! Click one of our member below to chat on Phone