Get More Information on Next Generation Non-Volatile Memory Market - Request Sample Report
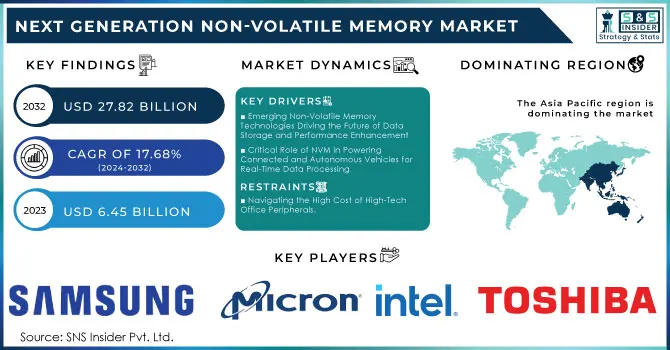
The Next Generation Non-Volatile Memory Market Size was valued at USD 6.45 Billion in 2023 and is expected to reach USD 27.82 Billion by 2032 and grow at a CAGR of 17.68% over the forecast period 2024-2032.
The Next Generation Non-Volatile Memory market helps significantly upscale concerning growth due to advancements in memory technology that shape the digital landscape. Memory technology remains the primary influencer in shaping the digital landscape with continued and rapid development, thus the Next Generation Non-Volatile Memory market is bound to boom further. Innovative memory solutions that make data retention possible even in the absence of a power supply are better alternatives than other traditional non-volatile memories like Flash. One of the largest Samsung rivals, SK Hynix, said the company had taken all of its ordered stacked high-bandwidth memory DRAM for 2024 production. The company produces the components used in AI processors deployed at the data center. Samsung Electronics has acquired parts of building and equipment in the Samsung Display (Samsung Display) Cheonan plant for HBM production as preparation for increasing the production capacity. The new line of packaging to be constructed at Cheonan will prepare large-scale HBM, worth an estimated 700 billion to 1 trillion won.
Among the newer memory technologies, some of which are being developed by key industry players include Phase Change Memory, Spin-Transfer Torque Magnetic RAM, and ReRAM among others. Their improvements are seen to start appearing in terms of speeds, endurance, and energy efficiency compared to their traditional counterparts. The upsurge is seen to meet the growing demands for high-performance memory in varying applications. One of the drivers of adoption for Phase Change Memory (PCM) will be through enterprise storage solutions applications.
KEY DRIVERS:
Emerging Non-Volatile Memory Technologies Driving the Future of Data Storage and Performance Enhancement
The main drivers for this market are increasing demand for data storage, recent semiconductor technologies, and the rising adoption of emerging products such as autonomous vehicles and AI. This market involves various modern memory technologies like phase-change memory, resistive random-access memory, and magnetic random-access memory. All these options have a significant advantage over non-volatile memory, such as Flash, in terms of higher access speed, larger capacities, and better reliability.
The need for large-capacity high-speed memory technologies arises from the increasing demand for big data and dependency on cloud storage. The larger the demand for performance enhancement is, the greater the need for memory devices with high speed and low power consumption. Emerging non-volatile memory technologies try to fill out market requirements and provide a competitive advantage over existing alternatives.
SAN JOSE, Calif.--BUSINESS WIRE--NetApp® (NASDAQ: NTAP), the intelligent data infrastructure company, today announced the new line of all-flash NetApp ASA A-Series storage systems, particularly designed for block storage, aimed to promote the modernization of storage in every organization. By offering customers these new systems and further development in NetApp's intelligent data infrastructure, customers no longer have to choose between ease of operation, high-end features, and value for their storage.
Critical Role of NVM in Powering Connected and Autonomous Vehicles for Real-Time Data Processing
Connected cars with their integration with technologies like infotainment systems, telematics, navigation systems, and advanced driver assistance systems (ADAS) tend to demand the robust memory solutions required for data storage and processing effectively. NVM is therefore a critical element in the preservation of data types that include maps, multimedia content, software updates, and sensor data for these applications. Hence, NVM would be highly critical in the storage and processing of data from a multitude of complex sensor arrays, cameras, radar, LiDAR, and other devices; its integration will facilitate autonomous vehicles to make rational choices by processing real-time data for safe navigation across different driving conditions.
RESTRAIN:
Navigating the High Cost of High-Tech Office Peripherals.
The largest barrier is that it is much more expensive to produce than traditional memory technologies such as Flash and DRAM. Novel NVM alternatives like phase-change memory (PCM), resistive random-access memory (ReRAM), and magnetic random-access memory (MRAM) often have complex manufacturing processes and expensive materials, costing much more than other memory technologies. Moreover, the scalability of some of the varieties of next-gen NVMs is also limited and might further limit their use in applications that demand a higher storage capacity. Besides, faster and more reliable as compared to conventional DRAMs, endurance and longevity issues, in particular when exposed to a continuous data write operation, could restrain lifetime in such specific use cases.
BY TYPE
In 2023, high-bandwidth memory (HBM) share dominated with 58.85% revenue because of the surge in the demand for high bandwidth and low power consumption and emerging technologies such as AI and big data analytics. The increased trend of consumers towards various electronic devices and automotive developments also increases the count of HBM, which provides more performance and faster transfer rates.
The hybrid memory cube market is expected to grow at a CAGR of 18.9% from 2024 to 2032, driven by its unique design, advanced technologies, and superior performance as compared to traditional memory. Its compact structure and other advanced features allow HMC to penetrate the adoption in various industries and applications that demand energy efficiency, such as AI, IoT, machine learning, and data centers.
BY WAFER SIZE
The 300mm wafer segment led the market in 2023, with a market share of 60.25%. The 300mm wafers have more than two-fold surface area compared to that of 200mm wafers, meaning this offers more production and saves cost. Therefore, growth in AI, 5G, and high-performance computing will fuel 300mm wafer growth in the future.
200mm wafers, to witness an expected CAGR of 18.32%, 200mm is a well-established mature technology for microprocessors, RF, and power chips through applying power and compound semiconductors necessary to consumer, automotive, and industrial sectors.
BY APPLICATION
The BFSI sector had the largest revenue share at 22.15% in the market, becoming significantly well-positioned by relying heavily on IoT and AI technologies. Big data in BFSI improves investor decision-making and ensures consistent returns. A rapid increase in the number of connected devices is generating large amounts of data, often stored on cloud servers. With growing financial data volumes, BFSI requires more security. Advanced memory technologies in the industry help enhance operational efficiency and ensure data security.
Telecommunication is a growing sector in the forecast period and is expected to grow at 19.04%. This boom has been due to emerging technologies like AI and IoT. Soon enough, growth prospects for this industry can be expected through an uptake in 5G technology, which increases bandwidth and allows for up to 10GB download speeds per second.
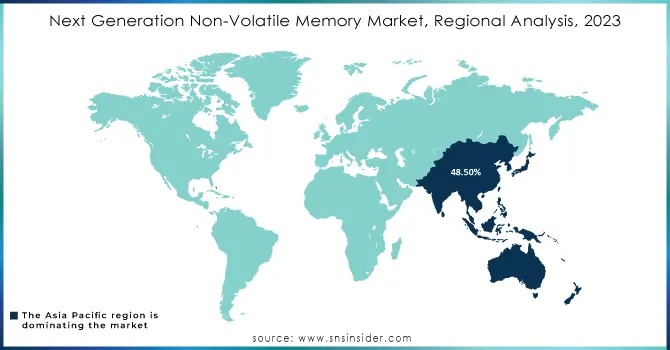
Asia Pacific led the market in 2023 and emerged as the market leader, capturing a high revenue share of 48.50%, primarily due to factors inherent in its dynamic business environment. The need for memory solutions that support energy efficiency and data retention has been fueled by the increasing use of mobile technologies and the Internet of Things (IoT), These countries are leading the list of nations for production and innovation in semiconductors - China, Japan, and South Korea, among others.
The North American next-generation non-volatile memory market will grow with a tremendous CAGR of 18.51% in the forecast period due to the construction of new infrastructures, such as data centers, and the rapid growth of the digital economy in countries like the U.S. and Canada. For instance, according to the reports in March 2024, there were 5,381 in the U.S., the highest of any country worldwide.
Need Any Customization Research On Next Generation Non-Volatile Memory Market - Inquiry Now
Some of the major players in the Next Generation Non-Volatile Memory Market are:
Samsung Electronics (Z-NAND, MRAM)
Intel Corporation (3D XPoint, Optane)
Micron Technology (3D XPoint, NAND)
Toshiba Corporation (ReRAM, BiCS Flash)
SK Hynix (PCM, NAND Flash)
Western Digital Corporation (ReRAM, 3D NAND)
IBM Corporation (Racetrack Memory, PCM)
Cypress Semiconductor (FRAM, SONOS)
NXP Semiconductors (MRAM, PCM)
Everspin Technologies (STT-MRAM, Toggle MRAM)
Avalanche Technology (STT-MRAM, Spin-transfer Torque MRAM)
Adesto Technologies (CBRAM, ReRAM)
Fujitsu Limited (FeRAM, MRAM)
Crossbar Inc. (ReRAM, 3D RRAM)
Rambus Inc. (ReRAM, Resistive RAM)
Qualcomm Incorporated (ReRAM, MRAM)
HGST (a Western Digital brand) (ReRAM, 3D NAND)
Sony Corporation (ReRAM, MRAM)
Seagate Technology (Heat-Assisted Magnetic Recording, MRAM)
GlobalFoundries (STT-MRAM, ReRAM)
BOISE, Idaho, July 30, 2024, Micron Technology, Inc. announced that it is shipping ninth-generation (G9) TLC NAND in SSDs, making it the first in the industry to achieve this milestone.
In June 2024, Samsung Electronics seems almost ready with its 8nm embedded MRAM (eMRAM), which it's pushing forward on the planned process upgrades, according to the WeChat account DRAMeXchange. It's new memory technology based on magnetic principles, non-volatile and faster than traditional DRAM for access speeds and endurability, refresh-free, and with a write rate 1,000 times that of NAND.
In January 2024, TSMC's next-generation MRAM memory-related technology broke through, the company co-worked with the Industrial Technology Research Institute in developing a spin-orbit-torque magnetic random-access memory (SOT-MRAM) array chip.
| Report Attributes | Details |
|---|---|
| Market Size in 2023 | USD 6.45 Billion |
| Market Size by 2032 | USD 27.82 Billion |
| CAGR | CAGR of 17.68% From 2024 to 2032 |
| Base Year | 2023 |
| Forecast Period | 2024-2032 |
| Historical Data | 2020-2022 |
| Report Scope & Coverage | Market Size, Segments Analysis, Competitive Landscape, Regional Analysis, DROC & SWOT Analysis, Forecast Outlook |
| Key Segments | • By Type (Hybrid Memory Cube (HMC), High-bandwidth Memory (HBM)), • By Wafer Size (200 mm, 300 mm) • By Application (BFSI, Consumer Electronics, Government, Telecommunications, Information Technology, Others.) |
| Regional Analysis/Coverage | North America (US, Canada, Mexico), Europe (Eastern Europe [Poland, Romania, Hungary, Turkey, Rest of Eastern Europe] Western Europe [Germany, France, UK, Italy, Spain, Netherlands, Switzerland, Austria, Rest of Western Europe]), Asia Pacific (China, India, Japan, South Korea, Vietnam, Singapore, Australia, Rest of Asia Pacific), Middle East & Africa (Middle East [UAE, Egypt, Saudi Arabia, Qatar, Rest of Middle East], Africa [Nigeria, South Africa, Rest of Africa], Latin America (Brazil, Argentina, Colombia, Rest of Latin America) |
| Company Profiles | Samsung Electronics, Intel Corporation, Micron Technology, Toshiba Corporation, SK Hynix, Western Digital Corporation, IBM Corporation, Cypress Semiconductor, NXP Semiconductors, Everspin Technologies, Avalanche Technology, Adesto Technologies, Fujitsu Limited, Crossbar Inc., Rambus Inc., Qualcomm Incorporated, HGST, Sony Corporation, Seagate Technology, GlobalFoundries. |
| Key Drivers | • Emerging Non-Volatile Memory Technologies Driving the Future of Data Storage and Performance Enhancement • Critical Role of NVM in Powering Connected and Autonomous Vehicles for Real-Time Data Processing |
| RESTRAINTS | • Navigating the High Cost of High-Tech Office Peripherals |
Ans: The Next Generation Non-Volatile Memory Market is expected to grow at a CAGR of 17.68% during 2024-2032.
Ans: Next Generation Non-Volatile Memory Market size was USD 6.45 billion in 2023 and is expected to Reach USD 27.82 billion by 2032.
Ans: The major growth factor for the Next Generation Non-Volatile Memory Market is the increasing demand for faster, more efficient storage solutions in consumer electronics, data centers, and automotive applications.
Ans: ASIA PACIFIC dominated the Next Generation Non-Volatile Memory Market in 2023.
Ans: The High-bandwidth Memory (HBM) segment dominated the Next Generation Non-Volatile Memory Market in 2023.
Table of Content
1. Introduction
1.1 Market Definition
1.2 Scope (Inclusion and Exclusions)
1.3 Research Assumptions
2. Executive Summary
2.1 Market Overview
2.2 Regional Synopsis
2.3 Competitive Summary
3. Research Methodology
3.1 Top-Down Approach
3.2 Bottom-up Approach
3.3. Data Validation
3.4 Primary Interviews
4. Market Dynamics Impact Analysis
4.1 Market Driving Factors Analysis
4.1.1 Drivers
4.1.2 Restraints
4.1.3 Opportunities
4.1.4 Challenges
4.2 PESTLE Analysis
4.3 Porter’s Five Forces Model
5. Statistical Insights and Trends Reporting
5.1 Next Generation Non-Volatile Memory Wafer Production Volumes, by Region (2023)
5.2 Next Generation Non-Volatile Memory Chip Design Trends (Historic and Future)
5.3 Next Generation Non-Volatile Memory Fab Capacity Utilization (2023)
5.4 Supply Chain Metrics
6. Competitive Landscape
6.1 List of Major Companies, By Region
6.2 Market Share Analysis, By Region
6.3 Product Benchmarking
6.3.1 Product specifications and features
6.3.2 Pricing
6.4 Strategic Initiatives
6.4.1 Marketing and promotional activities
6.4.2 Distribution and Supply Chain Strategies
6.4.3 Expansion plans and new product launches
6.4.4 Strategic partnerships and collaborations
6.5 Technological Advancements
6.6 Market Positioning and Branding
7. Next Generation Non-Volatile Memory Market Segmentation, by Product
7.1 Chapter Overview
7.2 Hybrid Memory Cube (HMC)
7.2.1 Hybrid Memory Cube (HMC) Market Trends Analysis (2020-2032)
7.2.2 Hybrid Memory Cube (HMC) Market Size Estimates and Forecasts to 2032 (USD Million)
7.3 High-bandwidth Memory (HBM)
7.3.1 High-bandwidth Memory (HBM) Market Trends Analysis (2020-2032)
7.3.2 High-bandwidth Memory (HBM) Market Size Estimates and Forecasts to 2032 (USD Million)
8. Next Generation Non-Volatile Memory Market Segmentation, by Wafer Size
8.1 Chapter Overview
8.2 200 mm
8.2.1 200 mm Market Trends Analysis (2020-2032)
8.2.2 200 mm Market Size Estimates and Forecasts to 2032 (USD Billion)
8.3 300 mm
8.3.1 300 mm Market Trends Analysis (2020-2032)
8.3.2 300 mm Market Size Estimates and Forecasts to 2032 (USD Billion)
9. Next Generation Non-Volatile Memory Market Segmentation, by Application
9.1 Chapter Overview
9.2 BFSI
9.2.1 BFSI Market Trends Analysis (2020-2032)
9.2.2 BFSI Market Size Estimates and Forecasts to 2032 (USD Billion)
9.3 Consumer Electronics
9.3.1 Consumer Electronics Market Trends Analysis (2020-2032)
9.3.2 Consumer Electronics Market Size Estimates and Forecasts to 2032 (USD Billion)
9.4 Government
9.4.1 Government Market Trends Analysis (2020-2032)
9.4.2 Government Market Size Estimates and Forecasts to 2032 (USD Billion)
9.5 Telecommunications
9.5.1 Telecommunications Market Trends Analysis (2020-2032)
9.5.2 Telecommunications Market Size Estimates and Forecasts to 2032 (USD Billion)
9.6 Information Technology
9.6.1 Information Technology Market Trends Analysis (2020-2032)
9.6.2 Information Technology Market Size Estimates and Forecasts to 2032 (USD Billion)
9.7 Others
9.7.1 Others Market Trends Analysis (2020-2032)
9.7.2 Others Market Size Estimates and Forecasts to 2032 (USD Billion)
9. Regional Analysis
9.1 Chapter Overview
9.2 North America
9.2.1 Trends Analysis
9.2.2 North America Next Generation Non-Volatile Memory Market Estimates and Forecasts, by Country (2020-2032) (USD Billion)
9.2.3 North America Next Generation Non-Volatile Memory Market Estimates and Forecasts, by Application (2020-2032) (USD Billion)
9.2.4 North America Next Generation Non-Volatile Memory Market Estimates and Forecasts, by End User (2020-2032) (USD Billion)
9.2.5 USA
9.2.5.1 USA Next Generation Non-Volatile Memory Market Estimates and Forecasts, by Application (2020-2032) (USD Billion)
9.2.5.2 USA Next Generation Non-Volatile Memory Market Estimates and Forecasts, by End User (2020-2032) (USD Billion)
9.2.6 Canada
9.2.6.1 Canada Next Generation Non-Volatile Memory Market Estimates and Forecasts, by Application (2020-2032) (USD Billion)
9.2.6.2 Canada Next Generation Non-Volatile Memory Market Estimates and Forecasts, by End User (2020-2032) (USD Billion)
9.2.7 Mexico
9.2.7.1 Mexico Next Generation Non-Volatile Memory Market Estimates and Forecasts, by Application (2020-2032) (USD Billion)
9.2.7.2 Mexico Next Generation Non-Volatile Memory Market Estimates and Forecasts, by End User (2020-2032) (USD Billion)
9.3 Europe
9.3.1 Eastern Europe
9.3.1.1 Trends Analysis
9.3.1.2 Eastern Europe Next Generation Non-Volatile Memory Market Estimates and Forecasts, by Country (2020-2032) (USD Billion)
9.3.1.3 Eastern Europe Next Generation Non-Volatile Memory Market Estimates and Forecasts, by Application (2020-2032) (USD Billion)
9.3.1.4 Eastern Europe Next Generation Non-Volatile Memory Market Estimates and Forecasts, by End User (2020-2032) (USD Billion)
9.3.1.5 Poland
9.3.1.5.1 Poland Next Generation Non-Volatile Memory Market Estimates and Forecasts, by Application (2020-2032) (USD Billion)
9.3.1.5.2 Poland Next Generation Non-Volatile Memory Market Estimates and Forecasts, by End User (2020-2032) (USD Billion)
9.3.1.6 Romania
9.3.1.6.1 Romania Next Generation Non-Volatile Memory Market Estimates and Forecasts, by Application (2020-2032) (USD Billion)
9.3.1.6.2 Romania Next Generation Non-Volatile Memory Market Estimates and Forecasts, by End User (2020-2032) (USD Billion)
9.3.1.7 Hungary
9.3.1.7.1 Hungary Next Generation Non-Volatile Memory Market Estimates and Forecasts, by Application (2020-2032) (USD Billion)
9.3.1.7.2 Hungary Next Generation Non-Volatile Memory Market Estimates and Forecasts, by End User (2020-2032) (USD Billion)
9.3.1.8 Turkey
9.3.1.8.1 Turkey Next Generation Non-Volatile Memory Market Estimates and Forecasts, by Application (2020-2032) (USD Billion)
9.3.1.8.2 Turkey Next Generation Non-Volatile Memory Market Estimates and Forecasts, by End User (2020-2032) (USD Billion)
9.3.1.9 Rest of Eastern Europe
9.3.1.9.1 Rest of Eastern Europe Next Generation Non-Volatile Memory Market Estimates and Forecasts, by Application (2020-2032) (USD Billion)
9.3.1.9.2 Rest of Eastern Europe Next Generation Non-Volatile Memory Market Estimates and Forecasts, by End User (2020-2032) (USD Billion)
9.3.2 Western Europe
9.3.2.1 Trends Analysis
9.3.2.2 Western Europe Next Generation Non-Volatile Memory Market Estimates and Forecasts, by Country (2020-2032) (USD Billion)
9.3.2.3 Western Europe Next Generation Non-Volatile Memory Market Estimates and Forecasts, by Application (2020-2032) (USD Billion)
9.3.2.4 Western Europe Next Generation Non-Volatile Memory Market Estimates and Forecasts, by End User (2020-2032) (USD Billion)
9.3.2.5 Germany
9.3.2.5.1 Germany Next Generation Non-Volatile Memory Market Estimates and Forecasts, by Application (2020-2032) (USD Billion)
9.3.2.5.2 Germany Next Generation Non-Volatile Memory Market Estimates and Forecasts, by End User (2020-2032) (USD Billion)
9.3.2.6 France
9.3.2.6.1 France Next Generation Non-Volatile Memory Market Estimates and Forecasts, by Application (2020-2032) (USD Billion)
9.3.2.6.2 France Next Generation Non-Volatile Memory Market Estimates and Forecasts, by End User (2020-2032) (USD Billion)
9.3.2.7 UK
9.3.2.7.1 UK Next Generation Non-Volatile Memory Market Estimates and Forecasts, by Application (2020-2032) (USD Billion)
9.3.2.7.2 UK Next Generation Non-Volatile Memory Market Estimates and Forecasts, by End User (2020-2032) (USD Billion)
9.3.2.8 Italy
9.3.2.8.1 Italy Next Generation Non-Volatile Memory Market Estimates and Forecasts, by Application (2020-2032) (USD Billion)
9.3.2.8.2 Italy Next Generation Non-Volatile Memory Market Estimates and Forecasts, by End User (2020-2032) (USD Billion)
9.3.2.9 Spain
9.3.2.9.1 Spain Next Generation Non-Volatile Memory Market Estimates and Forecasts, by Application (2020-2032) (USD Billion)
9.3.2.9.2 Spain Next Generation Non-Volatile Memory Market Estimates and Forecasts, by End User (2020-2032) (USD Billion)
9.3.2.10 Netherlands
9.3.2.10.1 Netherlands Next Generation Non-Volatile Memory Market Estimates and Forecasts, by Application (2020-2032) (USD Billion)
9.3.2.10.2 Netherlands Next Generation Non-Volatile Memory Market Estimates and Forecasts, by End User (2020-2032) (USD Billion)
9.3.2.11 Switzerland
9.3.2.11.1 Switzerland Next Generation Non-Volatile Memory Market Estimates and Forecasts, by Application (2020-2032) (USD Billion)
9.3.2.11.2 Switzerland Next Generation Non-Volatile Memory Market Estimates and Forecasts, by End User (2020-2032) (USD Billion)
9.3.2.12 Austria
9.3.2.12.1 Austria Next Generation Non-Volatile Memory Market Estimates and Forecasts, by Application (2020-2032) (USD Billion)
9.3.2.12.2 Austria Next Generation Non-Volatile Memory Market Estimates and Forecasts, by End User (2020-2032) (USD Billion)
9.3.2.13 Rest of Western Europe
9.3.2.13.1 Rest of Western Europe Next Generation Non-Volatile Memory Market Estimates and Forecasts, by Application (2020-2032) (USD Billion)
9.3.2.13.2 Rest of Western Europe Next Generation Non-Volatile Memory Market Estimates and Forecasts, by End User (2020-2032) (USD Billion)
9.4 Asia Pacific
9.4.1 Trends Analysis
9.4.2 Asia Pacific Next Generation Non-Volatile Memory Market Estimates and Forecasts, by Country (2020-2032) (USD Billion)
9.4.3 Asia Pacific Next Generation Non-Volatile Memory Market Estimates and Forecasts, by Application (2020-2032) (USD Billion)
9.4.4 Asia Pacific Next Generation Non-Volatile Memory Market Estimates and Forecasts, by End User (2020-2032) (USD Billion)
9.4.5 China
9.4.5.1 China Next Generation Non-Volatile Memory Market Estimates and Forecasts, by Application (2020-2032) (USD Billion)
9.4.5.2 China Next Generation Non-Volatile Memory Market Estimates and Forecasts, by End User (2020-2032) (USD Billion)
9.4.6 India
9.4.5.1 India Next Generation Non-Volatile Memory Market Estimates and Forecasts, by Application (2020-2032) (USD Billion)
9.4.5.2 India Next Generation Non-Volatile Memory Market Estimates and Forecasts, by End User (2020-2032) (USD Billion)
9.4.5 Japan
9.4.5.1 Japan Next Generation Non-Volatile Memory Market Estimates and Forecasts, by Application (2020-2032) (USD Billion)
9.4.5.2 Japan Next Generation Non-Volatile Memory Market Estimates and Forecasts, by End User (2020-2032) (USD Billion)
9.4.6 South Korea
9.4.6.1 South Korea Next Generation Non-Volatile Memory Market Estimates and Forecasts, by Application (2020-2032) (USD Billion)
9.4.6.2 South Korea Next Generation Non-Volatile Memory Market Estimates and Forecasts, by End User (2020-2032) (USD Billion)
9.4.7 Vietnam
9.4.7.1 Vietnam Next Generation Non-Volatile Memory Market Estimates and Forecasts, by Application (2020-2032) (USD Billion)
9.2.7.2 Vietnam Next Generation Non-Volatile Memory Market Estimates and Forecasts, by End User (2020-2032) (USD Billion)
9.4.8 Singapore
9.4.8.1 Singapore Next Generation Non-Volatile Memory Market Estimates and Forecasts, by Application (2020-2032) (USD Billion)
9.4.8.2 Singapore Next Generation Non-Volatile Memory Market Estimates and Forecasts, by End User (2020-2032) (USD Billion)
9.4.9 Australia
9.4.9.1 Australia Next Generation Non-Volatile Memory Market Estimates and Forecasts, by Application (2020-2032) (USD Billion)
9.4.9.2 Australia Next Generation Non-Volatile Memory Market Estimates and Forecasts, by End User (2020-2032) (USD Billion)
9.4.10 Rest of Asia Pacific
9.4.10.1 Rest of Asia Pacific Next Generation Non-Volatile Memory Market Estimates and Forecasts, by Application (2020-2032) (USD Billion)
9.4.10.2 Rest of Asia Pacific Next Generation Non-Volatile Memory Market Estimates and Forecasts, by End User (2020-2032) (USD Billion)
9.5 Middle East and Africa
9.5.1 Middle East
9.5.1.1 Trends Analysis
9.5.1.2 Middle East Next Generation Non-Volatile Memory Market Estimates and Forecasts, by Country (2020-2032) (USD Billion)
9.5.1.3 Middle East Next Generation Non-Volatile Memory Market Estimates and Forecasts, by Application (2020-2032) (USD Billion)
9.5.1.4 Middle East Next Generation Non-Volatile Memory Market Estimates and Forecasts, by End User (2020-2032) (USD Billion)
9.5.1.5 UAE
9.5.1.5.1 UAE Next Generation Non-Volatile Memory Market Estimates and Forecasts, by Application (2020-2032) (USD Billion)
9.5.1.5.2 UAE Next Generation Non-Volatile Memory Market Estimates and Forecasts, by End User (2020-2032) (USD Billion)
9.5.1.6 Egypt
9.5.1.6.1 Egypt Next Generation Non-Volatile Memory Market Estimates and Forecasts, by Application (2020-2032) (USD Billion)
9.5.1.6.2 Egypt Next Generation Non-Volatile Memory Market Estimates and Forecasts, by End User (2020-2032) (USD Billion)
9.5.1.7 Saudi Arabia
9.5.1.7.1 Saudi Arabia Next Generation Non-Volatile Memory Market Estimates and Forecasts, by Application (2020-2032) (USD Billion)
9.5.1.7.2 Saudi Arabia Next Generation Non-Volatile Memory Market Estimates and Forecasts, by End User (2020-2032) (USD Billion)
9.5.1.8 Qatar
9.5.1.8.1 Qatar Next Generation Non-Volatile Memory Market Estimates and Forecasts, by Application (2020-2032) (USD Billion)
9.5.1.8.2 Qatar Next Generation Non-Volatile Memory Market Estimates and Forecasts, by End User (2020-2032) (USD Billion)
9.5.1.9 Rest of Middle East
9.5.1.9.1 Rest of Middle East Next Generation Non-Volatile Memory Market Estimates and Forecasts, by Application (2020-2032) (USD Billion)
9.5.1.9.2 Rest of Middle East Next Generation Non-Volatile Memory Market Estimates and Forecasts, by End User (2020-2032) (USD Billion)
9.5.2 Africa
9.5.2.1 Trends Analysis
9.5.2.2 Africa Next Generation Non-Volatile Memory Market Estimates and Forecasts, by Country (2020-2032) (USD Billion)
9.5.2.3 Africa Next Generation Non-Volatile Memory Market Estimates and Forecasts, by Application (2020-2032) (USD Billion)
9.5.2.4 Africa Next Generation Non-Volatile Memory Market Estimates and Forecasts, by End User (2020-2032) (USD Billion)
9.5.2.5 South Africa
9.5.2.5.1 South Africa Next Generation Non-Volatile Memory Market Estimates and Forecasts, by Application (2020-2032) (USD Billion)
9.5.2.5.2 South Africa Next Generation Non-Volatile Memory Market Estimates and Forecasts, by End User (2020-2032) (USD Billion)
9.5.2.6 Nigeria
9.5.2.6.1 Nigeria Next Generation Non-Volatile Memory Market Estimates and Forecasts, by Application (2020-2032) (USD Billion)
9.5.2.6.2 Nigeria Next Generation Non-Volatile Memory Market Estimates and Forecasts, by End User (2020-2032) (USD Billion)
9.5.2.7 Rest of Africa
9.5.2.7.1 Rest of Africa Next Generation Non-Volatile Memory Market Estimates and Forecasts, by Application (2020-2032) (USD Billion)
9.5.2.7.2 Rest of Africa Next Generation Non-Volatile Memory Market Estimates and Forecasts, by End User (2020-2032) (USD Billion)
9.6 Latin America
9.6.1 Trends Analysis
9.6.2 Latin America Next Generation Non-Volatile Memory Market Estimates and Forecasts, by Country (2020-2032) (USD Billion)
9.6.3 Latin America Next Generation Non-Volatile Memory Market Estimates and Forecasts, by Application (2020-2032) (USD Billion)
9.6.4 Latin America Next Generation Non-Volatile Memory Market Estimates and Forecasts, by End User (2020-2032) (USD Billion)
9.6.5 Brazil
9.6.5.1 Brazil Next Generation Non-Volatile Memory Market Estimates and Forecasts, by Application (2020-2032) (USD Billion)
9.6.5.2 Brazil Next Generation Non-Volatile Memory Market Estimates and Forecasts, by End User (2020-2032) (USD Billion)
9.6.6 Argentina
9.6.6.1 Argentina Next Generation Non-Volatile Memory Market Estimates and Forecasts, by Application (2020-2032) (USD Billion)
9.6.6.2 Argentina Next Generation Non-Volatile Memory Market Estimates and Forecasts, by End User (2020-2032) (USD Billion)
9.6.7 Colombia
9.6.7.1 Colombia Next Generation Non-Volatile Memory Market Estimates and Forecasts, by Application (2020-2032) (USD Billion)
9.6.7.2 Colombia Next Generation Non-Volatile Memory Market Estimates and Forecasts, by End User (2020-2032) (USD Billion)
9.6.8 Rest of Latin America
9.6.8.1 Rest of Latin America Next Generation Non-Volatile Memory Market Estimates and Forecasts, by Application (2020-2032) (USD Billion)
9.6.8.2 Rest of Latin America Next Generation Non-Volatile Memory Market Estimates and Forecasts, by End User (2020-2032) (USD Billion)
10. Company Profiles
10.1 Samsung Electronics
10.1.1 Company Overview
10.1.2 Financial
10.1.3 Products/ Services Offered
110.1.4 SWOT Analysis
10.2 Intel Corporation
10.2.1 Company Overview
10.2.2 Financial
10.2.3 Products/ Services Offered
10.2.4 SWOT Analysis
10.3 Micron Technology
10.3.1 Company Overview
10.3.2 Financial
10.3.3 Products/ Services Offered
10.3.4 SWOT Analysis
10.4 Toshiba Corporation
10.4.1 Company Overview
10.4.2 Financial
10.4.3 Products/ Services Offered
10.4.4 SWOT Analysis
10.5 SK Hynix
10.5.1 Company Overview
10.5.2 Financial
10.5.3 Products/ Services Offered
10.5.4 SWOT Analysis
10.6 Western Digital Corporation
10.6.1 Company Overview
10.6.2 Financial
10.6.3 Products/ Services Offered
10.6.4 SWOT Analysis
10.7 IBM Corporation
10.7.1 Company Overview
10.7.2 Financial
10.7.3 Products/ Services Offered
10.7.4 SWOT Analysis
10.8 Cypress Semiconductor
10.8.1 Company Overview
10.8.2 Financial
10.8.3 Products/ Services Offered
10.8.4 SWOT Analysis
10.9 NXP Semiconductors
10.9.1 Company Overview
10.9.2 Financial
10.9.3 Products/ Services Offered
10.9.4 SWOT Analysis
10.10 Everspin Technologies
10.9.1 Company Overview
10.9.2 Financial
10.9.3 Products/ Services Offered
10.9.4 SWOT Analysis
11. Use Cases and Best Practices
12. Conclusion
An accurate research report requires proper strategizing as well as implementation. There are multiple factors involved in the completion of good and accurate research report and selecting the best methodology to compete the research is the toughest part. Since the research reports we provide play a crucial role in any company’s decision-making process, therefore we at SNS Insider always believe that we should choose the best method which gives us results closer to reality. This allows us to reach at a stage wherein we can provide our clients best and accurate investment to output ratio.
Each report that we prepare takes a timeframe of 350-400 business hours for production. Starting from the selection of titles through a couple of in-depth brain storming session to the final QC process before uploading our titles on our website we dedicate around 350 working hours. The titles are selected based on their current market cap and the foreseen CAGR and growth.
The 5 steps process:
Step 1: Secondary Research:
Secondary Research or Desk Research is as the name suggests is a research process wherein, we collect data through the readily available information. In this process we use various paid and unpaid databases which our team has access to and gather data through the same. This includes examining of listed companies’ annual reports, Journals, SEC filling etc. Apart from this our team has access to various associations across the globe across different industries. Lastly, we have exchange relationships with various university as well as individual libraries.

Step 2: Primary Research
When we talk about primary research, it is a type of study in which the researchers collect relevant data samples directly, rather than relying on previously collected data. This type of research is focused on gaining content specific facts that can be sued to solve specific problems. Since the collected data is fresh and first hand therefore it makes the study more accurate and genuine.
We at SNS Insider have divided Primary Research into 2 parts.
Part 1 wherein we interview the KOLs of major players as well as the upcoming ones across various geographic regions. This allows us to have their view over the market scenario and acts as an important tool to come closer to the accurate market numbers. As many as 45 paid and unpaid primary interviews are taken from both the demand and supply side of the industry to make sure we land at an accurate judgement and analysis of the market.
This step involves the triangulation of data wherein our team analyses the interview transcripts, online survey responses and observation of on filed participants. The below mentioned chart should give a better understanding of the part 1 of the primary interview.

Part 2: In this part of primary research the data collected via secondary research and the part 1 of the primary research is validated with the interviews from individual consultants and subject matter experts.
Consultants are those set of people who have at least 12 years of experience and expertise within the industry whereas Subject Matter Experts are those with at least 15 years of experience behind their back within the same space. The data with the help of two main processes i.e., FGDs (Focused Group Discussions) and IDs (Individual Discussions). This gives us a 3rd party nonbiased primary view of the market scenario making it a more dependable one while collation of the data pointers.
Step 3: Data Bank Validation
Once all the information is collected via primary and secondary sources, we run that information for data validation. At our intelligence centre our research heads track a lot of information related to the market which includes the quarterly reports, the daily stock prices, and other relevant information. Our data bank server gets updated every fortnight and that is how the information which we collected using our primary and secondary information is revalidated in real time.

Step 4: QA/QC Process
After all the data collection and validation our team does a final level of quality check and quality assurance to get rid of any unwanted or undesired mistakes. This might include but not limited to getting rid of the any typos, duplication of numbers or missing of any important information. The people involved in this process include technical content writers, research heads and graphics people. Once this process is completed the title gets uploader on our platform for our clients to read it.
Step 5: Final QC/QA Process:
This is the last process and comes when the client has ordered the study. In this process a final QA/QC is done before the study is emailed to the client. Since we believe in giving our clients a good experience of our research studies, therefore, to make sure that we do not lack at our end in any way humanly possible we do a final round of quality check and then dispatch the study to the client.
Key Segments:
By Type
Hybrid Memory Cube (HMC)
High-bandwidth Memory (HBM)
By Wafer size
200 mm
300 mm
By Application
BFSI
Consumer Electronics
Government
Telecommunications
Information Technology
Others
Request for Segment Customization as per your Business Requirement: Segment Customization Request
REGIONAL COVERAGE:
North America
US
Canada
Mexico
Europe
Eastern Europe
Poland
Romania
Hungary
Turkey
Rest of Eastern Europe
Western Europe
Germany
France
UK
Italy
Spain
Netherlands
Switzerland
Austria
Rest of Western Europe
Asia Pacific
China
India
Japan
South Korea
Vietnam
Singapore
Australia
Rest of Asia Pacific
Middle East & Africa
Middle East
UAE
Egypt
Saudi Arabia
Qatar
Rest of the Middle East
Africa
Nigeria
South Africa
Rest of Africa
Latin America
Brazil
Argentina
Colombia
Request for Country Level Research Report: Country Level Customization Request
Available Customization
With the given market data, SNS Insider offers customization as per the company’s specific needs. The following customization options are available for the report:
Product Analysis
Criss-Cross segment analysis (e.g. Product X Application)
Product Matrix which gives a detailed comparison of the product portfolio of each company
Geographic Analysis
Additional countries in any of the regions
Company Information
Detailed analysis and profiling of additional market players (Up to five)
Building Information Modeling (BIM) Market was valued at USD 7.42 Billion in 2023. It is estimated to reach USD 20.91 Billion at 12.24% CAGR by 2024-2032
The Silicon Carbide Market Size was valued at USD 3.34 Billion in 2023 and is expected to reach USD 7.64 Billion by 2032 and grow at a CAGR of 9.68% over the forecast period 2024-2032.
The Industrial Thermopile Sensors Market was valued at USD 1.38 Billion in 2023 and is projected to reach USD 2.43 Billion by 2032, growing at a CAGR of 6.5% during 2024-2032.
The Servo Motors and Drives Market Size valued at USD 16.85 billion in 2023 and is expected to grow at a CAGR of 6.42% to reach USD 29.22 billion by 2032.
The Sensor Hub Market was valued at USD 29.17 billion in 2023 and is projected to reach USD 125.23 billion by 2032, growing at a CAGR of 17.58% from 2024 to 2032.
The Infrared Sensor Market Size was valued at USD 667.50 million in 2023 and is expected to grow at a CAGR of 9.26% to reach USD 1476.40 million by 2032.

Hi! Click one of our member below to chat on Phone
© 2025 All Rights Reserved by SNS Insider Pvt Ltd


