The Next Generation Display Market was valued at USD 208.08 billion in 2023 and is expected to reach USD 417.61 billion by 2032, growing at a CAGR of 8.09% over the forecast period 2024-2032.Next generation display market is achieving fast technology penetration as various advanced display technologies like OLED, QD, and flexible displays are increasingly being integrated into different devices. Application-wise market share analysis reveals notable adoption across consumer electronics, automotive, and advertising sectors as the demand for high-performance visuals propels innovation in this space. With the rising interest in immersive, high-definition experiences particularly with home entertainment and mobility, consumer sentiment is also aligned. By device type, there is a clear movement to include next-gen displays in smartphones, TVs, wearables, and automotive displays that utilize significantly improved color performance, more power-efficient displays, and improved flexibility and ruggedness
Get more information on Next Generation Display Market - Request Sample Report
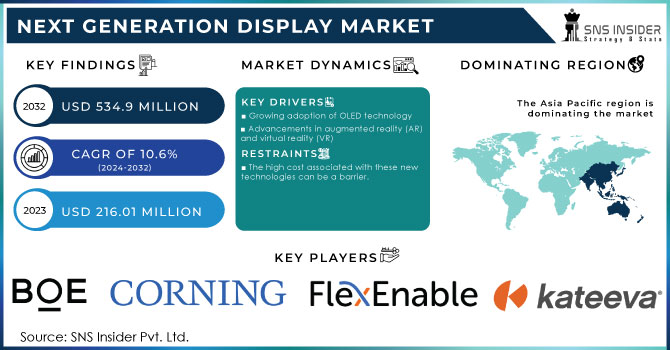
Key Drivers:
Rising Consumer Demand and Technological Advancements Fuel Growth in Next Generation Display Market
The demand for high-quality display experiences in televisions, smartphones, and gaming devices is increasing among consumers, demanding vibrant, high-definition displays. In addition, the presence of 4K and 8K displays in consumer electronics, as well as flexible and lightweight displays, which are becoming increasingly common in applications such as foldable displays, are driving the market. Technological advancements in display technology, particularly the increase in the utilization of Quantum Dots and Carbon Nanotubes are key influencing factors driving the Next Generation Display Market segment.
Restrain:
High Manufacturing Costs and Environmental Concerns Challenge Growth of Next Generation Display Market
One of the primary restraints is the high manufacturing cost of QDs, CNTs, OLED displays, etc. Such expenses can impose a severe burden on the overall cost of end-user commercial goods, which can act as a major barrier to the commercialization of such technologies, especially in low-cost markets. Also, it raises the cost of operation due to complicated production and integration processes, especially for new materials such as CNTs. This could present challenges for small and mid-sized firms trying to gain entry to the market and compete with incumbents. In addition to this, the production of display technologies could use hazardous materials and therefore the resulting E-waste may pose environmental dangers as such, the market will also be burdened by concerns about sustainability and environmental impacts.
Opportunity:
Significant Growth Opportunities in Automotive Industrial Applications and Advertising Drive Next Generation Display Market
The next decade presents significant opportunities for growth, especially with automotive, industrial applications, and advertising. The growing automotive focus on in-car displays, augmented reality dashboards, and smart rearview mirrors is another major area for new advanced displays. Better durability and flexibility are required for displays in industrial applications like wearable tech and smart factories. Consumer electronics has been driving up demand for digital billboards and interactive advertising displays, especially as technologies like OLED and microLED become less experimental.
Challenges:
Technology Limitations and Competition from Traditional Displays Hinder Growth of Next Generation Display Market
In the next-generation display market, challenges over technology limitations exist in various types of display technologies. For Quantum Dots, the image quality advantage is offset by potential screen burn-in and limited life for certain materials, well-known obstacles to ubiquitous adoption for OLED displays. More importantly, display technology has yet to come to a common ground for effective communication between devices. The competition from traditional (non-league) display technologies such as LCDs and OLEDs, providing more affordable alternatives, also slows down the transition to newer generation displays in certain regions.
By Ingredients
In 2023, Quantum Dots led the display market due to their excellent performance characteristics, having maintained a 46.7% share. Improved color performance, brightness, and energy efficiency are some features that have pushed them into consumer electronics for HD, 4K, and 8K displays easing into TVs, smartphones, and monitors. Quantum dots are another asset that is leading to higher market volumes within the OLED display manufacturing sector. With a surge in large display manufacturing owing to increased demand in the consumer world, the ability of QDs to emit bright, true-to-nature colors at relatively lower power levels suits individual consumer needs as well.
Carbon Nanotubes are expected to witness the fastest growth in the Next Generation Display Market from 2024 to 2032 because CNTs possess some unique properties like high electrical conductivity, mechanical strength, and flexibility as a result, they are rapidly being utilized for producing next generation flexible displays. These properties render CNTs exceptional candidates for flexible and foldable displays that are predicted to witness wide-scale adoption within the next few years. CNTs also harbors prospects for use in better touchscreens and transparent conductive films providing numerous opportunities in the consumer electronics, automotive, and advertising industries.
By Display Technology
In 2023, LCD (Liquid Crystal Display) dominate, capturing a considerable 56.8% share of the display market. LCD's widespread adoption owes to its low manufacturing cost, mature production technology, and broad applicability in consumer products, such as televisions and smartphones, as well as in industrial and automotive displays. More than the price when it comes to manufacturing, up until very recently, manufacturers have preferred the low production costs of LCD technology over newer and better technologies like OLED, thus reserving LCD for the budget-conscious consumer and consumer business.
OLED (Organic Light Emitting Diode) displays are forecast to grow with the highest CAGR from 2024 to 2032. OLED gives you a better image, with a higher contrast ratio, richer colors, and better refresh rates than LCD. In addition, OLED is thinner and more flexible than its LCD counterpart, paving the way for future opportunities in new markets such as foldable smartphones, wearables, and automotive displays. OLED has always shone in the high-end television category, and as the consumer demand moves toward increased quality of life, more premium products with better viewing experience will be in demand, paving the way for OLED for quick acceptance on larger scales high-end TVs, gaming monitors, and most mobile devices
By Application
The Consumer Electronics segment accounted for 34.3% in 2023, owing to the continued demand for high-definition televisions along with smartphones, tablets, and gaming devices. The latest advancements in display technologies such as Quantum Dots, OLED, and LCD technologies have improved the consumer viewing experience thereby aiding the wider proliferation of premium devices. Rising demand for 4K & 8K displays and other flexible & foldable displays also compromised a greater share of the market. Furthermore, this segment continues to be driven by the ubiquitous nature of consumer electronics with a large consumer base.
The Industrial Applications segment is expected to witness the fastest CAGR growth from 2024 to 2032. The increase is mainly driven by a greater use of cutting-edge displays in industries such as manufacturing, healthcare, logistics, and wearables. The requirement for displays in industrial settings that are robust, flexible, and energy efficient is increasing in smart factories, wearable devices, and automation systems. Moreover, the demand for augmented reality (AR) and virtual reality (VR) displays for industrial training and operations is also adding to the rapid growth of this segment.
By End Use
The Personal Use segment accounted for 45.8% of the market in 2023. This is mainly fueled by the increased deployment of the latest display devices in consumer electronics such as smartphones, TVs, laptops, and wearables. However, with consumers thirsty for high-quality visual experiences, the need for better color accuracy, higher resolutions (4K, 8K), and energy efficiency in displays has spilled into the latter realm. In addition, the expansion of smart devices and home entertainment systems has also strengthened the said segment as the leader of the paper since they are intended for use above the individual level on every continent.
The Commercial Use segment is forecast to see the highest CAGR between 2024 and 2032. The use of advanced display technologies in sectors like retail, advertisement, corporate and public information systems have become more advanced over the years and this explains the growth as well. So, interactive digital signage, large-scale video walls, and Augmented Reality (AR) apps are becoming popular for use in commercial ones to offer new ways for customers to be engaged and enjoyed message communication.
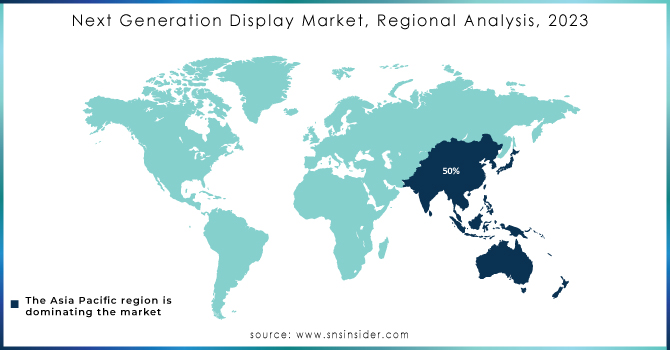
In 2023, the Asia Pacific led the market and accounted for a 34.3% share of the production. This market growth can be attributed to the presence of major manufacturing hubs and strong consumer demand. Next-gen display nations China, Japan, So. Korea, India China are specifically a frontrunner in display panel manufacturing, leading to numerous LCD, OLED, and Quantum Dot displays for smartphones along with televisions and consumer electronics. A place where OLED & QD already exist: South Korea (Samsung & LG) Demand for high-quality displays spans various sectors, from automotive to gaming, driven largely by Japan’s advanced manufacturing electronics industries.
North America is projected to be the region with the highest CAGR growth from 2024-2032, thanks to advancements in technology, as well as the high popularity of various applications, such as automotive, healthcare, and entertainment. OLED display adoption is a major trend in high-end smartphones, and the adoption of OLED for smart TVs and digital signage in the region is another key driver. With the presence of companies such as Apple, Tesla, and other tech giants implementing innovative display technologies in their devices, this region is expected to carry out promising growth shortly. In addition, the adoption of AR/VR applications in commercial, education, and healthcare will propel the display market over the forecast timeline.
Some of the major players in the Next Generation Display Market are:
Samsung Display (Galaxy S23 Ultra, Odyssey G9 Monitor)
LG Display (OLED evo C2 Series, UltraGear Gaming Monitor)
BOE Technology (Xiaomi Mi MIX 4 Display, Huawei MatePad Pro Display)
Japan Display (Sony Xperia 1 IV Display, Nintendo Switch Display)
Corning Inc. (Gorilla Glass, Lotus Glass)
Sony Corporation (Bravia XR A90J OLED TV, Xperia 1 III Smartphone)
TCL Technology (6-Series QLED TV, 10 Pro Smartphone)
Hisense (U8H ULED TV, U6H ULED TV)
Sharp Corporation (Aquos R6 Smartphone Display, 8K TV Display)
AU Optronics (AMOLED Panels for Smartphones, 4K UHD Monitors)
Innolux Corporation (LCD Panels for TVs, Touch Panels for Laptops)
E Ink Holdings (E Ink Carta HD, E Ink Prism)
BOE Varitronix (Automotive Displays, Industrial Displays)
Visionox Technology (Flexible AMOLED Displays, In-Display Fingerprint Sensors)
EverDisplay Optronics (AMOLED Panels for Smartphones, Wearable Device Displays)
In July 2024, Samsung Display's next-gen OLED technology enhances Krafton's upcoming game, inZOI, by featuring virtual versions of its innovative products, including foldable and rollable displays.
In January 2025, LG Display unveiled its fourth-generation OLED panel, optimized for the AI era, featuring 4,000 nits’ brightness and improved color performance.
In October 2024, Chinese display panel makers, including BOE and Visionox, unveiled new flexible OLED technologies, targeting flagship smartphones and wearable devices.
| Report Attributes | Details |
|---|---|
| Market Size in 2023 | USD 208.08 Billion |
| Market Size by 2032 | USD 417.61 Billion |
| CAGR | CAGR of 8.09% From 2024 to 2032 |
| Base Year | 2023 |
| Forecast Period | 2024-2032 |
| Historical Data | 2020-2022 |
| Report Scope & Coverage | Market Size, Segments Analysis, Competitive Landscape, Regional Analysis, DROC & SWOT Analysis, Forecast Outlook |
| Key Segments | • By Ingredients (Quantum Dots, Other Nanomaterials, Carbon NanoTubes (CNT)) • By Display Technology (OLED Display, LCD, LED Display Technology, E-Ink) • By Application (Consumer Electronics, Industrial Applications, Movie/Entertainment, TV/Monitors, Automotive, Advertising, E-Reader) • By End Use (Personal Use, Commercial Use, Industrial Use) |
| Regional Analysis/Coverage | North America (US, Canada, Mexico), Europe (Eastern Europe [Poland, Romania, Hungary, Turkey, Rest of Eastern Europe] Western Europe] Germany, France, UK, Italy, Spain, Netherlands, Switzerland, Austria, Rest of Western Europe]), Asia Pacific (China, India, Japan, South Korea, Vietnam, Singapore, Australia, Rest of Asia Pacific), Middle East & Africa (Middle East [UAE, Egypt, Saudi Arabia, Qatar, Rest of Middle East], Africa [Nigeria, South Africa, Rest of Africa], Latin America (Brazil, Argentina, Colombia, Rest of Latin America) |
| Company Profiles | Samsung Display, LG Display, BOE Technology, Japan Display, Corning Inc., Sony Corporation, TCL Technology, Hisense, Sharp Corporation, AU Optronics, Innolux Corporation, E Ink Holdings, BOE Varitronix, Visionox Technology, EverDisplay Optronics. |
Ans: The Next Generation Display Market is expected to grow at a CAGR of 8.09% during 2024-2032.
Ans: Next Generation Display Market size was USD 208.08 billion in 2023 and is expected to Reach USD 417.61 billion by 2032.
Ans: The major growth factor of the Next Generation Display Market is the increasing demand for high-quality, energy-efficient, and innovative display technologies in consumer electronics, automotive, and industrial applications.
Ans: The LCD segment dominated the Next Generation Display Market in 2023.
Ans: Asia Pacific dominated the Next Generation Display Market in 2023.
Table of Content
1. Introduction
1.1 Market Definition
1.2 Scope (Inclusion and Exclusions)
1.3 Research Assumptions
2. Executive Summary
2.1 Market Overview
2.2 Regional Synopsis
2.3 Competitive Summary
3. Research Methodology
3.1 Top-Down Approach
3.2 Bottom-up Approach
3.3. Data Validation
3.4 Primary Interviews
4. Market Dynamics Impact Analysis
4.1 Market Driving Factors Analysis
4.1.1 Drivers
4.1.2 Restraints
4.1.3 Opportunity
4.1.4 Challenges
4.2 PESTLE Analysis
4.3 Porter’s Five Forces Model
5. Statistical Insights and Trends Reporting
5.1 Next Generation Display Consumer Sentiment
5.2 Next Generation Display Adoption by Device Type
6. Competitive Landscape
6.1 List of Major Companies, By Region
6.2 Market Share Analysis, By Region
6.3 Product Benchmarking
6.3.1 Product specifications and features
6.3.2 Pricing
6.4 Strategic Initiatives
6.4.1 Marketing and promotional activities
6.4.2 Distribution and Supply Chain Strategies
6.4.3 Expansion plans and new product launches
6.4.4 Strategic partnerships and collaborations
6.5 Technological Advancements
6.6 Market Positioning and Branding
7. Next Generation Display Market Segmentation, By Ingredients
7.1 Chapter Overview
7.2 Quantum Dots
7.2.1 Quantum Dots Market Trends Analysis (2020-2032)
7.2.2 Quantum Dots Market Size Estimates and Forecasts to 2032 (USD Billion)
7.3 Other Nanomaterials
7.3.1 Other Nanomaterials Market Trends Analysis (2020-2032)
7.3.2 Other Nanomaterials Market Size Estimates and Forecasts to 2032 (USD Billion)
7.4 Carbon NanoTubes (CNT)
7.4.1 Carbon NanoTubes (CNT) Market Trends Analysis (2020-2032)
7.4.2 Carbon NanoTubes (CNT) Market Size Estimates and Forecasts to 2032 (USD Billion)
8. Next Generation Display Market Segmentation, By Display Technology
8.1 Chapter Overview
8.2 OLED Display
8.2.1 OLED Display Market Trends Analysis (2020-2032)
8.2. OLED Display Market Size Estimates and Forecasts to 2032 (USD Billion)
8.3 LCD
8.3.1 LCD Market Trends Analysis (2020-2032)
8.3.2 LCD Market Size Estimates and Forecasts to 2032 (USD Billion)
8.4 LED Display Technology
8.4.1 LED Display Technology Market Trends Analysis (2020-2032)
8.4.2 LED Display Technology Market Size Estimates and Forecasts to 2032 (USD Billion)
8.5 E-Ink
8.5.1 E-Ink Market Trends Analysis (2020-2032)
8.5.2 E-Ink Market Size Estimates and Forecasts to 2032 (USD Billion)
9. Next Generation Display Market Segmentation, By Application
9.1 Chapter Overview
9.2 Consumer Electronics
9.2.1 Consumer Electronics Market Trends Analysis (2020-2032)
9.2. Consumer Electronics Market Size Estimates and Forecasts to 2032 (USD Billion)
9.3 Industrial Applications
9.3.1 Industrial Applications Market Trends Analysis (2020-2032)
9.3.2 Industrial Applications Market Size Estimates and Forecasts to 2032 (USD Billion)
9.4 Movie/Entertainment
9.4.1 Movie/Entertainment Market Trends Analysis (2020-2032)
9.4.2 Movie/Entertainment Market Size Estimates and Forecasts to 2032 (USD Billion)
9.5 TV/Monitors
9.5.1 TV/Monitors Market Trends Analysis (2020-2032)
9.5.2 TV/Monitors Market Size Estimates and Forecasts to 2032 (USD Billion)
9.6 Automotive
9.6.1 Automotive Market Trends Analysis (2020-2032)
9.6.2 Automotive Market Size Estimates and Forecasts to 2032 (USD Billion)
9.7 Advertising
9.7.1 Advertising Market Trends Analysis (2020-2032)
9.7.2 Advertising Market Size Estimates and Forecasts to 2032 (USD Billion)
9.8 E-Reader
9.8.1 E-Reader Market Trends Analysis (2020-2032)
9.8.2 E-Reader Market Size Estimates and Forecasts to 2032 (USD Billion)
10. Next Generation Display Market Segmentation, By End Use
10.1 Chapter Overview
10.2 Personal Use
10.2.1 Personal Use Market Trends Analysis (2020-2032)
10.2.2 Personal Use Market Size Estimates and Forecasts to 2032 (USD Billion)
10.3 Commercial Use
10.3.1 Commercial Use Market Trends Analysis (2020-2032)
10.3.2 Commercial Use Market Size Estimates and Forecasts to 2032 (USD Billion)
10.4 Industrial Use
10.4.1 Industrial Use Market Trends Analysis (2020-2032)
10.4.2 Industrial Use Market Size Estimates and Forecasts to 2032 (USD Billion)
11. Regional Analysis
11.1 Chapter Overview
11.2 North America
11.2.1 Trends Analysis
11.2.2 North America Next Generation Display Market Estimates and Forecasts, by Country (2020-2032) (USD Billion)
11.2.3 North America Next Generation Display Market Estimates and Forecasts, By Ingredients (2020-2032) (USD Billion)
11.2.4 North America Next Generation Display Market Estimates and Forecasts, By Display Technology (2020-2032) (USD Billion)
11.2.5 North America Next Generation Display Market Estimates and Forecasts, By Application (2020-2032) (USD Billion)
11.2.6 North America Next Generation Display Market Estimates and Forecasts, By End Use (2020-2032) (USD Billion)
11.2.7 USA
11.2.7.1 USA Next Generation Display Market Estimates and Forecasts, By Ingredients (2020-2032) (USD Billion)
11.2.7.2 USA Next Generation Display Market Estimates and Forecasts, By Display Technology (2020-2032) (USD Billion)
11.2.7.3 USA Next Generation Display Market Estimates and Forecasts, By Application (2020-2032) (USD Billion)
11.2.7.4 USA Next Generation Display Market Estimates and Forecasts, By End Use (2020-2032) (USD Billion)
11.2.8 Canada
11.2.8.1 Canada Next Generation Display Market Estimates and Forecasts, By Ingredients (2020-2032) (USD Billion)
11.2.8.2 Canada Next Generation Display Market Estimates and Forecasts, By Display Technology (2020-2032) (USD Billion)
11.2.8.3 Canada Next Generation Display Market Estimates and Forecasts, By Application (2020-2032) (USD Billion)
11.2.8.4 Canada Next Generation Display Market Estimates and Forecasts, By End Use (2020-2032) (USD Billion)
11.2.9 Mexico
11.2.9.1 Mexico Next Generation Display Market Estimates and Forecasts, By Ingredients (2020-2032) (USD Billion)
11.2.9.2 Mexico Next Generation Display Market Estimates and Forecasts, By Display Technology (2020-2032) (USD Billion)
11.2.9.3 Mexico Next Generation Display Market Estimates and Forecasts, By Application (2020-2032) (USD Billion)
11.2.9.4 Mexico Next Generation Display Market Estimates and Forecasts, By End Use (2020-2032) (USD Billion)
11.3 Europe
11.3.1 Eastern Europe
11.3.1.1 Trends Analysis
11.3.1.2 Eastern Europe Next Generation Display Market Estimates and Forecasts, by Country (2020-2032) (USD Billion)
11.3.1.3 Eastern Europe Next Generation Display Market Estimates and Forecasts, By Ingredients (2020-2032) (USD Billion)
11.3.1.4 Eastern Europe Next Generation Display Market Estimates and Forecasts, By Display Technology (2020-2032) (USD Billion)
11.3.1.5 Eastern Europe Next Generation Display Market Estimates and Forecasts, By Application (2020-2032) (USD Billion)
11.3.1.6 Eastern Europe Next Generation Display Market Estimates and Forecasts, By End Use (2020-2032) (USD Billion)
11.3.1.7 Poland
11.3.1.7.1 Poland Next Generation Display Market Estimates and Forecasts, By Ingredients (2020-2032) (USD Billion)
11.3.1.7.2 Poland Next Generation Display Market Estimates and Forecasts, By Display Technology (2020-2032) (USD Billion)
11.3.1.7.3 Poland Next Generation Display Market Estimates and Forecasts, By Application (2020-2032) (USD Billion)
11.3.1.7.4 Poland Next Generation Display Market Estimates and Forecasts, By End Use (2020-2032) (USD Billion)
11.3.1.8 Romania
11.3.1.8.1 Romania Next Generation Display Market Estimates and Forecasts, By Ingredients (2020-2032) (USD Billion)
11.3.1.8.2 Romania Next Generation Display Market Estimates and Forecasts, By Display Technology (2020-2032) (USD Billion)
11.3.1.8.3 Romania Next Generation Display Market Estimates and Forecasts, By Application (2020-2032) (USD Billion)
11.3.1.8.4 Romania Next Generation Display Market Estimates and Forecasts, By End Use (2020-2032) (USD Billion)
11.3.1.9 Hungary
11.3.1.9.1 Hungary Next Generation Display Market Estimates and Forecasts, By Ingredients (2020-2032) (USD Billion)
11.3.1.9.2 Hungary Next Generation Display Market Estimates and Forecasts, By Display Technology (2020-2032) (USD Billion)
11.3.1.9.3 Hungary Next Generation Display Market Estimates and Forecasts, By Application (2020-2032) (USD Billion)
11.3.1.9.4 Hungary Next Generation Display Market Estimates and Forecasts, By End Use (2020-2032) (USD Billion)
11.3.1.10 turkey
11.3.1.10.1 Turkey Next Generation Display Market Estimates and Forecasts, By Ingredients (2020-2032) (USD Billion)
11.3.1.10.2 Turkey Next Generation Display Market Estimates and Forecasts, By Display Technology (2020-2032) (USD Billion)
11.3.1.10.3 Turkey Next Generation Display Market Estimates and Forecasts, By Application (2020-2032) (USD Billion)
11.3.1.10.4 Turkey Next Generation Display Market Estimates and Forecasts, By End Use (2020-2032) (USD Billion)
11.3.1.11 Rest of Eastern Europe
11.3.1.11.1 Rest of Eastern Europe Next Generation Display Market Estimates and Forecasts, By Ingredients (2020-2032) (USD Billion)
11.3.1.11.2 Rest of Eastern Europe Next Generation Display Market Estimates and Forecasts, By Display Technology (2020-2032) (USD Billion)
11.3.1.11.3 Rest of Eastern Europe Next Generation Display Market Estimates and Forecasts, By Application (2020-2032) (USD Billion)
11.3.1.11.4 Rest of Eastern Europe Next Generation Display Market Estimates and Forecasts, By End Use (2020-2032) (USD Billion)
11.3.2 Western Europe
11.3.2.1 Trends Analysis
11.3.2.2 Western Europe Next Generation Display Market Estimates and Forecasts, by Country (2020-2032) (USD Billion)
11.3.2.3 Western Europe Next Generation Display Market Estimates and Forecasts, By Ingredients (2020-2032) (USD Billion)
11.3.2.4 Western Europe Next Generation Display Market Estimates and Forecasts, By Display Technology (2020-2032) (USD Billion)
11.3.2.5 Western Europe Next Generation Display Market Estimates and Forecasts, By Application (2020-2032) (USD Billion)
11.3.2.6 Western Europe Next Generation Display Market Estimates and Forecasts, By End Use (2020-2032) (USD Billion)
11.3.2.7 Germany
11.3.2.7.1 Germany Next Generation Display Market Estimates and Forecasts, By Ingredients (2020-2032) (USD Billion)
11.3.2.7.2 Germany Next Generation Display Market Estimates and Forecasts, By Display Technology (2020-2032) (USD Billion)
11.3.2.7.3 Germany Next Generation Display Market Estimates and Forecasts, By Application (2020-2032) (USD Billion)
11.3.2.7.4 Germany Next Generation Display Market Estimates and Forecasts, By End Use (2020-2032) (USD Billion)
11.3.2.8 France
11.3.2.8.1 France Next Generation Display Market Estimates and Forecasts, By Ingredients (2020-2032) (USD Billion)
11.3.2.8.2 France Next Generation Display Market Estimates and Forecasts, By Display Technology (2020-2032) (USD Billion)
11.3.2.8.3 France Next Generation Display Market Estimates and Forecasts, By Application (2020-2032) (USD Billion)
11.3.2.8.4 France Next Generation Display Market Estimates and Forecasts, By End Use (2020-2032) (USD Billion)
11.3.2.9 UK
11.3.2.9.1 UK Next Generation Display Market Estimates and Forecasts, By Ingredients (2020-2032) (USD Billion)
11.3.2.9.2 UK Next Generation Display Market Estimates and Forecasts, By Display Technology (2020-2032) (USD Billion)
11.3.2.9.3 UK Next Generation Display Market Estimates and Forecasts, By Application (2020-2032) (USD Billion)
11.3.2.9.4 UK Next Generation Display Market Estimates and Forecasts, By End Use (2020-2032) (USD Billion)
11.3.2.10 Italy
11.3.2.10.1 Italy Next Generation Display Market Estimates and Forecasts, By Ingredients (2020-2032) (USD Billion)
11.3.2.10.2 Italy Next Generation Display Market Estimates and Forecasts, By Display Technology (2020-2032) (USD Billion)
11.3.2.10.3 Italy Next Generation Display Market Estimates and Forecasts, By Application (2020-2032) (USD Billion)
11.3.2.10.4 Italy Next Generation Display Market Estimates and Forecasts, By End Use (2020-2032) (USD Billion)
11.3.2.11 Spain
11.3.2.11.1 Spain Next Generation Display Market Estimates and Forecasts, By Ingredients (2020-2032) (USD Billion)
11.3.2.11.2 Spain Next Generation Display Market Estimates and Forecasts, By Display Technology (2020-2032) (USD Billion)
11.3.2.11.3 Spain Next Generation Display Market Estimates and Forecasts, By Application (2020-2032) (USD Billion)
11.3.2.11.4 Spain Next Generation Display Market Estimates and Forecasts, By End Use (2020-2032) (USD Billion)
11.3.2.12 Netherlands
11.3.2.12.1 Netherlands Next Generation Display Market Estimates and Forecasts, By Ingredients (2020-2032) (USD Billion)
11.3.2.12.2 Netherlands Next Generation Display Market Estimates and Forecasts, By Display Technology (2020-2032) (USD Billion)
11.3.2.12.3 Netherlands Next Generation Display Market Estimates and Forecasts, By Application (2020-2032) (USD Billion)
11.3.2.12.4 Netherlands Next Generation Display Market Estimates and Forecasts, By End Use (2020-2032) (USD Billion)
11.3.2.13 Switzerland
11.3.2.13.1 Switzerland Next Generation Display Market Estimates and Forecasts, By Ingredients (2020-2032) (USD Billion)
11.3.2.13.2 Switzerland Next Generation Display Market Estimates and Forecasts, By Display Technology (2020-2032) (USD Billion)
11.3.2.13.3 Switzerland Next Generation Display Market Estimates and Forecasts, By Application (2020-2032) (USD Billion)
11.3.2.13.4 Switzerland Next Generation Display Market Estimates and Forecasts, By End Use (2020-2032) (USD Billion)
11.3.2.14 Austria
11.3.2.14.1 Austria Next Generation Display Market Estimates and Forecasts, By Ingredients (2020-2032) (USD Billion)
11.3.2.14.2 Austria Next Generation Display Market Estimates and Forecasts, By Display Technology (2020-2032) (USD Billion)
11.3.2.14.3 Austria Next Generation Display Market Estimates and Forecasts, By Application (2020-2032) (USD Billion)
11.3.2.14.4 Austria Next Generation Display Market Estimates and Forecasts, By End Use (2020-2032) (USD Billion)
11.3.2.15 Rest of Western Europe
11.3.2.15.1 Rest of Western Europe Next Generation Display Market Estimates and Forecasts, By Ingredients (2020-2032) (USD Billion)
11.3.2.15.2 Rest of Western Europe Next Generation Display Market Estimates and Forecasts, By Display Technology (2020-2032) (USD Billion)
11.3.2.15.3 Rest of Western Europe Next Generation Display Market Estimates and Forecasts, By Application (2020-2032) (USD Billion)
11.3.2.15.4 Rest of Western Europe Next Generation Display Market Estimates and Forecasts, By End Use (2020-2032) (USD Billion)
11.4 Asia Pacific
11.4.1 Trends Analysis
11.4.2 Asia Pacific Next Generation Display Market Estimates and Forecasts, by Country (2020-2032) (USD Billion)
11.4.3 Asia Pacific Next Generation Display Market Estimates and Forecasts, By Ingredients (2020-2032) (USD Billion)
11.4.4 Asia Pacific Next Generation Display Market Estimates and Forecasts, By Display Technology (2020-2032) (USD Billion)
11.4.5 Asia Pacific Next Generation Display Market Estimates and Forecasts, By Application (2020-2032) (USD Billion)
11.4.6 Asia Pacific Next Generation Display Market Estimates and Forecasts, By End Use (2020-2032) (USD Billion)
11.4.7 China
11.4.7.1 China Next Generation Display Market Estimates and Forecasts, By Ingredients (2020-2032) (USD Billion)
11.4.7.2 China Next Generation Display Market Estimates and Forecasts, By Display Technology (2020-2032) (USD Billion)
11.4.7.3 China Next Generation Display Market Estimates and Forecasts, By Application (2020-2032) (USD Billion)
11.4.7.4 China Next Generation Display Market Estimates and Forecasts, By End Use (2020-2032) (USD Billion)
11.4.8 India
11.4.8.1 India Next Generation Display Market Estimates and Forecasts, By Ingredients (2020-2032) (USD Billion)
11.4.8.2 India Next Generation Display Market Estimates and Forecasts, By Display Technology (2020-2032) (USD Billion)
11.4.8.3 India Next Generation Display Market Estimates and Forecasts, By Application (2020-2032) (USD Billion)
11.4.8.4 India Next Generation Display Market Estimates and Forecasts, By End Use (2020-2032) (USD Billion)
11.4.9 Japan
11.4.9.1 Japan Next Generation Display Market Estimates and Forecasts, By Ingredients (2020-2032) (USD Billion)
11.4.9.2 Japan Next Generation Display Market Estimates and Forecasts, By Display Technology (2020-2032) (USD Billion)
11.4.9.3 Japan Next Generation Display Market Estimates and Forecasts, By Application (2020-2032) (USD Billion)
11.4.9.4 Japan Next Generation Display Market Estimates and Forecasts, By End Use (2020-2032) (USD Billion)
11.4.10 South Korea
11.4.10.1 South Korea Next Generation Display Market Estimates and Forecasts, By Ingredients (2020-2032) (USD Billion)
11.4.10.2 South Korea Next Generation Display Market Estimates and Forecasts, By Display Technology (2020-2032) (USD Billion)
11.4.10.3 South Korea Next Generation Display Market Estimates and Forecasts, By Application (2020-2032) (USD Billion)
11.4.10.4 South Korea Next Generation Display Market Estimates and Forecasts, By End Use (2020-2032) (USD Billion)
11.4.11 Vietnam
11.4.11.1 Vietnam Next Generation Display Market Estimates and Forecasts, By Ingredients (2020-2032) (USD Billion)
11.4.11.2 Vietnam Next Generation Display Market Estimates and Forecasts, By Display Technology (2020-2032) (USD Billion)
11.4.11.3 Vietnam Next Generation Display Market Estimates and Forecasts, By Application (2020-2032) (USD Billion)
11.4.11.4 Vietnam Next Generation Display Market Estimates and Forecasts, By End Use (2020-2032) (USD Billion)
11.4.12 Singapore
11.4.12.1 Singapore Next Generation Display Market Estimates and Forecasts, By Ingredients (2020-2032) (USD Billion)
11.4.12.2 Singapore Next Generation Display Market Estimates and Forecasts, By Display Technology (2020-2032) (USD Billion)
11.4.12.3 Singapore Next Generation Display Market Estimates and Forecasts, By Application (2020-2032) (USD Billion)
11.4.12.4 Singapore Next Generation Display Market Estimates and Forecasts, By End Use (2020-2032) (USD Billion)
11.4.13 Australia
11.4.13.1 Australia Next Generation Display Market Estimates and Forecasts, By Ingredients (2020-2032) (USD Billion)
11.4.13.2 Australia Next Generation Display Market Estimates and Forecasts, By Display Technology (2020-2032) (USD Billion)
11.4.13.3 Australia Next Generation Display Market Estimates and Forecasts, By Application (2020-2032) (USD Billion)
11.4.13.4 Australia Next Generation Display Market Estimates and Forecasts, By End Use (2020-2032) (USD Billion)
11.4.14 Rest of Asia Pacific
11.4.14.1 Rest of Asia Pacific Next Generation Display Market Estimates and Forecasts, By Ingredients (2020-2032) (USD Billion)
11.4.14.2 Rest of Asia Pacific Next Generation Display Market Estimates and Forecasts, By Display Technology (2020-2032) (USD Billion)
11.4.14.3 Rest of Asia Pacific Next Generation Display Market Estimates and Forecasts, By Application (2020-2032) (USD Billion)
11.4.14.4 Rest of Asia Pacific Next Generation Display Market Estimates and Forecasts, By End Use (2020-2032) (USD Billion)
11.5 Middle East and Africa
11.5.1 Middle East
11.5.1.1 Trends Analysis
11.5.1.2 Middle East Next Generation Display Market Estimates and Forecasts, by Country (2020-2032) (USD Billion)
11.5.1.3 Middle East Next Generation Display Market Estimates and Forecasts, By Ingredients (2020-2032) (USD Billion)
11.5.1.4 Middle East Next Generation Display Market Estimates and Forecasts, By Display Technology (2020-2032) (USD Billion)
11.5.1.5 Middle East Next Generation Display Market Estimates and Forecasts, By Application (2020-2032) (USD Billion)
11.5.1.6 Middle East Next Generation Display Market Estimates and Forecasts, By End Use (2020-2032) (USD Billion)
11.5.1.7 UAE
11.5.1.7.1 UAE Next Generation Display Market Estimates and Forecasts, By Ingredients (2020-2032) (USD Billion)
11.5.1.7.2 UAE Next Generation Display Market Estimates and Forecasts, By Display Technology (2020-2032) (USD Billion)
11.5.1.7.3 UAE Next Generation Display Market Estimates and Forecasts, By Application (2020-2032) (USD Billion)
11.5.1.7.4 UAE Next Generation Display Market Estimates and Forecasts, By End Use (2020-2032) (USD Billion)
11.5.1.8 Egypt
11.5.1.8.1 Egypt Next Generation Display Market Estimates and Forecasts, By Ingredients (2020-2032) (USD Billion)
11.5.1.8.2 Egypt Next Generation Display Market Estimates and Forecasts, By Display Technology (2020-2032) (USD Billion)
11.5.1.8.3 Egypt Next Generation Display Market Estimates and Forecasts, By Application (2020-2032) (USD Billion)
11.5.1.8.4 Egypt Next Generation Display Market Estimates and Forecasts, By End Use (2020-2032) (USD Billion)
11.5.1.9 Saudi Arabia
11.5.1.9.1 Saudi Arabia Next Generation Display Market Estimates and Forecasts, By Ingredients (2020-2032) (USD Billion)
11.5.1.9.2 Saudi Arabia Next Generation Display Market Estimates and Forecasts, By Display Technology (2020-2032) (USD Billion)
11.5.1.9.3 Saudi Arabia Next Generation Display Market Estimates and Forecasts, By Application (2020-2032) (USD Billion)
11.5.1.9.4 Saudi Arabia Next Generation Display Market Estimates and Forecasts, By End Use (2020-2032) (USD Billion)
11.5.1.10 Qatar
11.5.1.10.1 Qatar Next Generation Display Market Estimates and Forecasts, By Ingredients (2020-2032) (USD Billion)
11.5.1.10.2 Qatar Next Generation Display Market Estimates and Forecasts, By Display Technology (2020-2032) (USD Billion)
11.5.1.10.3 Qatar Next Generation Display Market Estimates and Forecasts, By Application (2020-2032) (USD Billion)
11.5.1.10.4 Qatar Next Generation Display Market Estimates and Forecasts, By End Use (2020-2032) (USD Billion)
11.5.1.11 Rest of Middle East
11.5.1.11.1 Rest of Middle East Next Generation Display Market Estimates and Forecasts, By Ingredients (2020-2032) (USD Billion)
11.5.1.11.2 Rest of Middle East Next Generation Display Market Estimates and Forecasts, By Display Technology (2020-2032) (USD Billion)
11.5.1.11.3 Rest of Middle East Next Generation Display Market Estimates and Forecasts, By Application (2020-2032) (USD Billion)
11.5.1.11.4 Rest of Middle East Next Generation Display Market Estimates and Forecasts, By End Use (2020-2032) (USD Billion)
11.5.2 Africa
11.5.2.1 Trends Analysis
11.5.2.2 Africa Next Generation Display Market Estimates and Forecasts, by Country (2020-2032) (USD Billion)
11.5.2.3 Africa Next Generation Display Market Estimates and Forecasts, By Ingredients (2020-2032) (USD Billion)
11.5.2.4 Africa Next Generation Display Market Estimates and Forecasts, By Display Technology (2020-2032) (USD Billion)
11.5.2.5 Africa Next Generation Display Market Estimates and Forecasts, By Application (2020-2032) (USD Billion)
11.5.2.6 Africa Next Generation Display Market Estimates and Forecasts, By End Use (2020-2032) (USD Billion)
11.5.2.7 South Africa
11.5.2.7.1 South Africa Next Generation Display Market Estimates and Forecasts, By Ingredients (2020-2032) (USD Billion)
11.5.2.7.2 South Africa Next Generation Display Market Estimates and Forecasts, By Display Technology (2020-2032) (USD Billion)
11.5.2.7.3 South Africa Next Generation Display Market Estimates and Forecasts, By Application (2020-2032) (USD Billion)
11.5.2.7.4 South Africa Next Generation Display Market Estimates and Forecasts, By End Use (2020-2032) (USD Billion)
11.5.2.8 Nigeria
11.5.2.8.1 Nigeria Next Generation Display Market Estimates and Forecasts, By Ingredients (2020-2032) (USD Billion)
11.5.2.8.2 Nigeria Next Generation Display Market Estimates and Forecasts, By Display Technology (2020-2032) (USD Billion)
11.5.2.8.3 Nigeria Next Generation Display Market Estimates and Forecasts, By Application (2020-2032) (USD Billion)
11.5.2.8.4 Nigeria Next Generation Display Market Estimates and Forecasts, By End Use (2020-2032) (USD Billion)
11.5.2.9 Rest of Africa
11.5.2.9.1 Rest of Africa Next Generation Display Market Estimates and Forecasts, By Ingredients (2020-2032) (USD Billion)
11.5.2.9.2 Rest of Africa Next Generation Display Market Estimates and Forecasts, By Display Technology (2020-2032) (USD Billion)
11.5.2.9.3 Rest of Africa Next Generation Display Market Estimates and Forecasts, By Application (2020-2032) (USD Billion)
11.5.2.9.4 Rest of Africa Next Generation Display Market Estimates and Forecasts, By End Use (2020-2032) (USD Billion)
11.6 Latin America
11.6.1 Trends Analysis
11.6.2 Latin America Next Generation Display Market Estimates and Forecasts, by Country (2020-2032) (USD Billion)
11.6.3 Latin America Next Generation Display Market Estimates and Forecasts, By Ingredients (2020-2032) (USD Billion)
11.6.4 Latin America Next Generation Display Market Estimates and Forecasts, By Display Technology (2020-2032) (USD Billion)
11.6.5 Latin America Next Generation Display Market Estimates and Forecasts, By Application (2020-2032) (USD Billion)
11.6.6 Latin America Next Generation Display Market Estimates and Forecasts, By End Use (2020-2032) (USD Billion)
11.6.7 Brazil
11.6.7.1 Brazil Next Generation Display Market Estimates and Forecasts, By Ingredients (2020-2032) (USD Billion)
11.6.7.2 Brazil Next Generation Display Market Estimates and Forecasts, By Display Technology (2020-2032) (USD Billion)
11.6.7.3 Brazil Next Generation Display Market Estimates and Forecasts, By Application (2020-2032) (USD Billion)
11.6.7.4 Brazil Next Generation Display Market Estimates and Forecasts, By End Use (2020-2032) (USD Billion)
11.6.8 Argentina
11.6.8.1 Argentina Next Generation Display Market Estimates and Forecasts, By Ingredients (2020-2032) (USD Billion)
11.6.8.2 Argentina Next Generation Display Market Estimates and Forecasts, By Display Technology (2020-2032) (USD Billion)
11.6.8.3 Argentina Next Generation Display Market Estimates and Forecasts, By Application (2020-2032) (USD Billion)
11.6.8.4 Argentina Next Generation Display Market Estimates and Forecasts, By End Use (2020-2032) (USD Billion)
11.6.9 Colombia
11.6.9.1 Colombia Next Generation Display Market Estimates and Forecasts, By Ingredients (2020-2032) (USD Billion)
11.6.9.2 Colombia Next Generation Display Market Estimates and Forecasts, By Display Technology (2020-2032) (USD Billion)
11.6.9.3 Colombia Next Generation Display Market Estimates and Forecasts, By Application (2020-2032) (USD Billion)
11.6.9.4 Colombia Next Generation Display Market Estimates and Forecasts, By End Use (2020-2032) (USD Billion)
11.6.10 Rest of Latin America
11.6.10.1 Rest of Latin America Next Generation Display Market Estimates and Forecasts, By Ingredients (2020-2032) (USD Billion)
11.6.10.2 Rest of Latin America Next Generation Display Market Estimates and Forecasts, By Display Technology (2020-2032) (USD Billion)
11.6.10.3 Rest of Latin America Next Generation Display Market Estimates and Forecasts, By Application (2020-2032) (USD Billion)
11.6.10.4 Rest of Latin America Next Generation Display Market Estimates and Forecasts, By End Use (2020-2032) (USD Billion)
12. Company Profiles
12.1 Samsung Display
12.1.1 Company Overview
12.1.2 Financial
12.1.3 Products/ Services Offered
12.1.4 SWOT Analysis
12.2 LG Display
12.2.1 Company Overview
12.2.2 Financial
12.2.3 Products/ Services Offered
12.2.4 SWOT Analysis
12.3 BOE Technology.
12.3.1 Company Overview
12.3.2 Financial
12.3.3 Products/ Services Offered
12.3.4 SWOT Analysis
12.4 Japan Display
12.4.1 Company Overview
12.4.2 Financial
12.4.3 Products/ Services Offered
12.4.4 SWOT Analysis
12.5 Corning Inc
12.5.1 Company Overview
12.5.2 Financial
12.5.3 Products/ Services Offered
12.5.4 SWOT Analysis
12.6 Sony Corporation
12.6.1 Company Overview
12.6.2 Financial
12.6.3 Products/ Services Offered
12.6.4 SWOT Analysis
12.7 TCL Technology
12.7.1 Company Overview
12.7.2 Financial
12.7.3 Products/ Services Offered
12.7.4 SWOT Analysis
12.8 Hisense
12.8.1 Company Overview
12.8.2 Financial
12.8.3 Products/ Services Offered
12.8.4 SWOT Analysis
12.9 Sharp Corporation
12.9.1 Company Overview
12.9.2 Financial
12.9.3 Products/ Services Offered
12.9.4 SWOT Analysis
12.10 AU Optronics
12.10.1 Company Overview
12.10.2 Financial
12.10.3 Products/ Services Offered
12.10.4 SWOT Analysis
13. Use Cases and Best Practices
14. Conclusion
An accurate research report requires proper strategizing as well as implementation. There are multiple factors involved in the completion of good and accurate research report and selecting the best methodology to compete the research is the toughest part. Since the research reports we provide play a crucial role in any company’s decision-making process, therefore we at SNS Insider always believe that we should choose the best method which gives us results closer to reality. This allows us to reach at a stage wherein we can provide our clients best and accurate investment to output ratio.
Each report that we prepare takes a timeframe of 350-400 business hours for production. Starting from the selection of titles through a couple of in-depth brain storming session to the final QC process before uploading our titles on our website we dedicate around 350 working hours. The titles are selected based on their current market cap and the foreseen CAGR and growth.
The 5 steps process:
Step 1: Secondary Research:
Secondary Research or Desk Research is as the name suggests is a research process wherein, we collect data through the readily available information. In this process we use various paid and unpaid databases which our team has access to and gather data through the same. This includes examining of listed companies’ annual reports, Journals, SEC filling etc. Apart from this our team has access to various associations across the globe across different industries. Lastly, we have exchange relationships with various university as well as individual libraries.

Step 2: Primary Research
When we talk about primary research, it is a type of study in which the researchers collect relevant data samples directly, rather than relying on previously collected data. This type of research is focused on gaining content specific facts that can be sued to solve specific problems. Since the collected data is fresh and first hand therefore it makes the study more accurate and genuine.
We at SNS Insider have divided Primary Research into 2 parts.
Part 1 wherein we interview the KOLs of major players as well as the upcoming ones across various geographic regions. This allows us to have their view over the market scenario and acts as an important tool to come closer to the accurate market numbers. As many as 45 paid and unpaid primary interviews are taken from both the demand and supply side of the industry to make sure we land at an accurate judgement and analysis of the market.
This step involves the triangulation of data wherein our team analyses the interview transcripts, online survey responses and observation of on filed participants. The below mentioned chart should give a better understanding of the part 1 of the primary interview.

Part 2: In this part of primary research the data collected via secondary research and the part 1 of the primary research is validated with the interviews from individual consultants and subject matter experts.
Consultants are those set of people who have at least 12 years of experience and expertise within the industry whereas Subject Matter Experts are those with at least 15 years of experience behind their back within the same space. The data with the help of two main processes i.e., FGDs (Focused Group Discussions) and IDs (Individual Discussions). This gives us a 3rd party nonbiased primary view of the market scenario making it a more dependable one while collation of the data pointers.
Step 3: Data Bank Validation
Once all the information is collected via primary and secondary sources, we run that information for data validation. At our intelligence centre our research heads track a lot of information related to the market which includes the quarterly reports, the daily stock prices, and other relevant information. Our data bank server gets updated every fortnight and that is how the information which we collected using our primary and secondary information is revalidated in real time.

Step 4: QA/QC Process
After all the data collection and validation our team does a final level of quality check and quality assurance to get rid of any unwanted or undesired mistakes. This might include but not limited to getting rid of the any typos, duplication of numbers or missing of any important information. The people involved in this process include technical content writers, research heads and graphics people. Once this process is completed the title gets uploader on our platform for our clients to read it.
Step 5: Final QC/QA Process:
This is the last process and comes when the client has ordered the study. In this process a final QA/QC is done before the study is emailed to the client. Since we believe in giving our clients a good experience of our research studies, therefore, to make sure that we do not lack at our end in any way humanly possible we do a final round of quality check and then dispatch the study to the client.
Key Segments:
By Ingredients
Quantum Dots
Other Nanomaterials
Carbon NanoTubes (CNT)
By Display Technology
OLED Display
LCD
LED Display Technology
E-Ink
By Application
Consumer Electronics
Industrial Applications
Movie/Entertainment
TV/Monitors
Automotive
Advertising
E-Reader
By End Use
Personal Use
Commercial Use
Industrial Use
Request for Segment Customization as per your Business Requirement: Segment Customization Request
Regional Coverage:
North America
US
Canada
Mexico
Europe
Eastern Europe
Poland
Romania
Hungary
Turkey
Rest of Eastern Europe
Western Europe
Germany
France
UK
Italy
Spain
Netherlands
Switzerland
Austria
Rest of Western Europe
Asia Pacific
China
India
Japan
South Korea
Vietnam
Singapore
Australia
Rest of Asia Pacific
Middle East & Africa
Middle East
UAE
Egypt
Saudi Arabia
Qatar
Rest of Middle East
Africa
Nigeria
South Africa
Rest of Africa
Latin America
Brazil
Argentina
Colombia
Rest of Latin America
Request for Country Level Research Report: Country Level Customization Request
Available Customization
With the given market data, SNS Insider offers customization as per the company’s specific needs. The following customization options are available for the report:
Detailed Volume Analysis
Criss-Cross segment analysis (e.g. Product X Application)
Competitive Product Benchmarking
Geographic Analysis
Additional countries in any of the regions
Customized Data Representation
Detailed analysis and profiling of additional market players
The UV LED Market Size was valued at USD 1.1 Billion in 2023 and is expected to reach USD 6.3 Billion by 2032, growing at a CAGR of 21.27% from 2024-2032.
The Pet Wearable Market Size was valued at USD 3.27 billion in 2023 and is expected to grow at a CAGR of 14.77% to reach USD 11.25 billion by 2032.
The Distributed Temperature Sensing Market Size was valued at USD 758.63 million in 2023 and is expected to grow at a CAGR of 7.04% During 2024-2032.
The Distributed Acoustic Sensing (DAS) Market was valued at USD 631.45 million in 2023 and is expected to grow at a CAGR of 10.37% by forecasts 2024-2032.
The Industrial PC Market Size was USD 5.5 Billion in 2023 and is expected to reach USD 9.4 Billion by 2032 and grow at a CAGR of 5.9% by 2024-2032.
The Electric Drives Market Size was valued at USD 2.6 billion in 2023 and is expected to grow at a CAGR of 18.35% to reach USD 11.78 billion by 2032.

Hi! Click one of our member below to chat on Phone
© 2025 All Rights Reserved by SNS Insider Pvt Ltd


