image

Network Slicing Market Report Scope & Overview:

Network Slicing Market Revenue Analysis

Get More Information on Network Slicing Market - Request Sample Report

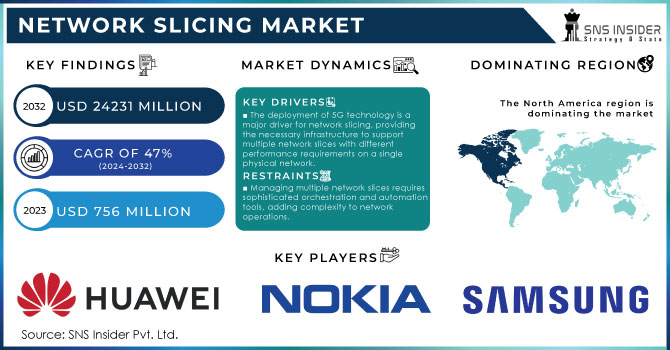
Network Slicing Market size was valued at USD 756 Million in 2023. It is expected to Reach USD 24231 Million by 2032 and grow at a CAGR of 47% over the forecast period of 2024-2032.

The network slicing market is growing with the increased penetration of IoT solutions and implementation of new technologies, such as AI, AR/VR (Artificial Intelligence/Virtual Reality), and M2M communication. This expansion is also supported by the usage of cloud services becoming more and more prevalent in the IT world. Demand for network slicing-enabled 5G in BFSI, healthcare & retail eCommerce is also fuelling the market growth. Such technology improves service productivity and management ROI (return on investment). It also allows businesses to customize networks to meet specific requirements efficiently and cost-effective manner and is underpinned by service-level agreements. Network slicing can increase the utilization of 5G base stations by up to 25%, optimizing the capacity and performance of the network. It supports dynamic bandwidth allocation with a minimum granularity of 1 Mbps, making it applicable in many customized network service scenarios. Efficient network slicing implementation and management can deliver up to 30% reduction in Capital Expenditure (CapEx) and up to 25% savings in operational expenditure for operators.

The widespread adoption of IoT and advancements in M2M communication networks are changing the ways products and appliances interact with systems. Some IoT applications require low-latency, high-power mobile that is ideal for video surveillance while others demand long-range, low-latency and are mostly used with network slicing in smart factories or Cities. Growth of 5G technology to drive market growth for the emergence of IoT applications, especially mission-critical and machine-type communications, network slicing solutions are expected to support these emerging types of IoT applications faster as the adoption rate grows during the forecast period more than 20 telecom operators have deployed commercial network slicing services across the globe, and more than 50 appear to trial some form of network slices around late 2024. Network slicing also enhances QoS measurements, such as packet loss and jitter by at least 60%, meaning more dependable network performance to enable critical applications.

Market Dynamics

Drivers

  • The deployment of 5G technology is a major driver for network slicing, providing the necessary infrastructure to support multiple network slices with different performance requirements on a single physical network.

  • The growing number of IoT devices and the need for machine-to-machine (M2M) communications require networks that can handle diverse requirements, which network slicing can efficiently provide.

  • Applications such as virtual reality (VR), augmented reality (AR), and ultra-high-definition (UHD) video streaming require high bandwidth and low latency, which network slicing can deliver by creating dedicated slices for these services.

  • Network slicing enables more efficient use of network resources, improving service quality and maximizing return on investment (ROI) for network operators.

The introduction of 5G networks is one of the key factors boosting the market demand for network slicing as it enables infrastructure that can accommodate different network slices with diverse performance requirements in a single physical network. With 5G technology spreading around the world, it comes with much-improved speed, latency, and capacity compared to its predecessor technologies. In 2023, the global 5G subscriptions reached 1.5 billion, representing a significant increase from 2022's 1 billion subscriptions. The increasing implementation of 5G networks across the globe is underscoring the demand for network slicing - a practice that enables network operators to deliver virtualized and isolated parts within the same networking architecture, customizing them to distinct use cases and applications. Healthcare is a major use case for 5G network slicing.  Ericsson, BT Group, and Qualcomm Technologies have completed a 5G end-to-end network slicing demonstration in the UK in 2024. The first part of the demonstration showed that network slicing can support critical healthcare applications like remote surgery and telemedicine, which depend on ultra-reliable communication (URLLC). Also, T-Mobile rolled out a 5G network slicing beta for developers in August 2023. The beta program allows developers to hone their video calling apps using improved network conditions including steady uplink and downlink speeds, reduced latency, and enhanced reliability over T-Mobile's 5G standalone (SA) network. These initiatives underline the prospects of network slicing in improving user experience across various use cases, which is expected to facilitate market growth. The rising utilization of 5G networks not only improves existing applications but opens new opportunities across sectors and underpins the significance of network slicing in an evolving telecommunications ecosystem.

Restraints

  • The initial investment required for the deployment of network slicing infrastructure, including 5G technology and related equipment, can be substantial, and create a barrier for some operators.

  • Managing multiple network slices simultaneously requires sophisticated orchestration and automation tools, adding complexity to network operations.

  • While network slicing can enhance security by isolating slices, it also introduces new security challenges, such as ensuring each slice is adequately protected and preventing cross-slice interference.

The cost of deploying network-slicing infrastructure is one the most important problems preventing its significant barrier to its widespread adoption. Deploying a network-slicing framework entails significant investments - from converting existing networks to 5G technology and rolling out new hardware to the use of advanced software for NFV (Network Functions Virtualization) & SDN. The European Telecommunications Network Operators' Association (ETNO), projected Europe's telecom operators into as much as €500 billion of investment in 5G and Fiber networks by the end of 2025. These costs are not limited to hardware but also encompass significant expenditures on software upgrades, staff training, and maintenance.

Earlier adopters like SK Telecom and Deutsche Telekom have also highlighted significant investments they conduct network slicing trials. For example, SK Telecom invested over $100 million in 2022 to upgrade its network infrastructure for QoS-enabled slice delivery. While these investments are necessary steps, the return on investment (ROI) is uncertain given how nascent network slicing is as a technology and in terms of its adoption curve. The initial capital expenditure to build network slicing may deter many of the smaller telecom operators and enterprises from adopting it and hindering overall market growth. The financial burden, coupled with the need for continuous updates and maintenance, underscores the economic challenges associated with network slicing deployment.

Segment Analysis

By Enterprise type

Based on enterprise type, the large enterprise segment has dominated the market with 65% in 2023 and is expected to maintain this dominance during the forecast period. As such, the availability of 5G networks and IoT technologies in large enterprises to improve uninterrupted customer service is creating demand for these platforms. On the other hand, small and medium enterprises (SMEs) are expected to grow at a CAGR of 51%, over the forecast period. The SMEs had been slow to adopt network slicing solutions which promise improved productivity and cost efficiencies. This slow integration by smaller companies indicates a constant rise, as they still become acquainted with the advantages and benefits of these new technologies.

By End-user

The healthcare segment was the dominant revenue contributor with a more than 21.6% market share in 2023 and is poised to grow with a significant CAGR over the forecast period. The growth is due to the growing usage of 5G technologies as well as network-slicing solutions in the healthcare sector. With technological advancements such as robotic surgeries, IoT and AI redefining healthcare delivery, 5G services along with network slicing the entire value chain of healthcare revolutionized. We anticipate that these innovations will differentially affect various key stakeholders, such as providers, health plan providers, and pharmaceutical companies. 70% of organizations across manufacturing, healthcare and automotive aiming to adopt network slicing by 2025 in their unique connectivity & performance. The above network slicing solutions transformations lead to the potential for far greater benefits in the areas of hospital inventory management (real-time tracking), real-time occupancy tracking within hospitals, and movement monitoring all leading to enhanced patient experience, care quality improvement, and a cost reduction. 5G networks can also transmit these insights to the Electronic Medical Record (EMR) systems ensuring optimal monitoring and assessment of hospital procedures.

On the other hand, the manufacturing segment is projected to witness the highest CAGR with 52.3% over the forecast period. Factory Automation is a Type of Manufacturing Process That Results to Requiring No Human Interaction and Work Automatically. This changes the traditional way of the decision-making process by having interconnected devices from one place to another which helps increase efficiency and innovation in manufacturing processes. Network slicing can reduce latency by up to 50% compared to traditional networks, making it highly suitable for applications requiring real-time communication such as autonomous driving and industrial automation.

Regional analysis

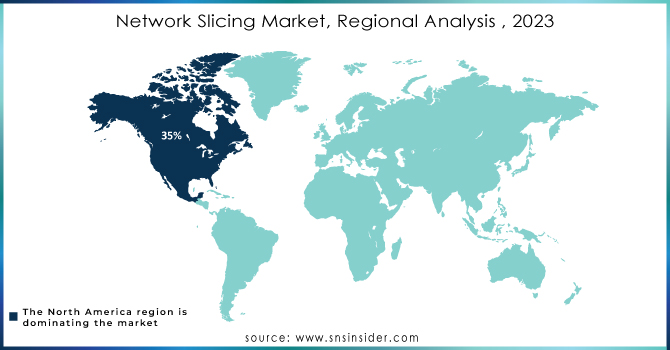
The North America region dominated the market with a 34.5% revenue share in 2023, the growth driven by greater smartphone adoption and the proliferation of internet services that kept adding new internet subscribers. Market growth has been significantly increased in the region due to the presence of major industry players like Cisco Systems Inc., Mavenir Systems, Inc., and Intel Corporation. Additionally, companies in North America are advancing innovative solutions for the risk-free utilization and control of network services, further proliferating market growth. Moreover, the public 5G deployment promotion and increased investment as well as early adoption of advanced technologies on account of high digital engagement are some factors contributing to growth. The increasing adoption of IoT and the explosion in the growth of smart cities across North America region anticipated to offer several opportunities for market expansion over the forecast period of 2024-2032.

Asia Pacific is likely to emerge as one of the key regions boasting a CAGR of over 50% during the forecast period. The large and distributed consumer bases in both India & China are driving demand for more services, making network-slicing solutions very valuable. This growth can be attributed to the advancements in IoT technology and infrastructure, along with the rapid adoption of these solutions across multiple major sectors such as healthcare, government, manufacturing & financial services. This makes the area a great investment opportunity for communication service providers, to exploit this untapped potential. Apart from this, companies expanding their presence in the APAC region are increasingly focusing on gaining a wider customer base and growing internet subscribers through solid growth prospects created lucrative opportunities for the regional market.

Network-Slicing-Market-Regional-Analysis--2023

Region Coverage:

North America

  • USA

  • Canada

  • Mexico

Europe

  • Eastern Europe

    • Poland

    • Romania

    • Hungary

    • Turkey

    • Rest of Eastern Europe

  • Western Europe

    • Germany

    • France

    • UK

    • Italy

    • Spain

    • Netherlands

    • Switzerland

    • Austria

    • Rest of Western Europe

Asia Pacific

  • China

  • India

  • Japan

  • South Korea

  • Vietnam

  • Singapore

  • Australia

  • Rest of Asia Pacific

Middle East & Africa

  • Middle East

    • UAE

    • Egypt

    • Saudi Arabia

    • Qatar

    • Rest of the Middle East

  • Africa

    • Nigeria

    • South Africa

    • Rest of Africa

Latin America

  • Brazil

  • Argentina

  • Colombia

  • Rest of Latin America

KEY PLAYERS

The major key players in the Network Slicing Market are EricssonSamsung, Nokia Corporation, Huawei Technologies, ZTE Corporation, Cisco Systems Inc., HPE, Mavenir Systems Inc., VMware, Affirmed Networks, Samsung, Amdocs, Inc.Intel Corporation, Hewlett Packard Enterprise, Tambora Systems Ltd., and other players.

RECENT DEVELOPMENTS

  • Ericsson, BT Group, and Qualcomm Technologies completed the first end-to-end testing of UK enterprise and consumer applications all connected across a commercial grade 5G standalone network in February 2024. Ericsson enabled the UK to become an innovation hub with their 5G Core and Radio Access Network.

  • T-Mobile 5G network slicing beta - August 2023 Also, the beta program allows developers to improve video calling applications with better network conditions by providing higher uplink and downlink speeds, lower latency, and increased reliability using T-Mobile's 5G standalone (SA) network.

  • In June 2023, Nokia announced a successful trial of an innovative solution allowing Android smartphone users to purchase and activate network slices on-demand from their service provider. Available to Android 14 users, this feature will enhance user experiences across various applications, including gaming, broadcasting, streaming, and social media.

  • In February 14, 2023, The second development in an announcement in the network slicing market was made by Ericsson. Ericsson announced that it had launched a new network-slicing platform called Ericsson Network Slicing Manager. This platform is designed to help mobile operators deploy and manage network-slicing services more efficiently.

Network Slicing Market Report Scope:

Report Attributes Details
Market Size in 2023  USD 756 Mn
Market Size by 2032  USD 24231 Mn
CAGR   CAGR of 51.7 % From 2023 to 2032
Base Year 2022
Forecast Period  2024-2032
Historical Data  2020-2022
Report Scope & Coverage Market Size, Segments Analysis, Competitive  Landscape, Regional Analysis, DROC & SWOT Analysis, Forecast Outlook
Key Segments • By Component (Solution, Services)
• By Enterprise Type (Large Enterprises, Small & Medium Enterprises)
• By End-User (Communication Service Providers, Enterprises)
• By Industry Vertical (Manufacturing, Healthcare, Fast-Moving Consumer Goods, Retail, E-commerce, Automotive, Others)
Regional Analysis/Coverage North America (US, Canada, Mexico), Europe (Eastern Europe [Poland, Romania, Hungary, Turkey, Rest of Eastern Europe] Western Europe] Germany, France, UK, Italy, Spain, Netherlands, Switzerland, Austria, Rest of Western Europe]). Asia Pacific (China, India, Japan, South Korea, Vietnam, Singapore, Australia, Rest of Asia Pacific), Middle East & Africa (Middle East [UAE, Egypt, Saudi Arabia, Qatar, Rest of Middle East], Africa [Nigeria, South Africa, Rest of Africa], Latin America (Brazil, Argentina, Colombia Rest of Latin America)
Company Profiles Ericsson, Samsung, Nokia Corporation, Huawei Technologies, ZTE Corporation, Cisco Systems Inc., HPE, Mavenir Systems Inc., VMware, Affirmed Networks, Samsung, Amdocs, Inc., Intel Corporation, Hewlett Packard Enterprise, Tambora Systems Ltd.
Key Drivers • The deployment of 5G technology is a major driver for network slicing, providing the necessary infrastructure to support multiple network slices with different performance requirements on a single physical network.
Market Restraints • The initial investment required for the deployment of network slicing infrastructure, including 5G technology and related equipment, can be substantial, and create a barrier for some operators.

Frequently Asked Questions

Ans. The Compound Annual Growth rate for Network Slicing Market over the forecast period is 47 %.

Ans. The projected size of the Network Slicing Market is USD 24231 Million by 2032.

Ans. Network slicing is a technique that allows multiple logical networks to be created on top of a common shared physical network. Each "slice" is an isolated end-to-end network that can be tailored to the requirements of its particular application, even in real time.

Ans. Network slicing offers several benefits such as flexibility, resilience, cost-effectiveness, new revenue opportunities, and efficiency.

Ans. Network slicing poses challenges such as security, complexity, and interoperability that need to be addressed to ensure that network slicing can be implemented effectively.

Table Of Content

1. Introduction

1.1 Market Definition

1.2 Scope (Inclusion and Exclusions)

1.3 Research Assumptions

2. Executive Summary

2.1 Market Overview

2.2 Regional Synopsis

2.3 Competitive Summary

3. Research Methodology

3.1 Top-Down Approach

3.2 Bottom-up Approach

3.3. Data Validation

3.4 Primary Interviews

4. Market Dynamics Impact Analysis

4.1 Market Driving Factors Analysis

4.1.1 Drivers

4.1.2 Restraints

4.1.3 Opportunities

4.1.4 Challenges

4.2 PESTLE Analysis

4.3 Porter’s Five Forces Model

5. Statistical Insights and Trends Reporting

5.1 Infrastructure & Deployment Statistics, 2023

5.2 Performance & Efficiency Metrics, 2023

5.3 Regulatory & Compliance Statistics, 2023

5.4 Customer & User Insights

6. Competitive Landscape

6.1 List of Major Companies, By Region

6.2 Market Share Analysis, By Region

6.3 Product Benchmarking

6.3.1 Product specifications and features

6.3.2 Pricing

6.4 Strategic Initiatives

6.4.1 Marketing and promotional activities

6.4.2 Distribution and Supply Chain Strategies

6.4.3 Expansion plans and new product launches

6.4.4 Strategic partnerships and collaborations

6.5 Technological Advancements

6.6 Market Positioning and Branding

7. Network Slicing Market Segmentation, By Industry Vertical

7.1 Chapter Overview

7.2 Manufacturing

7.2.1 Manufacturing Market Trends Analysis (2020-2032)

7.2.2 Manufacturing Market Size Estimates and Forecasts to 2032 (USD Billion)

7.3 Healthcare

7.3.1 Healthcare Market Trends Analysis (2020-2032)

7.3.2 Healthcare Market Size Estimates and Forecasts to 2032 (USD Billion)

7.4 Fast-Moving Consumer Goods

7.4.1 Fast-Moving Consumer Goods Market Trends Analysis (2020-2032)

7.4.2 Fast-Moving Consumer Goods Market Size Estimates and Forecasts to 2032 (USD Billion)

7.5 Retail

7.5.1 Retail Market Trends Analysis (2020-2032)

7.5.2 Retail Market Size Estimates and Forecasts to 2032 (USD Billion)

7.7 E-commerce

7.7.1 E-commerce Market Trends Analysis (2020-2032)

7.7.2 E-commerce Market Size Estimates and Forecasts to 2032 (USD Billion)

7.8 Automotive

7.8.1 Automotive Market Trends Analysis (2020-2032)

7.8.2 Automotive Market Size Estimates and Forecasts to 2032 (USD Billion)

7.9 Others

7.9.1 Others Market Trends Analysis (2020-2032)

7.9.2 Others Market Size Estimates and Forecasts to 2032 (USD Billion)

8. Network Slicing Market Segmentation, By Component

8.1 Chapter Overview

8.2 Solution

8.2.1 Solution Market Trends Analysis (2020-2032)

8.2.2 Solution Market Size Estimates and Forecasts to 2032 (USD Billion)

8.3 Services

  8.3.1 Services Market Trends Analysis (2020-2032)

8.3.2 Services Market Size Estimates and Forecasts to 2032 (USD Billion)

9. Network Slicing Market Segmentation, By Enterprise Type

9.1 Chapter Overview

9.2 Large Enterprises

9.2.1 Large Enterprises Market Trends Analysis (2020-2032)

9.2.2 Large Enterprises Market Size Estimates and Forecasts to 2032 (USD Billion)

9.3 Small & Medium Enterprises

9.3.1 Small & Medium Enterprises Market Trends Analysis (2020-2032)

9.3.2 Small & Medium Enterprises Market Size Estimates and Forecasts to 2032 (USD Billion)

10. Network Slicing Market Segmentation, By End-User

10.1 Chapter Overview

10.2 Communication Service Providers

10.2.1 Communication Service Providers Market Trends Analysis (2020-2032)

10.2.2 Communication Service Providers Market Size Estimates and Forecasts to 2032 (USD Billion)

10.3 Enterprises

10.3.1 Enterprises Market Trends Analysis (2020-2032)

10.3.2 Enterprises Market Size Estimates and Forecasts to 2032 (USD Billion)

11. Regional Analysis

11.1 Chapter Overview

11.2 North America

11.2.1 Trends Analysis

11.2.2 North America Network Slicing Market Estimates and Forecasts, by Country (2020-2032) (USD Billion)

11.2.3 North America Network Slicing Market Estimates and Forecasts, By Industry Vertical (2020-2032) (USD Billion) 

11.2.4 North America Network Slicing Market Estimates and Forecasts, By Component (2020-2032) (USD Billion)

11.2.5 North America Network Slicing Market Estimates and Forecasts, By Enterprise Type (2020-2032) (USD Billion)

11.2.6 North America Network Slicing Market Estimates and Forecasts,  By End-User(2020-2032) (USD Billion)

11.2.7 USA

11.2.7.1 USA Network Slicing Market Estimates and Forecasts, By Industry Vertical (2020-2032) (USD Billion)

11.2.7.2 USA Network Slicing Market Estimates and Forecasts, By Component (2020-2032) (USD Billion)

11.2.7.3 USA Network Slicing Market Estimates and Forecasts, By Enterprise Type (2020-2032) (USD Billion)

11.2.7.4 USA Network Slicing Market Estimates and Forecasts,  By End-User(2020-2032) (USD Billion)

11.2.8 Canada

11.2.8.1 Canada Network Slicing Market Estimates and Forecasts, By Industry Vertical (2020-2032) (USD Billion)

11.2.8.2 Canada Network Slicing Market Estimates and Forecasts, By Component (2020-2032) (USD Billion)

11.2.8.3 Canada Network Slicing Market Estimates and Forecasts, By Enterprise Type (2020-2032) (USD Billion)

11.2.8.4 Canada Network Slicing Market Estimates and Forecasts,  By End-User (2020-2032) (USD Billion)

11.2.9 Mexico

11.2.9.1 Mexico Network Slicing Market Estimates and Forecasts, By Industry Vertical (2020-2032) (USD Billion)

11.2.9.2 Mexico Network Slicing Market Estimates and Forecasts, By Component (2020-2032) (USD Billion)

11.2.9.3 Mexico Network Slicing Market Estimates and Forecasts, By Enterprise Type (2020-2032) (USD Billion)

11.2.9.4 Mexico Network Slicing Market Estimates and Forecasts,  By End-User (2020-2032) (USD Billion)

11.3 Europe

11.3.1 Eastern Europe

11.3.1.1 Trends Analysis

11.3.1.2 Eastern Europe Network Slicing Market Estimates and Forecasts, by Country (2020-2032) (USD Billion)

11.3.1.3 Eastern Europe Network Slicing Market Estimates and Forecasts, By Industry Vertical (2020-2032) (USD Billion) 

11.3.1.4 Eastern Europe Network Slicing Market Estimates and Forecasts, By Component (2020-2032) (USD Billion)

11.3.1.5 Eastern Europe Network Slicing Market Estimates and Forecasts, By Enterprise Type (2020-2032) (USD Billion)

11.3.1.6 Eastern Europe Network Slicing Market Estimates and Forecasts,  By End-User(2020-2032) (USD Billion)

11.3.1.7 Poland

11.3.1.7.1 Poland Network Slicing Market Estimates and Forecasts, By Industry Vertical (2020-2032) (USD Billion)

11.3.1.7.2 Poland Network Slicing Market Estimates and Forecasts, By Component (2020-2032) (USD Billion)

11.3.1.7.3 Poland Network Slicing Market Estimates and Forecasts, By Enterprise Type (2020-2032) (USD Billion)

11.3.1.7.4 Poland Network Slicing Market Estimates and Forecasts,  By End-User(2020-2032) (USD Billion)

11.3.1.8 Romania

11.3.1.8.1 Romania Network Slicing Market Estimates and Forecasts, By Industry Vertical (2020-2032) (USD Billion)

11.3.1.8.2 Romania Network Slicing Market Estimates and Forecasts, By Component (2020-2032) (USD Billion)

11.3.1.8.3 Romania Network Slicing Market Estimates and Forecasts, By Enterprise Type (2020-2032) (USD Billion)

11.3.1.8.4 Romania Network Slicing Market Estimates and Forecasts,  By End-User (2020-2032) (USD Billion)

11.3.1.9 Hungary

11.3.1.9.1 Hungary Network Slicing Market Estimates and Forecasts, By Industry Vertical (2020-2032) (USD Billion)

11.3.1.9.2 Hungary Network Slicing Market Estimates and Forecasts, By Component (2020-2032) (USD Billion)

11.3.1.9.3 Hungary Network Slicing Market Estimates and Forecasts, By Enterprise Type (2020-2032) (USD Billion)

11.3.1.9.4 Hungary Network Slicing Market Estimates and Forecasts,  By End-User  (2020-2032) (USD Billion)

11.3.1.10 Turkey

11.3.1.10.1 Turkey Network Slicing Market Estimates and Forecasts, By Industry Vertical (2020-2032) (USD Billion)

11.3.1.10.2 Turkey Network Slicing Market Estimates and Forecasts, By Component (2020-2032) (USD Billion)

11.3.1.10.3 Turkey Network Slicing Market Estimates and Forecasts, By Enterprise Type (2020-2032) (USD Billion)

11.3.1.10.4 Turkey Network Slicing Market Estimates and Forecasts,  By End-User (2020-2032) (USD Billion)

11.3.1.11 Rest of Eastern Europe

11.3.1.11.1 Rest of Eastern Europe Network Slicing Market Estimates and Forecasts, By Industry Vertical (2020-2032) (USD Billion)

11.3.1.11.2 Rest of Eastern Europe Network Slicing Market Estimates and Forecasts, By Component (2020-2032) (USD Billion)

11.3.1.11.3 Rest of Eastern Europe Network Slicing Market Estimates and Forecasts, By Enterprise Type (2020-2032) (USD Billion)

11.3.1.11.4 Rest of Eastern Europe Network Slicing Market Estimates and Forecasts,  By End-User (2020-2032) (USD Billion)

11.3.2 Western Europe

11.3.2.1 Trends Analysis

11.3.2.2 Western Europe Network Slicing Market Estimates and Forecasts, by Country (2020-2032) (USD Billion)

11.3.2.3 Western Europe Network Slicing Market Estimates and Forecasts, By Industry Vertical (2020-2032) (USD Billion) 

11.3.2.4 Western Europe Network Slicing Market Estimates and Forecasts, By Component (2020-2032) (USD Billion)

11.3.2.5 Western Europe Network Slicing Market Estimates and Forecasts, By Enterprise Type (2020-2032) (USD Billion)

11.3.2.6 Western Europe Network Slicing Market Estimates and Forecasts,  By End-User (2020-2032) (USD Billion)

11.3.2.7 Germany

11.3.2.7.1 Germany Network Slicing Market Estimates and Forecasts, By Industry Vertical (2020-2032) (USD Billion)

11.3.2.7.2 Germany Network Slicing Market Estimates and Forecasts, By Component (2020-2032) (USD Billion)

11.3.2.7.3 Germany Network Slicing Market Estimates and Forecasts, By Enterprise Type (2020-2032) (USD Billion)

11.3.2.7.4 Germany Network Slicing Market Estimates and Forecasts,  By End-User (2020-2032) (USD Billion)

11.3.2.8 France

11.3.2.8.1 France Network Slicing Market Estimates and Forecasts, By Industry Vertical (2020-2032) (USD Billion)

11.3.2.8.2 France Network Slicing Market Estimates and Forecasts, By Component (2020-2032) (USD Billion)

11.3.2.8.3 France Network Slicing Market Estimates and Forecasts, By Enterprise Type (2020-2032) (USD Billion)

11.3.2.8.4 France Network Slicing Market Estimates and Forecasts,  By End-User (2020-2032) (USD Billion)

11.3.2.9 UK

11.3.2.9.1 UK Network Slicing Market Estimates and Forecasts, By Industry Vertical (2020-2032) (USD Billion)

11.3.2.9.2 UK Network Slicing Market Estimates and Forecasts, By Component (2020-2032) (USD Billion)

11.3.2.9.3 UK Network Slicing Market Estimates and Forecasts, By Enterprise Type (2020-2032) (USD Billion)

11.3.2.9.4 UK Network Slicing Market Estimates and Forecasts,  By End-User (2020-2032) (USD Billion)

11.3.2.10 Italy

11.3.2.10.1 Italy Network Slicing Market Estimates and Forecasts, By Industry Vertical (2020-2032) (USD Billion)

11.3.2.10.2 Italy Network Slicing Market Estimates and Forecasts, By Component (2020-2032) (USD Billion)

11.3.2.10.3 Italy Network Slicing Market Estimates and Forecasts, By Enterprise Type (2020-2032) (USD Billion)

11.3.2.10.4 Italy Network Slicing Market Estimates and Forecasts,  By End-User (2020-2032) (USD Billion)

11.3.2.11 Spain

11.3.2.11.1 Spain Network Slicing Market Estimates and Forecasts, By Industry Vertical (2020-2032) (USD Billion)

11.3.2.11.2 Spain Network Slicing Market Estimates and Forecasts, By Component (2020-2032) (USD Billion)

11.3.2.11.3 Spain Network Slicing Market Estimates and Forecasts, By Enterprise Type (2020-2032) (USD Billion)

11.3.2.11.4 Spain Network Slicing Market Estimates and Forecasts,  By End-User (2020-2032) (USD Billion)

11.3.2.12 Netherlands

11.3.2.12.1 Netherlands Network Slicing Market Estimates and Forecasts, By Industry Vertical (2020-2032) (USD Billion)

11.3.2.12.2 Netherlands Network Slicing Market Estimates and Forecasts, By Component (2020-2032) (USD Billion)

11.3.2.12.3 Netherlands Network Slicing Market Estimates and Forecasts, By Enterprise Type (2020-2032) (USD Billion)

11.3.2.12.4 Netherlands Network Slicing Market Estimates and Forecasts,  By End-User (2020-2032) (USD Billion)

11.3.2.13 Switzerland

11.3.2.13.1 Switzerland Network Slicing Market Estimates and Forecasts, By Industry Vertical (2020-2032) (USD Billion)

11.3.2.13.2 Switzerland Network Slicing Market Estimates and Forecasts, By Component (2020-2032) (USD Billion)

11.3.2.13.3 Switzerland Network Slicing Market Estimates and Forecasts, By Enterprise Type (2020-2032) (USD Billion)

11.3.2.13.4 Switzerland Network Slicing Market Estimates and Forecasts,  By End-User (2020-2032) (USD Billion)

11.3.2.14 Austria

11.3.2.14.1 Austria Network Slicing Market Estimates and Forecasts, By Industry Vertical (2020-2032) (USD Billion)

11.3.2.14.2 Austria Network Slicing Market Estimates and Forecasts, By Component (2020-2032) (USD Billion)

11.3.2.14.3 Austria Network Slicing Market Estimates and Forecasts, By Enterprise Type (2020-2032) (USD Billion)

11.3.2.14.4 Austria Network Slicing Market Estimates and Forecasts,  By End-User (2020-2032) (USD Billion)

11.3.2.15 Rest of Western Europe

11.3.2.15.1 Rest of Western Europe Network Slicing Market Estimates and Forecasts, By Industry Vertical (2020-2032) (USD Billion)

11.3.2.15.2 Rest of Western Europe Network Slicing Market Estimates and Forecasts, By Component (2020-2032) (USD Billion)

11.3.2.15.3 Rest of Western Europe Network Slicing Market Estimates and Forecasts, By Enterprise Type (2020-2032) (USD Billion)

11.3.2.15.4 Rest of Western Europe Network Slicing Market Estimates and Forecasts,  By End-User (2020-2032) (USD Billion)

11.4 Asia Pacific

11.4.1 Trends Analysis

11.4.2 Asia Pacific Network Slicing Market Estimates and Forecasts, by Country (2020-2032) (USD Billion)

11.4.3 Asia Pacific Network Slicing Market Estimates and Forecasts, By Industry Vertical (2020-2032) (USD Billion) 

11.4.4 Asia Pacific Network Slicing Market Estimates and Forecasts, By Component (2020-2032) (USD Billion)

11.4.5 Asia Pacific Network Slicing Market Estimates and Forecasts, By Enterprise Type (2020-2032) (USD Billion)

11.4.6 Asia Pacific Network Slicing Market Estimates and Forecasts,  By End-User (2020-2032) (USD Billion)

11.4.7 China

11.4.7.1 China Network Slicing Market Estimates and Forecasts, By Industry Vertical (2020-2032) (USD Billion)

11.4.7.2 China Network Slicing Market Estimates and Forecasts, By Component (2020-2032) (USD Billion)

11.4.7.3 China Network Slicing Market Estimates and Forecasts, By Enterprise Type (2020-2032) (USD Billion)

11.4.7.4 China Network Slicing Market Estimates and Forecasts,  By End-User (2020-2032) (USD Billion)

11.4.8 India

11.4.8.1 India Network Slicing Market Estimates and Forecasts, By Industry Vertical (2020-2032) (USD Billion)

11.4.8.2 India Network Slicing Market Estimates and Forecasts, By Component (2020-2032) (USD Billion)

11.4.8.3 India Network Slicing Market Estimates and Forecasts, By Enterprise Type (2020-2032) (USD Billion)

11.4.8.4 India Network Slicing Market Estimates and Forecasts,  By End-User (2020-2032) (USD Billion)

11.4.9 Japan

11.4.9.1 Japan Network Slicing Market Estimates and Forecasts, By Industry Vertical (2020-2032) (USD Billion)

11.4.9.2 Japan Network Slicing Market Estimates and Forecasts, By Component (2020-2032) (USD Billion)

11.4.9.3 Japan Network Slicing Market Estimates and Forecasts, By Enterprise Type (2020-2032) (USD Billion)

11.4.9.4 Japan Network Slicing Market Estimates and Forecasts,  By End-User (2020-2032) (USD Billion)

11.4.10 South Korea

11.4.10.1 South Korea Network Slicing Market Estimates and Forecasts, By Industry Vertical (2020-2032) (USD Billion)

11.4.10.2 South Korea Network Slicing Market Estimates and Forecasts, By Component (2020-2032) (USD Billion)

11.4.10.3 South Korea Network Slicing Market Estimates and Forecasts, By Enterprise Type (2020-2032) (USD Billion)

11.4.10.4 South Korea Network Slicing Market Estimates and Forecasts,  By End-User (2020-2032) (USD Billion)

11.4.11 Vietnam

11.4.11.1 Vietnam Network Slicing Market Estimates and Forecasts, By Industry Vertical (2020-2032) (USD Billion)

11.4.11.2 Vietnam Network Slicing Market Estimates and Forecasts, By Component (2020-2032) (USD Billion)

11.4.11.3 Vietnam Network Slicing Market Estimates and Forecasts, By Enterprise Type (2020-2032) (USD Billion)

11.4.11.4 Vietnam Network Slicing Market Estimates and Forecasts,  By End-User (2020-2032) (USD Billion)

11.4.12 Singapore

11.4.12.1 Singapore Network Slicing Market Estimates and Forecasts, By Industry Vertical (2020-2032) (USD Billion)

11.4.12.2 Singapore Network Slicing Market Estimates and Forecasts, By Component (2020-2032) (USD Billion)

11.4.12.3 Singapore Network Slicing Market Estimates and Forecasts, By Enterprise Type (2020-2032) (USD Billion)

11.4.12.4 Singapore Network Slicing Market Estimates and Forecasts,  By End-User (2020-2032) (USD Billion)

11.4.13 Australia

11.4.13.1 Australia Network Slicing Market Estimates and Forecasts, By Industry Vertical (2020-2032) (USD Billion)

11.4.13.2 Australia Network Slicing Market Estimates and Forecasts, By Component (2020-2032) (USD Billion)

11.4.13.3 Australia Network Slicing Market Estimates and Forecasts, By Enterprise Type (2020-2032) (USD Billion)

11.4.13.4 Australia Network Slicing Market Estimates and Forecasts,  By End-User (2020-2032) (USD Billion)

11.4.14 Rest of Asia Pacific

11.4.14.1 Rest of Asia Pacific Network Slicing Market Estimates and Forecasts, By Industry Vertical (2020-2032) (USD Billion)

11.4.14.2 Rest of Asia Pacific Network Slicing Market Estimates and Forecasts, By Component (2020-2032) (USD Billion)

11.4.14.3 Rest of Asia Pacific Network Slicing Market Estimates and Forecasts, By Enterprise Type (2020-2032) (USD Billion)

11.4.14.4 Rest of Asia Pacific Network Slicing Market Estimates and Forecasts,  By End-User (2020-2032) (USD Billion)

11.5 Middle East and Africa

11.5.1 Middle East

11.5.1.1 Trends Analysis

11.5.1.2 Middle East Network Slicing Market Estimates and Forecasts, by Country (2020-2032) (USD Billion)

11.5.1.3 Middle East Network Slicing Market Estimates and Forecasts, By Industry Vertical (2020-2032) (USD Billion) 

11.5.1.4 Middle East Network Slicing Market Estimates and Forecasts, By Component (2020-2032) (USD Billion)

11.5.1.5 Middle East Network Slicing Market Estimates and Forecasts, By Enterprise Type (2020-2032) (USD Billion)

11.5.1.6 Middle East Network Slicing Market Estimates and Forecasts,  By End-User (2020-2032) (USD Billion)

11.5.1.7 UAE

11.5.1.7.1 UAE Network Slicing Market Estimates and Forecasts, By Industry Vertical (2020-2032) (USD Billion)

11.5.1.7.2 UAE Network Slicing Market Estimates and Forecasts, By Component (2020-2032) (USD Billion)

11.5.1.7.3 UAE Network Slicing Market Estimates and Forecasts, By Enterprise Type (2020-2032) (USD Billion)

11.5.1.7.4 UAE Network Slicing Market Estimates and Forecasts,  By End-User (2020-2032) (USD Billion)

11.5.1.8 Egypt

11.5.1.8.1 Egypt Network Slicing Market Estimates and Forecasts, By Industry Vertical (2020-2032) (USD Billion)

11.5.1.8.2 Egypt Network Slicing Market Estimates and Forecasts, By Component (2020-2032) (USD Billion)

11.5.1.8.3 Egypt Network Slicing Market Estimates and Forecasts, By Enterprise Type (2020-2032) (USD Billion)

11.5.1.8.4 Egypt Network Slicing Market Estimates and Forecasts,  By End-User (2020-2032) (USD Billion)

11.5.1.9 Saudi Arabia

11.5.1.9.1 Saudi Arabia Network Slicing Market Estimates and Forecasts, By Industry Vertical (2020-2032) (USD Billion)

11.5.1.9.2 Saudi Arabia Network Slicing Market Estimates and Forecasts, By Component (2020-2032) (USD Billion)

11.5.1.9.3 Saudi Arabia Network Slicing Market Estimates and Forecasts, By Enterprise Type (2020-2032) (USD Billion)

11.5.1.9.4 Saudi Arabia Network Slicing Market Estimates and Forecasts,  By End-User (2020-2032) (USD Billion)

11.5.1.10 Qatar

11.5.1.10.1 Qatar Network Slicing Market Estimates and Forecasts, By Industry Vertical (2020-2032) (USD Billion)

11.5.1.10.2 Qatar Network Slicing Market Estimates and Forecasts, By Component (2020-2032) (USD Billion)

11.5.1.10.3 Qatar Network Slicing Market Estimates and Forecasts, By Enterprise Type (2020-2032) (USD Billion)

11.5.1.10.4 Qatar Network Slicing Market Estimates and Forecasts,  By End-User (2020-2032) (USD Billion)

11.5.1.11 Rest of Middle East

11.5.1.11.1 Rest of Middle East Network Slicing Market Estimates and Forecasts, By Industry Vertical (2020-2032) (USD Billion)

11.5.1.11.2 Rest of Middle East Network Slicing Market Estimates and Forecasts, By Component (2020-2032) (USD Billion)

11.5.1.11.3 Rest of Middle East Network Slicing Market Estimates and Forecasts, By Enterprise Type (2020-2032) (USD Billion)

11.5.1.11.4 Rest of Middle East Network Slicing Market Estimates and Forecasts,  By End-User (2020-2032) (USD Billion)

11.5.2 Africa

11.5.2.1 Trends Analysis

11.5.2.2 Africa Network Slicing Market Estimates and Forecasts, by Country (2020-2032) (USD Billion)

11.5.2.3 Africa Network Slicing Market Estimates and Forecasts, By Industry Vertical (2020-2032) (USD Billion) 

11.5.2.4 Africa Network Slicing Market Estimates and Forecasts, By Component (2020-2032) (USD Billion)

11.5.2.5 Africa Network Slicing Market Estimates and Forecasts, By Enterprise Type (2020-2032) (USD Billion)

11.5.2.6 Africa Network Slicing Market Estimates and Forecasts,  By End-User (2020-2032) (USD Billion)

11.5.2.7 South Africa

11.5.2.7.1 South Africa Network Slicing Market Estimates and Forecasts, By Industry Vertical (2020-2032) (USD Billion)

11.5.2.7.2 South Africa Network Slicing Market Estimates and Forecasts, By Component (2020-2032) (USD Billion)

11.5.2.7.3 South Africa Network Slicing Market Estimates and Forecasts, By Enterprise Type (2020-2032) (USD Billion)

11.5.2.7.4 South Africa Network Slicing Market Estimates and Forecasts,  By End-User (2020-2032) (USD Billion)

11.5.2.8 Nigeria

11.5.2.8.1 Nigeria Network Slicing Market Estimates and Forecasts, By Industry Vertical (2020-2032) (USD Billion)

11.5.2.8.2 Nigeria Network Slicing Market Estimates and Forecasts, By Component (2020-2032) (USD Billion)

11.5.2.8.3 Nigeria Network Slicing Market Estimates and Forecasts, By Enterprise Type (2020-2032) (USD Billion)

11.5.2.8.4 Nigeria Network Slicing Market Estimates and Forecasts,  By End-User (2020-2032) (USD Billion)

11.5.2.9 Rest of Africa

11.5.2.9.1 Rest of Africa Network Slicing Market Estimates and Forecasts, By Industry Vertical (2020-2032) (USD Billion)

11.5.2.9.2 Rest of Africa Network Slicing Market Estimates and Forecasts, By Component (2020-2032) (USD Billion)

11.5.2.9.3 Rest of Africa Network Slicing Market Estimates and Forecasts, By Enterprise Type (2020-2032) (USD Billion)

11.5.2.9.4 Rest of Africa Network Slicing Market Estimates and Forecasts,  By End-User (2020-2032) (USD Billion)

11.6 Latin America

11.6.1 Trends Analysis

11.6.2 Latin America Network Slicing Market Estimates and Forecasts, by Country (2020-2032) (USD Billion)

11.6.3 Latin America Network Slicing Market Estimates and Forecasts, By Industry Vertical (2020-2032) (USD Billion) 

11.6.4 Latin America Network Slicing Market Estimates and Forecasts, By Component (2020-2032) (USD Billion)

11.6.5 Latin America Network Slicing Market Estimates and Forecasts, By Enterprise Type (2020-2032) (USD Billion)

11.6.6 Latin America Network Slicing Market Estimates and Forecasts,  By End-User (2020-2032) (USD Billion)

11.6.7 Brazil

11.6.7.1 Brazil Network Slicing Market Estimates and Forecasts, By Industry Vertical (2020-2032) (USD Billion)

11.6.7.2 Brazil Network Slicing Market Estimates and Forecasts, By Component (2020-2032) (USD Billion)

11.6.7.3 Brazil Network Slicing Market Estimates and Forecasts, By Enterprise Type (2020-2032) (USD Billion)

11.6.7.4 Brazil Network Slicing Market Estimates and Forecasts,  By End-User (2020-2032) (USD Billion)

11.6.8 Argentina

11.6.8.1 Argentina Network Slicing Market Estimates and Forecasts, By Industry Vertical (2020-2032) (USD Billion)

11.6.8.2 Argentina Network Slicing Market Estimates and Forecasts, By Component (2020-2032) (USD Billion)

11.6.8.3 Argentina Network Slicing Market Estimates and Forecasts, By Enterprise Type (2020-2032) (USD Billion)

11.6.8.4 Argentina Network Slicing Market Estimates and Forecasts,  By End-User (2020-2032) (USD Billion)

11.6.9 Colombia

11.6.9.1 Colombia Network Slicing Market Estimates and Forecasts, By Industry Vertical (2020-2032) (USD Billion)

11.6.9.2 Colombia Network Slicing Market Estimates and Forecasts, By Component (2020-2032) (USD Billion)

11.6.9.3 Colombia Network Slicing Market Estimates and Forecasts, By Enterprise Type (2020-2032) (USD Billion)

11.6.9.4 Colombia Network Slicing Market Estimates and Forecasts,  By End-User (2020-2032) (USD Billion)

11.6.10 Rest of Latin America

11.6.10.1 Rest of Latin America Network Slicing Market Estimates and Forecasts, By Industry Vertical (2020-2032) (USD Billion)

11.6.10.2 Rest of Latin America Network Slicing Market Estimates and Forecasts, By Component (2020-2032) (USD Billion)

11.6.10.3 Rest of Latin America Network Slicing Market Estimates and Forecasts, By Enterprise Type (2020-2032) (USD Billion)

11.6.10.4 Rest of Latin America Network Slicing Market Estimates and Forecasts,  By End-User (2020-2032) (USD Billion)

12. Company Profiles

12.1 Ericsson

12.1.1 Company Overview

12.1.2 Financial

12.1.3 Products/ Services Offered

12.1.4 SWOT Analysis

12.2 Samsung

12.2.1 Company Overview

12.2.2 Financial

12.2.3 Products/ Services Offered

12.2.4 SWOT Analysis

12.3 Nokia Corporation

12.3.1 Company Overview

12.3.2 Financial

12.3.3 Products/ Services Offered

12.3.4 SWOT Analysis

12.4 Huawei Technologies

12.4.1 Company Overview

12.4.2 Financial

12.4.3 Products/ Services Offered

12.4.4 SWOT Analysis

12.5 ZTE Corporation

12.5.1 Company Overview

12.5.2 Financial

12.5.3 Products/ Services Offered

12.5.4 SWOT Analysis

12.6 Cisco Systems Inc.

12.6.1 Company Overview

12.6.2 Financial

12.6.3 Products/ Services Offered

12.6.4 SWOT Analysis

12.7 HPE (Hewlett Packard Enterprise)

12.7.1 Company Overview

12.7.2 Financial

12.7.3 Products/ Services Offered

12.7.4 SWOT Analysis

12.8 Mavenir Systems Inc.

12.8.1 Company Overview

12.8.2 Financial

12.8.3 Products/ Services Offered

12.8.4 SWOT Analysis

12.9 VMware

12.9.1 Company Overview

12.9.2 Financial

12.9.3 Products/ Services Offered

12.9.4 SWOT Analysis

12.10 Affirmed Networks

12.10.1 Company Overview

12.10.2 Financial

12.10.3 Products/ Services Offered

12.10.4 SWOT Analysis

13. Use Cases and Best Practices

14. Conclusion

An accurate research report requires proper strategizing as well as implementation. There are multiple factors involved in the completion of good and accurate research report and selecting the best methodology to compete the research is the toughest part. Since the research reports we provide play a crucial role in any company’s decision-making process, therefore we at SNS Insider always believe that we should choose the best method which gives us results closer to reality. This allows us to reach at a stage wherein we can provide our clients best and accurate investment to output ratio.

Each report that we prepare takes a timeframe of 350-400 business hours for production. Starting from the selection of titles through a couple of in-depth brain storming session to the final QC process before uploading our titles on our website we dedicate around 350 working hours. The titles are selected based on their current market cap and the foreseen CAGR and growth.


The 5 steps process:

Step 1: Secondary Research:

Secondary Research or Desk Research is as the name suggests is a research process wherein, we collect data through the readily available information. In this process we use various paid and unpaid databases which our team has access to and gather data through the same. This includes examining of listed companies’ annual reports, Journals, SEC filling etc. Apart from this our team has access to various associations across the globe across different industries. Lastly, we have exchange relationships with various university as well as individual libraries.

Secondary Research

Step 2: Primary Research

When we talk about primary research, it is a type of study in which the researchers collect relevant data samples directly, rather than relying on previously collected data.  This type of research is focused on gaining content specific facts that can be sued to solve specific problems. Since the collected data is fresh and first hand therefore it makes the study more accurate and genuine.

We at SNS Insider have divided Primary Research into 2 parts.

Part 1 wherein we interview the KOLs of major players as well as the upcoming ones across various geographic regions. This allows us to have their view over the market scenario and acts as an important tool to come closer to the accurate market numbers. As many as 45 paid and unpaid primary interviews are taken from both the demand and supply side of the industry to make sure we land at an accurate judgement and analysis of the market.

This step involves the triangulation of data wherein our team analyses the interview transcripts, online survey responses and observation of on filed participants. The below mentioned chart should give a better understanding of the part 1 of the primary interview.

Primary Research

Part 2: In this part of primary research the data collected via secondary research and the part 1 of the primary research is validated with the interviews from individual consultants and subject matter experts.

Consultants are those set of people who have at least 12 years of experience and expertise within the industry whereas Subject Matter Experts are those with at least 15 years of experience behind their back within the same space. The data with the help of two main processes i.e., FGDs (Focused Group Discussions) and IDs (Individual Discussions). This gives us a 3rd party nonbiased primary view of the market scenario making it a more dependable one while collation of the data pointers.

Step 3: Data Bank Validation

Once all the information is collected via primary and secondary sources, we run that information for data validation. At our intelligence centre our research heads track a lot of information related to the market which includes the quarterly reports, the daily stock prices, and other relevant information. Our data bank server gets updated every fortnight and that is how the information which we collected using our primary and secondary information is revalidated in real time.

Data Bank Validation

Step 4: QA/QC Process

After all the data collection and validation our team does a final level of quality check and quality assurance to get rid of any unwanted or undesired mistakes. This might include but not limited to getting rid of the any typos, duplication of numbers or missing of any important information. The people involved in this process include technical content writers, research heads and graphics people. Once this process is completed the title gets uploader on our platform for our clients to read it.

Step 5: Final QC/QA Process:

This is the last process and comes when the client has ordered the study. In this process a final QA/QC is done before the study is emailed to the client. Since we believe in giving our clients a good experience of our research studies, therefore, to make sure that we do not lack at our end in any way humanly possible we do a final round of quality check and then dispatch the study to the client.

Key Segments:

By Component

  • Solution
  • Services

By Enterprise Type

  • Large Enterprises
  • Small & Medium Enterprises

By End-User

  • Communication Service Providers
  • Enterprises

By Industry Vertical

  • Manufacturing
  • Healthcare
  • Fast-Moving Consumer Goods
  • Retail
  • E-commerce
  • Automotive
  • Others

Network-Slicing-Market-trend-By-Industry-Vertical

Request for Segment Customization as per your Business Requirement: Segment Customization Request

Regional Coverage:

North America

  • US
  • Canada
  • Mexico

Europe

  • Eastern Europe
    • Poland
    • Romania
    • Hungary
    • Turkey
    • Rest of Eastern Europe
  • Western Europe
    • Germany
    • France
    • UK
    • Italy
    • Spain
    • Netherlands
    • Switzerland
    • Austria
    • Rest of Western Europe

Asia Pacific

  • China
  • India
  • Japan
  • South Korea
  • Vietnam
  • Singapore
  • Australia
  • Rest of Asia Pacific

Middle East & Africa

  • Middle East
    • UAE
    • Egypt
    • Saudi Arabia
    • Qatar
    • Rest of the Middle East
  • Africa
    • Nigeria
    • South Africa
    • Rest of Africa

Latin America

  • Brazil
  • Argentina
  • Colombia
  • Rest of Latin America

Request for Country Level Research Report: Country Level Customization Request

Available Customization

With the given market data, SNS Insider offers customization as per the company’s specific needs. The following customization options are available for the report:

  • Detailed Volume Analysis

  • Criss-Cross segment analysis (e.g. Product X Application)

  • Competitive Product Benchmarking

  • Geographic Analysis

  • Additional countries in any of the regions

  • Customized Data Representation

  • Detailed analysis and profiling of additional market players


  •            5000 (33% Discount)


  •            8950 (40% Discount)


  •            3050 (23% Discount)

Start a Conversation

Hi! Click one of our member below to chat on Phone