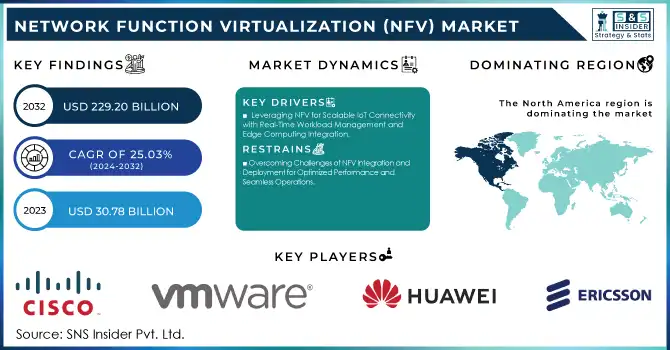
The Network Function Virtualization (NFV) Market Size was valued at USD 30.78 Billion in 2023 and is expected to reach USD 229.20 Billion by 2032 and grow at a CAGR of 25.03% over the forecast period 2024-2032.
Get More Information on Network Function Virtualization (NFV) Market - Request Sample Report
The Network Function Virtualization (NFV) market is growing at an impressive pace in the light of rising demand for scalable, flexible, and cost-efficient network solutions. Hardware-based network infrastructures are being supplanted with network functions that are virtualized and that use software to perform tasks, like routing, firewalling, and load balancing. The increasing adoption of 5G is changing this dynamic, as 5G deployments need network architectures that can provide high levels of dynamism and agility to meet the demand for low latency at high speeds. Enterprises and service providers also have been quickly adopting NFV to lower CapEx and OpEx by transferring hundreds of thousands of individual dedicated appliances to common hardware, further ensuring economies of scale while improving resource utilization. In essence, 2024 marks that over 50% of enterprises use NFV while global communication service providers (CSPs) have NFV deployed in their networks at an 80% level. By the end of 2023, worldwide 5G coverage will reach over 55% and there will be 2.5 billion 5G connections globally. It is also predicted that NFV deployments can reduce OpEx by up to 30% and CapEx by up to 40%. And even more than 60% of core network functions have become fully virtualized, including routing, firewalling, and load balancing. These numbers reflect the integrated NFV and 5G adoption boost in cost savings and efficiency across the world.
The rising demand for better network automation and orchestration is the other big factor that helps grow the NFV market. As contemporary networking solutions become more intricate, organizations are increasingly adopting automation to support expeditious service provisioning, reduce human effort, and bolster network robustness. At the same time, the growth of cloud computing and edge technologies have also fueled NFV adoption by allowing seamless integration of virtualized solutions with such architectures and supporting distribution workloads. Additionally, the most stringent echelon of regulatory compliance and a high concern rate for cybersecurity are driving organizations to deploy NFV solutions that possess rich security capabilities with simplified ensconcing. All of these things combined are sending the NFV market to the moon. As of 2024, more than 90% of 500+ employee businesses have migrated at least 50% of their operations to the cloud, promoting greater NFV adoption. Besides, 80% of operators in big enterprises are deploying network automation technologies to continue enhancing NFV deployments with 75% of enterprises stressing security functionality in their NFV solutions driven by escalating cybersecurity threats.
KEY DRIVERS:
Increased demand for IoT connectivity is one of the major factors that drive the growth of the network Function Virtualization (NFV) market. The explosion of IoT devices in sectors such as health care, manufacturing, and transportation has necessitated a flexible and scalable network capable of supporting varied, high-volume data traffic. NFV offers a deploy and manage configurable powerful VNFs that can be designed to meet the ever-changing requirement scenarios of IoT ecosystems. NFV unlike legacy networks enables service providers to adjust to changing workloads in real-time, providing reliable connectivity and low latency from specific IoT applications. Moreover, NFV can provide support for edge computing, allowing for closer processing of data near the devices, which is vital for time-sensitive applications such as autonomous vehicles, smart factories, and monitoring systems with remote data entry. NFV helps to expand the market with its ability to scale up or down efficiently and with the expansion of connected devices in IoT. By 2024, more than 70% of enterprises in the healthcare, manufacturing, and transportation industries will be utilizing IoT-based solutions to improve operational efficiency. Edge computing will be the backbone for data processing of nearly 45% of IoT devices, as the latency for time-sensitive applications needs to be low. Furthermore, more than 60% of telecom providers are adopting NFV solutions to configure NFV possibilities in reaction to the blossoming data driven by IoT gadgets, permitting workload realignment on-demand that makes the community noticeably agile.
Increased adoption of open and interoperable solutions is also impacting the NFV market in a positive manner. As the old dependence on vendor-specific hardware and software recedes, service providers and enterprises are also adopting open standards, leading to more vendor-agnostic solutions. NFV allows organizations to easily interoperate network components from different vendors, providing more flexibility, lower costs, and a path to faster innovation. Open-source frameworks like OpenStack and ONAP (Open Network Automation Platform) also quicken the pace of NFV solution delivery. Such frameworks leverage VNFs that are interoperable, allowing businesses to pick solutions adapted to their constraints, free of any vendor lock-in. Such a trend has become especially important in the telecommunications industry, where service providers are using NFV to cut the time required to deliver new services, reduce the loss of customer base, and increase customer satisfaction. Hence, the call for transparency and open interfaces has contributed to NFV deployment in various industries. OpenStack deployments now exceed 45 million compute cores and 81% of these are running recent releases in 2024. With over 80 organizations today, the ETSI NFV community continues to be the stalwart of open standards. Open NFV Solutions at the Core, 65% of the Telecom Providers make use of an open, interoperable NFV solution to overcome NFV vendor lock-in and reduce service delivery time. More than 50% of global telecom operators are using ONAP for automation to simplify service deployment and to provide agility in networks.
RESTRAIN:
Ease of Integration and Deployment Network Function Virtualization (NFV) and its operational concepts are based on complex, sophisticated technologies. Unlike SDN, which can be implemented over existing network architectures, NFV involves extensive transformation of traditional network architectures and legacy systems to transfer them into virtualized environments. Stream Latency: It can entail re-architecting mature infrastructure or performing glue work to connect hardware and software components along with interoperability problems among multi-vendor solutions. These complications can delay deployment and hinder smooth operation, especially for organizations that lack sufficient technical know-how. A further significant constraint is the fear of performance and reliability in NFV environments. Though such solution is virtualized, they still suffer from high latency, packet loss, or degraded service quality when workloads are high. Maintaining optimal performance for the handful of truly critical enterprise applications especially in telecommunications and finance sectors typically involves time-consuming and complicated work monitoring and adjusting those resources.
BY COMPONENT
Solutions had the largest share of the market in Network Function Virtualization (NFV) in 2023, accounting for 61.6%, and are also expected to witness the fastest Compound Annual Growth Rate (CAGR) from 2024 to 2032. Solutions play such an essential role in helping enterprises and service providers move away from hardware-based network functions into a virtualized world, and that has led to this leadership. Virtual firewall, router, and load balancer solutions have become an integral part of modern-day network infrastructures within the cloud environment – offering increased flexibility, scalability, and efficiency. With their efficiency in resource handling, easy network management, and fast deployment, they have become an obvious choice for enterprises aiming to virtualize their infrastructure. Moreover, the rapid rollout of 5G, cloud, and edge computing has augmented the need for NFV-based solutions. The 5G COTS is necessary to support the diverse need to meet the challenging requirements of 5G networks, namely ultra-low latency, high-speed connectivity, and millions of IoT devices. Cloud-native architectures. The solutions also ensure seamless integration with cloud-native architectures which allow enterprises to process and manage data closer to the edge. Another reason behind the growing adoption of NFV is the emphasis on automation and orchestration solutions that not only help deploy VNFs but also come with various advanced tools to automate the provisioning and monitoring of the network and provide a dashboard for real-time management of VNF.
BY VIRTUALIZED NETWORK FUNCTIONS
In 2023, computing took the largest portion of the NFV market share (38.6%), as this technology is essential to host virtualized network functions (VNFs). Compute resources are the crux of the NFV architecture, providing the underlying computation that executes the VNFs that support a variety of network functions, such as firewall, load balancer, and routing protocols. Compute workloads are increasingly being adopted with virtualized environments and cloud-based services spurring the need for high performance, scalability, and flexibility. Compute infrastructure, especially fueled by new-generation processors, GPUs, and virtualization technologies, makes sure that resource-intensive network functions are up and running without a hitch, it remains a key component of any NFV deployment.
The network segment is slated to experience the highest CAGR growth Over the forecast period from 2024 to 2032, spurred by the growing interest surrounding 5G and edge computing. With the advanced use cases such as autonomous vehicles, IoT, and real-time applications, we need dynamic and flexible connectivity it is here where network virtualization plays an important role. The growing adoption of Software-Defined Networking (SDN) and the provisioning of virtualized networks over a technology called network slicing (for example, in 5G environments) have quickly increased the need for more dynamic ways to provide and consume virtualized network resources. They allow Network Functions Virtualization (NFV) service providers to adapt and configure network resources in real-time, accommodating diverse workloads while minimizing latency. In addition, the advent of edge computing, where data processing occurs closer to end users, has created a demand on the need for solid and scalable virtualized network infrastructures as well. Fueled by this trend, the network segment is well-positioned for the growth in the upcoming years.
BY APPLICATION
In 2023, Virtual Appliances held 56.4% of the NFV market share, owing to their higher adoption globally across various industries for minimizing hardware dependencies and simplifying network operations. Virtual appliances include virtual firewalls, routers, and load balancers and come pre-packaged and ready to deploy, enabling enterprises to deploy virtualized network functions (VNFs) rapidly and efficiently. Owing to their plug-and-play type and ability to with existing infrastructure networks, they are the preferred choice for enterprises and service providers. In addition, virtual appliances are extremely flexible and scalable; instead of deploying a less expensive appliance to support current network demand and later having to purchase expensive plug-in cards or new ones to meet growing network needs, you can simply upgrade the virtual appliance. This not only utilizes network elements effectively and boosts cost savings but also makes an ideal backbone of NFV deployment where multiple network functions are supported on the same hardware.
The core network segment is anticipated to register the fastest growth during the forecast period from 2024 to 2032, owing to the growing roll-out of 5G networks and the increasing need for advanced connectivity. Core network virtualization allows service providers to deploy key network functions including packet routing, traffic management, and subscriber authentication in a more flexible and economical form. As 5G is rolling out, core networks are changing, offering capabilities such as network slicing that lets operators devote chunks of the network to specific use cases, for itself, IoT, autonomous vehicles, and ultra-low latency applications. The flexibility and 5G core network virtualization solutions must be very rich to comply with the complex requirements 5G and beyond have. Additionally, the rising focus on edge computing, cloud-native architecture, and real-time data processing is causing service providers to shift towards virtualized core networks which will accelerate the growth of this segment.
BY ORGANIZATION SIZE
Large enterprises represent 58.3% of the NFV market share for 2023, thus indicating a clear advantage for larger entities in implementing Network Function Virtualization (NFV). This is due in large part to the operational infrastructure, financial strength, and overall complexity. While large organizations may well be able to allocate the necessary budget and hire competent technical staff for implementing NFV solutions, this may not be the case for smaller businesses. On top of that, NFV also helps those companies optimize their operational costs and make their network more flexible than ever before, which usually puts a higher pressure on those companies. NFV allows large enterprises to virtualize network functions and abstract services from hardware, facilitating better resource pooling, and leading to higher scalability and operational agility across the enterprise on a global scale.
SMEs will achieve the highest growth rate (that is, CAGR) between 2024-2032, due to the increasing requirement for cost-effective, scalable, and flexible networking solutions. Small or medium enterprises (SMEs) have less budget to throw around compared to the big fishes which is exactly why they would be more readily adopting much more affordable offerings like NFV that can eliminate costly hardware and substitute them for hundreds of virtualized network functions. NFV is redefining the way SMEs can deploy incredible network performance without resigning to severe capital expenditures on dedicated physical assets. In addition, with various sectors focusing on digital transformation, the flexibility and agility offered by NFV enable SMEs to quickly respond to changing market dynamics and accelerate innovation. With maturation of NFV technologies and cost reduction on maintenance, SMEs pick them up more often to compete and lower their OPEX.
BY END USER
Service providers accounted for the largest market share during 2023 at 48.8%, as these companies possess specialized expertise and can provide proprietary cognitive assessment and training capabilities for a variety of clients. These service providers are usually more flexible and adaptable than in-house teams as they provide scalable and customizable solutions to cater to the specific requirements of any organization. With deep industry insight, these firms utilize cutting-edge technologies to deliver quality services, which include cloud solutions, training platforms, and analytics that enable superior learning outcomes. In addition to this, they tend to have access to a broader set of resources to provide the product. This will allow them to offer a full range of services covering multiple industry verticals and also be well-positioned to serve customers of varying different scales further empowering their dominant position in the market.
Enterprises will experience the fastest compound annual growth rate (CAGR) between 2024 and 2032. The change is largely due to growing awareness among companies about how valuable cognitive tests and cognitive training could be for internal development. Particularly larger enterprises are looking to leverage these tools internally to drive up skillsets, productivity, and improved decision-making. This led to growing investment in internal systems that allow organizations to better manage their own operations, in a way that is tailored to their specific business needs, sustainably, and at a lower cost. Moreover, growing digital transformation initiatives at enterprises are driving demand for sophisticated cognitive solutions that offer data-driven insights and customized training while minimizing third-party service provider dependency. This is expected to continue to influence the focus of the enterprise on employee performance and talent development leading to the faster adoption of the market and the anticipated growth of the market share of the enterprise in the coming years.
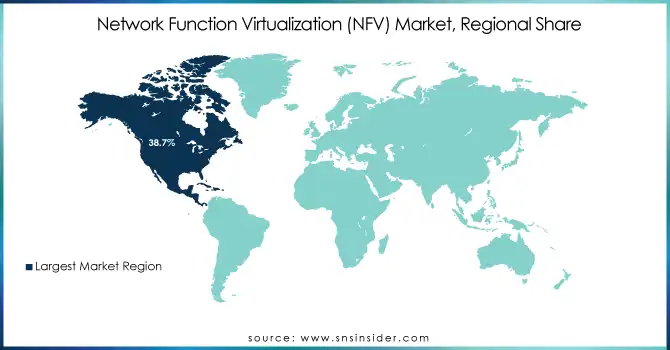
North America held the largest share of the cognitive assessment and training market in 2023, with a share of 38.7%, which can be attributed to the region's early adoption of technology, strong presence of technology companies, and strong infrastructure for digital transformation. Being home to some of the biggest global corporations, especially in sectors like technology, finance, and healthcare, North America is relatively high on performance and talent management. Example: Microsoft and IBM are examples of such businesses, they have been groundbreaking in creating cognitive assessment tools for use in attracting, hiring, and retaining talent, making use of AI-based learning solutions to enhance workforce productivity and personalized development programs. North America Higher Education, Research Innovation. A key component to North America's success is the presence of many universities and research institutions, such as Harvard University and Stanford University, leading the way in research into cognitive development and learning technology in one region, allowing us to take advantage of these innovations.
Asia Pacific is projected to have the highest CAGR in the cognitive assessment and training market between 2024 and 2032 due to widespread industrialization, digital transformation, and heavy investments in talent development within emerging economies. The rising middle class along with a growing pool of tech-savvy workforce in countries like China, India, and Japan is pushing cognitive solutions in the enterprise to become a top priority for organizations looking to upskill their employees and enhance productivity. For instance; Alibaba Group has initiated AI-powered training programs for employees in China to enhance productivity and performance. Equally, Tata Consultancy Services (TCS) is using cognitive training platforms in India, to strengthen employee and leadership capabilities in order to upskill its employees to compete in a global digital economy. With an increasing focus on education and training programs in the area.
Get Customized Report as per Your Business Requirement - Request For Customized Report
Some of the major players in the Network Function Virtualization (NFV) Market are:
Cisco Systems, Inc. (Cisco NFV Infrastructure, Cisco Virtualized Packet Core)
VMware, Inc. (vCloud NFV, vSphere)
Huawei Technologies Co., Ltd. (FusionSphere, CloudEPC)
Telefonaktiebolaget LM Ericsson (Ericsson NFV Infrastructure, Ericsson Cloud Core)
Nokia (CloudBand, AirFrame)
Hewlett Packard Enterprise Development LP (HPE NFV System, HPE Helion OpenStack)
Dell Inc. (Dell NFV Ready Bundle, Dell OpenStack Cloud)
Juniper Networks, Inc. (Contrail Cloud, Contrail Networking)
NEC Corporation (UNIVERGE NFV, NEC Cloud-Native Core)
Affirmed Networks (Mobile Content Cloud, Virtualized Evolved Packet Core)
Ribbon Communications Operating Company, Inc. (Ribbon Cloud-Native Core, Ribbon SBC)
ZTE Corporation (ZTE NFV Solution, ZTE Cloud Core)
Intel Corporation (Intel Network Builders, Intel Xeon Scalable Processors)
Oracle Corporation (Oracle Communications Cloud Native Core, Oracle OpenStack)
Fujitsu Limited (Fujitsu NFV Solution, Fujitsu Cloud Service)
Ciena Corporation (Blue Planet, Ciena CloudWave)
ECI Telecom (ECI NFV Solution, ECI CloudWave)
Metaswitch Networks (Metaswitch Cloud Native Core, Metaswitch Cloud Connect)
Mavenir Systems (Mavenir NFV Solution, Mavenir Cloud-Native Core)
Radisys Corporation (Radisys NFV Solution, Radisys Cloud-Native Core)
Some of the Raw Material Suppliers for Network Function Virtualization (NFV) Companies:
Broadcom Inc.
Intel Corporation
Qualcomm Incorporated
Marvell Technology Group Ltd.
NVIDIA Corporation
Advanced Micro Devices, Inc. (AMD)
Arista Networks, Inc.
Xilinx, Inc.
Micron Technology, Inc.
MediaTek Inc.
RECENT TRENDS
| Report Attributes | Details |
|---|---|
| Market Size in 2023 | USD 30.78 Billion |
| Market Size by 2032 | USD 229.20 Billion |
| CAGR | CAGR of 25.03% From 2024 to 2032 |
| Base Year | 2023 |
| Forecast Period | 2024-2032 |
| Historical Data | 2020-2022 |
| Report Scope & Coverage | Market Size, Segments Analysis, Competitive Landscape, Regional Analysis, DROC & SWOT Analysis, Forecast Outlook |
| Key Segments | • By Component (Solutions, Orchestration and Automation, Services) • By Virtualized Network Functions (Compute, Storage, Network) • By Application (Virtual Appliance, Core Network) • By Organization Size (Small and Medium-sized Enterprises, Large Enterprises) • By End Users (Service Providers, Data Centers, Enterprises) |
| Regional Analysis/Coverage | North America (US, Canada, Mexico), Europe (Eastern Europe [Poland, Romania, Hungary, Turkey, Rest of Eastern Europe] Western Europe] Germany, France, UK, Italy, Spain, Netherlands, Switzerland, Austria, Rest of Western Europe]), Asia Pacific (China, India, Japan, South Korea, Vietnam, Singapore, Australia, Rest of Asia Pacific), Middle East & Africa (Middle East [UAE, Egypt, Saudi Arabia, Qatar, Rest of Middle East], Africa [Nigeria, South Africa, Rest of Africa], Latin America (Brazil, Argentina, Colombia, Rest of Latin America) |
| Company Profiles | Cisco Systems, Inc., VMware, Inc., Huawei Technologies Co., Ltd., Telefonaktiebolaget LM Ericsson, Nokia, Hewlett Packard Enterprise Development LP, Dell Inc., Juniper Networks, Inc., NEC Corporation, Affirmed Networks, Ribbon Communications Operating Company, Inc., ZTE Corporation, Intel Corporation, Oracle Corporation, Fujitsu Limited, Ciena Corporation, ECI Telecom, Metaswitch Networks, Mavenir Systems, Radisys Corporation. |
| Key Drivers | • Leveraging NFV for Scalable IoT Connectivity with Real-Time Workload Management and Edge Computing Integration • Driving Innovation with Open NFV Solutions for Agility Flexibility and Faster Service Delivery in Telecom |
| RESTRAINTS | • Overcoming Challenges of NFV Integration and Deployment for Optimized Performance and Seamless Operations |
Ans: North America dominated Network Function Virtualization (NFV) Market in 2023.
Ans: The Large Enterprises segment dominated Network Function Virtualization (NFV) Market in 2023.
Ans: The major growth factor of the Network Function Virtualization (NFV) market is the increasing demand for cost-effective, scalable, and flexible network solutions driven by digital transformation and 5G deployment.
Ans: The Network Function Virtualization (NFV) Market size was USD 30.78 billion in 2023 and is expected to Reach USD 229.20 billion by 2032.
Ans: The Network Function Virtualization (NFV) Market is expected to grow at a CAGR of 25.03% during 2024-2032.
Table of Content
1. Introduction
1.1 Market Definition
1.2 Scope (Inclusion and Exclusions)
1.3 Research Assumptions
2. Executive Summary
2.1 Market Overview
2.2 Regional Synopsis
2.3 Competitive Summary
3. Research Methodology
3.1 Top-Down Approach
3.2 Bottom-up Approach
3.3. Data Validation
3.4 Primary Interviews
4. Market Dynamics Impact Analysis
4.1 Market Driving Factors Analysis
4.1.1 Drivers
4.1.2 Restraints
4.2 PESTLE Analysis
4.3 Porter’s Five Forces Model
5. Statistical Insights and Trends Reporting
5.1 Network Function Virtualization (NFV) Adoption Rate (2023)
5.2 Network Function Virtualization (NFV) Cost Efficiency Metrics (2023)
5.3 Network Function Virtualization (NFV) Deployment Type
5.4 Network Function Virtualization (NFV) Revenue by Service Type
5.5 Network Function Virtualization (NFV) Return on Investment
6. Competitive Landscape
6.1 List of Major Companies, By Region
6.2 Market Share Analysis, By Region
6.3 Product Benchmarking
6.3.1 Product specifications and features
6.3.2 Pricing
6.4 Strategic Initiatives
6.4.1 Marketing and promotional activities
6.4.2 Distribution and Supply Chain Strategies
6.4.3 Expansion plans and new product launches
6.4.4 Strategic partnerships and collaborations
6.5 Technological Advancements
6.6 Market Positioning and Branding
7. Network Function Virtualization (NFV) Market Segmentation, By Component
7.1 Chapter Overview
7.2 Solution
7.2.1 Solution Market Trends Analysis (2020-2032)
7.2.2 Solution Market Size Estimates and Forecasts to 2032 (USD Billion)
7.3 Service
7.3.1 Service Market Trends Analysis (2020-2032)
7.3.2 Service Market Size Estimates and Forecasts to 2032 (USD Billion)
8. Network Function Virtualization (NFV) Market Segmentation, By Virtualized Network Functions
8.1 Chapter Overview
8.2 Compute
8.2.1 Compute Market Trends Analysis (2020-2032)
8.2.2 Compute Market Size Estimates and Forecasts To 2032 (USD Billion)
8.3 Storage
8.3.1 Storage Market Trends Analysis (2020-2032)
8.3.2 Storage Market Size Estimates and Forecasts To 2032 (USD Billion)
8.4 Network
8.4.1 Network Market Trends Analysis (2020-2032)
8.4.2 Network Market Size Estimates and Forecasts To 2032 (USD Billion)
9. Network Function Virtualization (NFV) Market Segmentation, By Application
9.1 Chapter Overview
9.2 Virtual Appliance
9.2.1 Virtual Appliance Market Trends Analysis (2020-2032)
9.2.2 Virtual Appliance Market Size Estimates and Forecasts To 2032 (USD Billion)
9.3 Core Network
9.3.1 Core Network Trends Analysis (2020-2032)
9.3.2 Core Network Size Estimates and Forecasts To 2032 (USD Billion)
10. Network Function Virtualization (NFV) Market Segmentation, By Organization Size
10.1 Chapter Overview
10.2 Small and Medium-sized Enterprises
10.2.1 Small and Medium-sized Enterprises Market Trends Analysis (2020-2032)
10.2.2 Small and Medium-sized Enterprises Market Size Estimates and Forecasts To 2032 (USD Billion)
10.3 Large Enterprises
10.3.1 Large Enterprises Market Trends Analysis (2020-2032)
10.3.2 Large Enterprises Market Size Estimates and Forecasts To 2032 (USD Billion)
11. Network Function Virtualization (NFV) Market Segmentation, By End Users
11.1 Chapter Overview
11.2 Service Providers
11.2.1 Service Providers Market Trends Analysis (2020-2032)
11.2.2 Service Providers Market Size Estimates and Forecasts To 2032 (USD Billion)
11.3 Data Centers
11.3.1 Data Centers Market Trends Analysis (2020-2032)
11.3.2 Data Centers Market Size Estimates and Forecasts To 2032 (USD Billion)
11.4 Enterprises
11.4.1 Enterprises Market Trends Analysis (2020-2032)
11.4.2 Enterprises Market Size Estimates and Forecasts To 2032 (USD Billion)
12. Regional Analysis
12.1 Chapter Overview
12.2 North America
12.2.1 Trends Analysis
12.2.2 North America Network Function Virtualization (NFV) Market Estimates and Forecasts, By Country (2020-2032) (USD Billion)
12.2.3 North America Network Function Virtualization (NFV) Market Estimates and Forecasts, By Component (2020-2032) (USD Billion)
12.2.4 North America Network Function Virtualization (NFV) Market Estimates and Forecasts, By Virtualized Network Functions (2020-2032) (USD Billion)
12.2.5 North America Network Function Virtualization (NFV) Market Estimates and Forecasts, By Application (2020-2032) (USD Billion)
12.2.6 North America Network Function Virtualization (NFV) Market Estimates and Forecasts, By Organization Size (2020-2032) (USD Billion)
12.2.7 North America Network Function Virtualization (NFV) Market Estimates and Forecasts, By End Users (2020-2032) (USD Billion)
12.2.8 USA
12.2.8.1 USA Network Function Virtualization (NFV) Market Estimates and Forecasts, By Component (2020-2032) (USD Billion)
12.2.8.2 USA Network Function Virtualization (NFV) Market Estimates and Forecasts, By Virtualized Network Functions (2020-2032) (USD Billion)
12.2.8.3 USA Network Function Virtualization (NFV) Market Estimates and Forecasts, By Application (2020-2032) (USD Billion)
12.2.8.4 USA Network Function Virtualization (NFV) Market Estimates and Forecasts, By Organization Size (2020-2032) (USD Billion)
12.2.8.5 USA Network Function Virtualization (NFV) Market Estimates and Forecasts, By End Users (2020-2032) (USD Billion)
12.2.9 Canada
12.2.9.1 Canada Network Function Virtualization (NFV) Market Estimates and Forecasts, By Component (2020-2032) (USD Billion)
12.2.9.2 Canada Network Function Virtualization (NFV) Market Estimates and Forecasts, By Virtualized Network Functions (2020-2032) (USD Billion)
12.2.9.3 Canada Network Function Virtualization (NFV) Market Estimates and Forecasts, By Application (2020-2032) (USD Billion)
12.2.9.4 Canada Network Function Virtualization (NFV) Market Estimates and Forecasts, By Organization Size (2020-2032) (USD Billion)
12.2.9.5 Canada Network Function Virtualization (NFV) Market Estimates and Forecasts, By End Users (2020-2032) (USD Billion)
12.2.10 Mexico
12.2.10.1 Mexico Network Function Virtualization (NFV) Market Estimates and Forecasts, By Component (2020-2032) (USD Billion)
12.2.10.2 Mexico Network Function Virtualization (NFV) Market Estimates and Forecasts, By Virtualized Network Functions (2020-2032) (USD Billion)
12.2.10.3 Mexico Network Function Virtualization (NFV) Market Estimates and Forecasts, By Application (2020-2032) (USD Billion)
12.2.10.4 Mexico Network Function Virtualization (NFV) Market Estimates and Forecasts, By Organization Size (2020-2032) (USD Billion)
12.2.10.5 Mexico Network Function Virtualization (NFV) Market Estimates and Forecasts, By End Users (2020-2032) (USD Billion)
12.3 Europe
12.3.1 Eastern Europe
12.3.1.1 Trends Analysis
12.3.1.2 Eastern Europe Network Function Virtualization (NFV) Market Estimates and Forecasts, By Country (2020-2032) (USD Billion)
12.3.1.3 Eastern Europe Network Function Virtualization (NFV) Market Estimates and Forecasts, By Component (2020-2032) (USD Billion)
12.3.1.4 Eastern Europe Network Function Virtualization (NFV) Market Estimates and Forecasts, By Virtualized Network Functions (2020-2032) (USD Billion)
12.3.1.5 Eastern Europe Network Function Virtualization (NFV) Market Estimates and Forecasts, By Application (2020-2032) (USD Billion)
12.3.1.6 Eastern Europe Network Function Virtualization (NFV) Market Estimates and Forecasts, By Organization Size (2020-2032) (USD Billion)
12.3.1.7 Eastern Europe Network Function Virtualization (NFV) Market Estimates and Forecasts, By End Users (2020-2032) (USD Billion)
12.3.1.8 Poland
12.3.1.8.1 Poland Network Function Virtualization (NFV) Market Estimates and Forecasts, By Component (2020-2032) (USD Billion)
12.3.1.8.2 Poland Network Function Virtualization (NFV) Market Estimates and Forecasts, By Virtualized Network Functions (2020-2032) (USD Billion)
12.3.1.8.3 Poland Network Function Virtualization (NFV) Market Estimates and Forecasts, By Application (2020-2032) (USD Billion)
12.3.1.8.4 Poland Network Function Virtualization (NFV) Market Estimates and Forecasts, By Organization Size (2020-2032) (USD Billion)
12.3.1.8.5 Poland Network Function Virtualization (NFV) Market Estimates and Forecasts, By End Users (2020-2032) (USD Billion)
12.3.1.9 Romania
12.3.1.9.1 Romania Network Function Virtualization (NFV) Market Estimates and Forecasts, By Component (2020-2032) (USD Billion)
12.3.1.9.2 Romania Network Function Virtualization (NFV) Market Estimates and Forecasts, By Virtualized Network Functions (2020-2032) (USD Billion)
12.3.1.9.3 Romania Network Function Virtualization (NFV) Market Estimates and Forecasts, By Application (2020-2032) (USD Billion)
12.3.1.9.4 Romania Network Function Virtualization (NFV) Market Estimates And Forecasts, By Organization Size (2020-2032) (USD Billion)
12.3.1.9.5 Romania Network Function Virtualization (NFV) Market Estimates And Forecasts, By End Users (2020-2032) (USD Billion)
12.3.1.10 Hungary
12.3.1.10.1 Hungary Network Function Virtualization (NFV) Market Estimates And Forecasts, By Component (2020-2032) (USD Billion)
12.3.1.10.2 Hungary Network Function Virtualization (NFV) Market Estimates And Forecasts, By Virtualized Network Functions (2020-2032) (USD Billion)
12.3.1.10.3 Hungary Network Function Virtualization (NFV) Market Estimates And Forecasts, By Application (2020-2032) (USD Billion)
12.3.1.10.4 Hungary Network Function Virtualization (NFV) Market Estimates And Forecasts, By Organization Size (2020-2032) (USD Billion)
12.3.1.10.5 Hungary Network Function Virtualization (NFV) Market Estimates And Forecasts, By End Users (2020-2032) (USD Billion)
12.3.1.11 Turkey
12.3.1.11.1 Turkey Network Function Virtualization (NFV) Market Estimates And Forecasts, By Component (2020-2032) (USD Billion)
12.3.1.11.2 Turkey Network Function Virtualization (NFV) Market Estimates And Forecasts, By Virtualized Network Functions (2020-2032) (USD Billion)
12.3.1.11.3 Turkey Network Function Virtualization (NFV) Market Estimates And Forecasts, By Application (2020-2032) (USD Billion)
12.3.1.11.4 Turkey Network Function Virtualization (NFV) Market Estimates And Forecasts, By Organization Size (2020-2032) (USD Billion)
12.3.1.11.5 Turkey Network Function Virtualization (NFV) Market Estimates And Forecasts, By End Users (2020-2032) (USD Billion)
12.3.1.12 Rest Of Eastern Europe
12.3.1.12.1 Rest Of Eastern Europe Network Function Virtualization (NFV) Market Estimates And Forecasts, By Component (2020-2032) (USD Billion)
12.3.1.12.2 Rest Of Eastern Europe Network Function Virtualization (NFV) Market Estimates And Forecasts, By Virtualized Network Functions (2020-2032) (USD Billion)
12.3.1.12.3 Rest Of Eastern Europe Network Function Virtualization (NFV) Market Estimates And Forecasts, By Application (2020-2032) (USD Billion)
12.3.1.12.4 Rest Of Eastern Europe Network Function Virtualization (NFV) Market Estimates And Forecasts, By Organization Size (2020-2032) (USD Billion)
12.3.1.12.5 Rest Of Eastern Europe Network Function Virtualization (NFV) Market Estimates And Forecasts, By End Users (2020-2032) (USD Billion)
12.3.2 Western Europe
12.3.2.1 Trends Analysis
12.3.2.2 Western Europe Network Function Virtualization (NFV) Market Estimates And Forecasts, By Country (2020-2032) (USD Billion)
12.3.2.3 Western Europe Network Function Virtualization (NFV) Market Estimates And Forecasts, By Component (2020-2032) (USD Billion)
12.3.2.4 Western Europe Network Function Virtualization (NFV) Market Estimates And Forecasts, By Virtualized Network Functions (2020-2032) (USD Billion)
12.3.2.5 Western Europe Network Function Virtualization (NFV) Market Estimates And Forecasts, By Application (2020-2032) (USD Billion)
12.3.2.6 Western Europe Network Function Virtualization (NFV) Market Estimates And Forecasts, By Organization Size (2020-2032) (USD Billion)
12.3.2.7 Western Europe Network Function Virtualization (NFV) Market Estimates And Forecasts, By End Users (2020-2032) (USD Billion)
12.3.2.8 Germany
12.3.2.8.1 Germany Network Function Virtualization (NFV) Market Estimates And Forecasts, By Component (2020-2032) (USD Billion)
12.3.2.8.2 Germany Network Function Virtualization (NFV) Market Estimates And Forecasts, By Virtualized Network Functions (2020-2032) (USD Billion)
12.3.2.8.3 Germany Network Function Virtualization (NFV) Market Estimates And Forecasts, By Material Vehicle Type (2020-2032) (USD Billion)
12.3.2.8.4 Germany Network Function Virtualization (NFV) Market Estimates And Forecasts, By Organization Size (2020-2032) (USD Billion)
12.3.2.8.5 Germany Network Function Virtualization (NFV) Market Estimates And Forecasts, By End Users (2020-2032) (USD Billion)
12.3.2.9 France
12.3.2.9.1 France Network Function Virtualization (NFV) Market Estimates And Forecasts, By Component (2020-2032) (USD Billion)
12.3.2.9.2 France Network Function Virtualization (NFV) Market Estimates And Forecasts, By Virtualized Network Functions (2020-2032) (USD Billion)
12.3.2.9.3 France Network Function Virtualization (NFV) Market Estimates And Forecasts, By Application (2020-2032) (USD Billion)
12.3.2.9.4 France Network Function Virtualization (NFV) Market Estimates And Forecasts, By Organization Size (2020-2032) (USD Billion)
12.3.2.9.5 France Network Function Virtualization (NFV) Market Estimates And Forecasts, By End Users (2020-2032) (USD Billion)
12.3.2.10 UK
12.3.2.10.1 UK Network Function Virtualization (NFV) Market Estimates And Forecasts, By Component (2020-2032) (USD Billion)
12.3.2.10.2 UK Network Function Virtualization (NFV) Market Estimates And Forecasts, By Virtualized Network Functions (2020-2032) (USD Billion)
12.3.2.10.3 UK Network Function Virtualization (NFV) Market Estimates And Forecasts, By Application (2020-2032) (USD Billion)
12.3.2.10.4 UK Network Function Virtualization (NFV) Market Estimates And Forecasts, By Organization Size (2020-2032) (USD Billion)
12.3.2.10.5 UK Network Function Virtualization (NFV) Market Estimates And Forecasts, By End Users (2020-2032) (USD Billion)
12.3.2.11 Italy
12.3.2.11.1 Italy Network Function Virtualization (NFV) Market Estimates And Forecasts, By Component (2020-2032) (USD Billion)
12.3.2.11.2 Italy Network Function Virtualization (NFV) Market Estimates And Forecasts, By Virtualized Network Functions (2020-2032) (USD Billion)
12.3.2.11.3 Italy Network Function Virtualization (NFV) Market Estimates And Forecasts, By Application (2020-2032) (USD Billion)
12.3.2.11.4 Italy Network Function Virtualization (NFV) Market Estimates And Forecasts, By Organization Size (2020-2032) (USD Billion)
12.3.2.11.5 Italy Network Function Virtualization (NFV) Market Estimates And Forecasts, By End Users (2020-2032) (USD Billion)
12.3.2.12 Spain
12.3.2.12.1 Spain Network Function Virtualization (NFV) Market Estimates And Forecasts, By Component (2020-2032) (USD Billion)
12.3.2.12.2 Spain Network Function Virtualization (NFV) Market Estimates And Forecasts, By Virtualized Network Functions (2020-2032) (USD Billion)
12.3.2.12.3 Spain Network Function Virtualization (NFV) Market Estimates And Forecasts, By Application (2020-2032) (USD Billion)
12.3.2.12.4 Spain Network Function Virtualization (NFV) Market Estimates And Forecasts, By Organization Size (2020-2032) (USD Billion)
12.3.2.12.5 Spain Network Function Virtualization (NFV) Market Estimates And Forecasts, By End Users (2020-2032) (USD Billion)
12.3.2.13 Netherlands
12.3.2.13.1 Netherlands Network Function Virtualization (NFV) Market Estimates And Forecasts, By Component (2020-2032) (USD Billion)
12.3.2.13.2 Netherlands Network Function Virtualization (NFV) Market Estimates And Forecasts, By Virtualized Network Functions (2020-2032) (USD Billion)
12.3.2.13.3 Netherlands Network Function Virtualization (NFV) Market Estimates And Forecasts, By Application (2020-2032) (USD Billion)
12.3.2.13.4 Netherlands Network Function Virtualization (NFV) Market Estimates And Forecasts, By Organization Size (2020-2032) (USD Billion)
12.3.2.13.5 Netherlands Network Function Virtualization (NFV) Market Estimates And Forecasts, By End Users (2020-2032) (USD Billion)
12.3.2.14 Switzerland
12.3.2.14.1 Switzerland Network Function Virtualization (NFV) Market Estimates And Forecasts, By Component (2020-2032) (USD Billion)
12.3.2.14.2 Switzerland Network Function Virtualization (NFV) Market Estimates And Forecasts, By Virtualized Network Functions (2020-2032) (USD Billion)
12.3.2.14.3 Switzerland Network Function Virtualization (NFV) Market Estimates And Forecasts, By Application (2020-2032) (USD Billion)
12.3.2.14.4 Switzerland Network Function Virtualization (NFV) Market Estimates And Forecasts, By Organization Size (2020-2032) (USD Billion)
12.3.2.12.5 Switzerland Network Function Virtualization (NFV) Market Estimates And Forecasts, By End Users (2020-2032) (USD Billion)
12.3.2.15 Austria
12.3.2.15.1 Austria Network Function Virtualization (NFV) Market Estimates And Forecasts, By Component (2020-2032) (USD Billion)
12.3.2.15.2 Austria Network Function Virtualization (NFV) Market Estimates And Forecasts, By Virtualized Network Functions (2020-2032) (USD Billion)
12.3.2.15.3 Austria Network Function Virtualization (NFV) Market Estimates And Forecasts, By Application (2020-2032) (USD Billion)
12.3.2.15.4 Austria Network Function Virtualization (NFV) Market Estimates And Forecasts, By Organization Size (2020-2032) (USD Billion)
12.3.2.15.5 Austria Network Function Virtualization (NFV) Market Estimates And Forecasts, By End Users (2020-2032) (USD Billion)
12.3.2.16 Rest Of Western Europe
12.3.2.16.1 Rest Of Western Europe Network Function Virtualization (NFV) Market Estimates And Forecasts, By Component (2020-2032) (USD Billion)
12.3.2.16.2 Rest Of Western Europe Network Function Virtualization (NFV) Market Estimates And Forecasts, By Virtualized Network Functions (2020-2032) (USD Billion)
12.3.2.16.3 Rest Of Western Europe Network Function Virtualization (NFV) Market Estimates And Forecasts, By Application (2020-2032) (USD Billion)
12.3.2.16.4 Rest Of Western Europe Network Function Virtualization (NFV) Market Estimates And Forecasts, By Organization Size (2020-2032) (USD Billion)
12.3.2.16.5 Rest Of Western Europe Network Function Virtualization (NFV) Market Estimates And Forecasts, By End Users (2020-2032) (USD Billion)
12.4 Asia Pacific
12.4.1 Trends Analysis
12.4.2 Asia Pacific Network Function Virtualization (NFV) Market Estimates And Forecasts, By Country (2020-2032) (USD Billion)
12.4.3 Asia Pacific Network Function Virtualization (NFV) Market Estimates And Forecasts, By Component (2020-2032) (USD Billion)
12.4.4 Asia Pacific Network Function Virtualization (NFV) Market Estimates And Forecasts, By Virtualized Network Functions (2020-2032) (USD Billion)
12.4.5 Asia Pacific Network Function Virtualization (NFV) Market Estimates And Forecasts, By Application (2020-2032) (USD Billion)
12.4.6 Asia Pacific Network Function Virtualization (NFV) Market Estimates And Forecasts, By Organization Size (2020-2032) (USD Billion)
12.4.7 Asia Pacific Network Function Virtualization (NFV) Market Estimates And Forecasts, By End Users (2020-2032) (USD Billion)
12.4.8 China
12.4.8.1 China Network Function Virtualization (NFV) Market Estimates And Forecasts, By Component (2020-2032) (USD Billion)
12.4.8.2 China Network Function Virtualization (NFV) Market Estimates And Forecasts, By Virtualized Network Functions (2020-2032) (USD Billion)
12.4.8.3 China Network Function Virtualization (NFV) Market Estimates And Forecasts, By Application (2020-2032) (USD Billion)
12.4.8.4 China Network Function Virtualization (NFV) Market Estimates And Forecasts, By Organization Size (2020-2032) (USD Billion)
12.4.8.5 China Network Function Virtualization (NFV) Market Estimates And Forecasts, By End Users (2020-2032) (USD Billion)
12.4.9 India
12.4.9.1 India Network Function Virtualization (NFV) Market Estimates And Forecasts, By Component (2020-2032) (USD Billion)
12.4.9.2 India Network Function Virtualization (NFV) Market Estimates And Forecasts, By Virtualized Network Functions (2020-2032) (USD Billion)
12.4.9.3 India Network Function Virtualization (NFV) Market Estimates And Forecasts, By Application (2020-2032) (USD Billion)
12.4.9.4 India Network Function Virtualization (NFV) Market Estimates And Forecasts, By Organization Size (2020-2032) (USD Billion)
12.4.9.5 India Network Function Virtualization (NFV) Market Estimates And Forecasts, By End Users (2020-2032) (USD Billion)
12.4.10 Japan
12.4.10.1 Japan Network Function Virtualization (NFV) Market Estimates And Forecasts, By Component (2020-2032) (USD Billion)
12.4.10.2 Japan Network Function Virtualization (NFV) Market Estimates And Forecasts, By Virtualized Network Functions (2020-2032) (USD Billion)
12.4.10.3 Japan Network Function Virtualization (NFV) Market Estimates And Forecasts, By Application (2020-2032) (USD Billion)
12.4.10.4 Japan Network Function Virtualization (NFV) Market Estimates And Forecasts, By Organization Size (2020-2032) (USD Billion)
12.4.10.5 Japan Network Function Virtualization (NFV) Market Estimates And Forecasts, By End Users (2020-2032) (USD Billion)
12.4.11 South Korea
12.4.11.1 South Korea Network Function Virtualization (NFV) Market Estimates And Forecasts, By Component (2020-2032) (USD Billion)
12.4.11.2 South Korea Network Function Virtualization (NFV) Market Estimates And Forecasts, By Virtualized Network Functions (2020-2032) (USD Billion)
12.4.11.3 South Korea Network Function Virtualization (NFV) Market Estimates And Forecasts, By Application (2020-2032) (USD Billion)
12.4.11.4 South Korea Network Function Virtualization (NFV) Market Estimates And Forecasts, By Organization Size (2020-2032) (USD Billion)
12.4.11.5 South Korea Network Function Virtualization (NFV) Market Estimates And Forecasts, By End Users (2020-2032) (USD Billion)
12.4.12 Vietnam
12.4.12.1 Vietnam Network Function Virtualization (NFV) Market Estimates And Forecasts, By Component (2020-2032) (USD Billion)
12.4.12.2 Vietnam Network Function Virtualization (NFV) Market Estimates And Forecasts, By Virtualized Network Functions (2020-2032) (USD Billion)
12.4.12.3 Vietnam Network Function Virtualization (NFV) Market Estimates And Forecasts, By Application (2020-2032) (USD Billion)
12.4.12.4 Vietnam Network Function Virtualization (NFV) Market Estimates And Forecasts, By Organization Size (2020-2032) (USD Billion)
12.4.12.5 Vietnam Network Function Virtualization (NFV) Market Estimates And Forecasts, By End Users (2020-2032) (USD Billion)
12.4.13 Singapore
12.4.13.1 Singapore Network Function Virtualization (NFV) Market Estimates And Forecasts, By Component (2020-2032) (USD Billion)
12.4.13.2 Singapore Network Function Virtualization (NFV) Market Estimates And Forecasts, By Virtualized Network Functions (2020-2032) (USD Billion)
12.4.13.3 Singapore Network Function Virtualization (NFV) Market Estimates And Forecasts, By Application (2020-2032) (USD Billion)
12.4.13.4 Singapore Network Function Virtualization (NFV) Market Estimates And Forecasts, By Organization Size (2020-2032) (USD Billion)
12.4.13.5 Singapore Network Function Virtualization (NFV) Market Estimates And Forecasts, By End Users (2020-2032) (USD Billion)
12.4.14 Australia
12.4.14.1 Australia Network Function Virtualization (NFV) Market Estimates And Forecasts, By Component (2020-2032) (USD Billion)
12.4.14.2 Australia Network Function Virtualization (NFV) Market Estimates And Forecasts, By Virtualized Network Functions (2020-2032) (USD Billion)
12.4.14.3 Australia Network Function Virtualization (NFV) Market Estimates And Forecasts, By Application (2020-2032) (USD Billion)
12.4.14.4 Australia Network Function Virtualization (NFV) Market Estimates And Forecasts, By Organization Size (2020-2032) (USD Billion)
12.4.14.5 Australia Network Function Virtualization (NFV) Market Estimates And Forecasts, By End Users (2020-2032) (USD Billion)
12.4.15 Rest Of Asia Pacific
12.4.15.1 Rest Of Asia Pacific Network Function Virtualization (NFV) Market Estimates And Forecasts, By Component (2020-2032) (USD Billion)
12.4.15.2 Rest Of Asia Pacific Network Function Virtualization (NFV) Market Estimates And Forecasts, By Virtualized Network Functions (2020-2032) (USD Billion)
12.4.15.3 Rest Of Asia Pacific Network Function Virtualization (NFV) Market Estimates And Forecasts, By Application (2020-2032) (USD Billion)
12.4.15.4 Rest Of Asia Pacific Network Function Virtualization (NFV) Market Estimates And Forecasts, By Organization Size (2020-2032) (USD Billion)
12.4.15.5 Rest Of Asia Pacific Network Function Virtualization (NFV) Market Estimates And Forecasts, By End Users (2020-2032) (USD Billion)
12.5 Middle East And Africa
12.5.1 Middle East
12.5.1.1 Trends Analysis
12.5.1.2 Middle East Network Function Virtualization (NFV) Market Estimates And Forecasts, By Country (2020-2032) (USD Billion)
12.5.1.3 Middle East Network Function Virtualization (NFV) Market Estimates And Forecasts, By Component (2020-2032) (USD Billion)
12.5.1.4 Middle East Network Function Virtualization (NFV) Market Estimates And Forecasts, By Virtualized Network Functions (2020-2032) (USD Billion)
12.5.1.5 Middle East Network Function Virtualization (NFV) Market Estimates And Forecasts, By Application (2020-2032) (USD Billion)
12.5.1.6 Middle East Network Function Virtualization (NFV) Market Estimates And Forecasts, By Organization Size (2020-2032) (USD Billion)
12.5.1.7 Middle East Network Function Virtualization (NFV) Market Estimates And Forecasts, By End Users (2020-2032) (USD Billion)
12.5.1.8 UAE
12.5.1.8.1 UAE Network Function Virtualization (NFV) Market Estimates And Forecasts, By Component (2020-2032) (USD Billion)
12.5.1.8.2 UAE Network Function Virtualization (NFV) Market Estimates And Forecasts, By Virtualized Network Functions (2020-2032) (USD Billion)
12.5.1.8.3 UAE Network Function Virtualization (NFV) Market Estimates And Forecasts, By Application (2020-2032) (USD Billion)
12.5.1.8.4 UAE Network Function Virtualization (NFV) Market Estimates And Forecasts, By Organization Size (2020-2032) (USD Billion)
12.5.1.8.5 UAE Network Function Virtualization (NFV) Market Estimates And Forecasts, By End Users (2020-2032) (USD Billion)
12.5.1.9 Egypt
12.5.1.9.1 Egypt Network Function Virtualization (NFV) Market Estimates And Forecasts, By Component (2020-2032) (USD Billion)
12.5.1.9.2 Egypt Network Function Virtualization (NFV) Market Estimates And Forecasts, By Virtualized Network Functions (2020-2032) (USD Billion)
12.5.1.9.3 Egypt Network Function Virtualization (NFV) Market Estimates And Forecasts, By Application (2020-2032) (USD Billion)
12.5.1.9.4 Egypt Network Function Virtualization (NFV) Market Estimates And Forecasts, By Organization Size (2020-2032) (USD Billion)
12.5.1.9.5 Egypt Network Function Virtualization (NFV) Market Estimates And Forecasts, By End Users (2020-2032) (USD Billion)
12.5.1.10 Saudi Arabia
12.5.1.10.1 Saudi Arabia Network Function Virtualization (NFV) Market Estimates And Forecasts, By Component (2020-2032) (USD Billion)
12.5.1.10.2 Saudi Arabia Network Function Virtualization (NFV) Market Estimates And Forecasts, By Virtualized Network Functions (2020-2032) (USD Billion)
12.5.1.10.3 Saudi Arabia Network Function Virtualization (NFV) Market Estimates And Forecasts, By Application (2020-2032) (USD Billion)
12.5.1.10.4 Saudi Arabia Network Function Virtualization (NFV) Market Estimates And Forecasts, By Organization Size (2020-2032) (USD Billion)
12.5.1.10.5 Saudi Arabia Network Function Virtualization (NFV) Market Estimates And Forecasts, By End Users (2020-2032) (USD Billion)
12.5.1.11 Qatar
12.5.1.11.1 Qatar Network Function Virtualization (NFV) Market Estimates And Forecasts, By Component (2020-2032) (USD Billion)
12.5.1.11.2 Qatar Network Function Virtualization (NFV) Market Estimates And Forecasts, By Virtualized Network Functions (2020-2032) (USD Billion)
12.5.1.11.3 Qatar Network Function Virtualization (NFV) Market Estimates And Forecasts, By Application (2020-2032) (USD Billion)
12.5.1.11.4 Qatar Network Function Virtualization (NFV) Market Estimates And Forecasts, By Organization Size (2020-2032) (USD Billion)
12.5.1.11.5 Qatar Network Function Virtualization (NFV) Market Estimates And Forecasts, By End Users (2020-2032) (USD Billion)
12.5.1.12 Rest Of Middle East
12.5.1.12.1 Rest Of Middle East Network Function Virtualization (NFV) Market Estimates And Forecasts, By Component (2020-2032) (USD Billion)
12.5.1.12.2 Rest Of Middle East Network Function Virtualization (NFV) Market Estimates And Forecasts, By Virtualized Network Functions (2020-2032) (USD Billion)
12.5.1.12.3 Rest Of Middle East Network Function Virtualization (NFV) Market Estimates And Forecasts, By Application (2020-2032) (USD Billion)
12.5.1.12.4 Rest Of Middle East Network Function Virtualization (NFV) Market Estimates And Forecasts, By Organization Size (2020-2032) (USD Billion)
12.5.1.12.5 Rest Of Middle East Network Function Virtualization (NFV) Market Estimates And Forecasts, By End Users (2020-2032) (USD Billion)
12.5.2 Africa
12.5.2.1 Trends Analysis
12.5.2.2 Africa Network Function Virtualization (NFV) Market Estimates And Forecasts, By Country (2020-2032) (USD Billion)
12.5.2.3 Africa Network Function Virtualization (NFV) Market Estimates And Forecasts, By Component (2020-2032) (USD Billion)
12.5.2.4 Africa Network Function Virtualization (NFV) Market Estimates And Forecasts, By Virtualized Network Functions (2020-2032) (USD Billion)
12.5.2.5 Africa Network Function Virtualization (NFV) Market Estimates And Forecasts, By Application (2020-2032) (USD Billion)
12.5.2.6 Africa Network Function Virtualization (NFV) Market Estimates And Forecasts, By Organization Size (2020-2032) (USD Billion)
12.5.2.7 Africa Network Function Virtualization (NFV) Market Estimates And Forecasts, By End Users (2020-2032) (USD Billion)
12.5.2.8 South Africa
12.5.2.8.1 South Africa Network Function Virtualization (NFV) Market Estimates And Forecasts, By Component (2020-2032) (USD Billion)
12.5.2.8.2 South Africa Network Function Virtualization (NFV) Market Estimates And Forecasts, By Virtualized Network Functions (2020-2032) (USD Billion)
12.5.2.8.3 South Africa Network Function Virtualization (NFV) Market Estimates And Forecasts, By Application (2020-2032) (USD Billion)
12.5.2.8.4 South Africa Network Function Virtualization (NFV) Market Estimates And Forecasts, By Organization Size (2020-2032) (USD Billion)
12.5.2.8.5 South Africa Network Function Virtualization (NFV) Market Estimates And Forecasts, By End Users (2020-2032) (USD Billion)
12.5.2.9 Nigeria
12.5.2.9.1 Nigeria Network Function Virtualization (NFV) Market Estimates And Forecasts, By Component (2020-2032) (USD Billion)
12.5.2.9.2 Nigeria Network Function Virtualization (NFV) Market Estimates And Forecasts, By Virtualized Network Functions (2020-2032) (USD Billion)
12.5.2.9.3 Nigeria Network Function Virtualization (NFV) Market Estimates And Forecasts, By Application (2020-2032) (USD Billion)
12.5.2.9.4 Nigeria Network Function Virtualization (NFV) Market Estimates And Forecasts, By Organization Size (2020-2032) (USD Billion)
12.5.2.9.5 Nigeria Network Function Virtualization (NFV) Market Estimates And Forecasts, By End Users (2020-2032) (USD Billion)
12.5.2.10 Rest Of Africa
12.5.2.10.1 Rest Of Africa Network Function Virtualization (NFV) Market Estimates And Forecasts, By Component (2020-2032) (USD Billion)
12.5.2.10.2 Rest Of Africa Network Function Virtualization (NFV) Market Estimates And Forecasts, By Virtualized Network Functions (2020-2032) (USD Billion)
12.5.2.10.3 Rest Of Africa Network Function Virtualization (NFV) Market Estimates And Forecasts, By Application (2020-2032) (USD Billion)
12.5.2.10.4 Rest Of Africa Network Function Virtualization (NFV) Market Estimates And Forecasts, By Organization Size (2020-2032) (USD Billion)
12.5.2.10.5 Rest Of Africa Network Function Virtualization (NFV) Market Estimates And Forecasts, By End Users (2020-2032) (USD Billion)
12.6 Latin America
12.6.1 Trends Analysis
12.6.2 Latin America Network Function Virtualization (NFV) Market Estimates And Forecasts, By Country (2020-2032) (USD Billion)
12.6.3 Latin America Network Function Virtualization (NFV) Market Estimates And Forecasts, By Component (2020-2032) (USD Billion)
12.6.4 Latin America Network Function Virtualization (NFV) Market Estimates And Forecasts, By Virtualized Network Functions (2020-2032) (USD Billion)
12.6.5 Latin America Network Function Virtualization (NFV) Market Estimates And Forecasts, By Application (2020-2032) (USD Billion)
12.6.6 Latin America Network Function Virtualization (NFV) Market Estimates And Forecasts, By Organization Size (2020-2032) (USD Billion)
12.6.7 Latin America Network Function Virtualization (NFV) Market Estimates And Forecasts, By End Users (2020-2032) (USD Billion)
12.6.8 Brazil
12.6.8.1 Brazil Network Function Virtualization (NFV) Market Estimates And Forecasts, By Component (2020-2032) (USD Billion)
12.6.8.2 Brazil Network Function Virtualization (NFV) Market Estimates And Forecasts, By Virtualized Network Functions (2020-2032) (USD Billion)
12.6.8.3 Brazil Network Function Virtualization (NFV) Market Estimates And Forecasts, By Application (2020-2032) (USD Billion)
12.6.8.4 Brazil Network Function Virtualization (NFV) Market Estimates And Forecasts, By Organization Size (2020-2032) (USD Billion)
12.6.8.5 Brazil Network Function Virtualization (NFV) Market Estimates And Forecasts, By End Users (2020-2032) (USD Billion)
12.6.9 Argentina
12.6.9.1 Argentina Network Function Virtualization (NFV) Market Estimates And Forecasts, By Component (2020-2032) (USD Billion)
12.6.9.2 Argentina Network Function Virtualization (NFV) Market Estimates And Forecasts, By Virtualized Network Functions (2020-2032) (USD Billion)
12.6.9.3 Argentina Network Function Virtualization (NFV) Market Estimates And Forecasts, By Application (2020-2032) (USD Billion)
12.6.9.4 Argentina Network Function Virtualization (NFV) Market Estimates And Forecasts, By Organization Size (2020-2032) (USD Billion)
12.6.9.5 Argentina Network Function Virtualization (NFV) Market Estimates And Forecasts, By End Users (2020-2032) (USD Billion)
12.6.10 Colombia
12.6.10.1 Colombia Network Function Virtualization (NFV) Market Estimates And Forecasts, By Component (2020-2032) (USD Billion)
12.6.10.2 Colombia Network Function Virtualization (NFV) Market Estimates And Forecasts, By Virtualized Network Functions (2020-2032) (USD Billion)
12.6.10.3 Colombia Network Function Virtualization (NFV) Market Estimates And Forecasts, By Application (2020-2032) (USD Billion)
12.6.10.4 Colombia Network Function Virtualization (NFV) Market Estimates And Forecasts, By Organization Size (2020-2032) (USD Billion)
12.6.10.5 Colombia Network Function Virtualization (NFV) Market Estimates And Forecasts, By End Users (2020-2032) (USD Billion)
12.6.11 Rest Of Latin America
12.6.11.1 Rest Of Latin America Network Function Virtualization (NFV) Market Estimates And Forecasts, By Component (2020-2032) (USD Billion)
12.6.11.2 Rest Of Latin America Network Function Virtualization (NFV) Market Estimates And Forecasts, By Virtualized Network Functions (2020-2032) (USD Billion)
12.6.11.3 Rest Of Latin America Network Function Virtualization (NFV) Market Estimates And Forecasts, By Application (2020-2032) (USD Billion)
12.6.11.4 Rest Of Latin America Network Function Virtualization (NFV) Market Estimates And Forecasts, By Organization Size (2020-2032) (USD Billion)
12.6.11.5 Rest Of Latin America Network Function Virtualization (NFV) Market Estimates And Forecasts, By End Users (2020-2032) (USD Billion)
13. Company Profiles
13.1 Cisco Systems, Inc
13.1.1 Company Overview
13.1.2 Financial
13.1.3 Products/ Services Offered
13.1.4 SWOT Analysis
13.2 VMware, Inc
13.2.1 Company Overview
13.2.2 Financial
13.2.3 Products/ Services Offered
13.2.4 SWOT Analysis
13.3 Huawei Technologies Co., Ltd
13.3.1 Company Overview
13.3.2 Financial
13.3.3 Products/ Services Offered
13.3.4 SWOT Analysis
13.4 Telefonaktiebolaget LM Ericsson
13.4.1 Company Overview
13.4.2 Financial
13.4.3 Products/ Services Offered
13.4.4 SWOT Analysis
13.5 Nokia
13.5.1 Company Overview
13.5.2 Financial
13.5.3 Products/ Services Offered
13.5.4 SWOT Analysis
13.6 Hewlett Packard Enterprise Development LP
13.6.1 Company Overview
13.6.2 Financial
13.6.3 Products/ Services Offered
13.6.4 SWOT Analysis
13.7 Dell Inc.
13.7.1 Company Overview
13.7.2 Financial
13.7.3 Products/ Services Offered
13.7.4 SWOT Analysis
13.8 Juniper Networks, Inc
13.8.1 Company Overview
13.8.2 Financial
13.8.3 Products/ Services Offered
13.8.4 SWOT Analysis
13.9 NEC Corporation
13.9.1 Company Overview
13.9.2 Financial
13.9.3 Products/ Services Offered
13.9.4 SWOT Analysis
13.10 Affirmed Networks
13.12.1 Company Overview
13.12.2 Financial
13.12.3 Products/ Services Offered
13.12.4 SWOT Analysis
14. Use Cases and Best Practices
15. Conclusion
An accurate research report requires proper strategizing as well as implementation. There are multiple factors involved in the completion of good and accurate research report and selecting the best methodology to compete the research is the toughest part. Since the research reports we provide play a crucial role in any company’s decision-making process, therefore we at SNS Insider always believe that we should choose the best method which gives us results closer to reality. This allows us to reach at a stage wherein we can provide our clients best and accurate investment to output ratio.
Each report that we prepare takes a timeframe of 350-400 business hours for production. Starting from the selection of titles through a couple of in-depth brain storming session to the final QC process before uploading our titles on our website we dedicate around 350 working hours. The titles are selected based on their current market cap and the foreseen CAGR and growth.
The 5 steps process:
Step 1: Secondary Research:
Secondary Research or Desk Research is as the name suggests is a research process wherein, we collect data through the readily available information. In this process we use various paid and unpaid databases which our team has access to and gather data through the same. This includes examining of listed companies’ annual reports, Journals, SEC filling etc. Apart from this our team has access to various associations across the globe across different industries. Lastly, we have exchange relationships with various university as well as individual libraries.

Step 2: Primary Research
When we talk about primary research, it is a type of study in which the researchers collect relevant data samples directly, rather than relying on previously collected data. This type of research is focused on gaining content specific facts that can be sued to solve specific problems. Since the collected data is fresh and first hand therefore it makes the study more accurate and genuine.
We at SNS Insider have divided Primary Research into 2 parts.
Part 1 wherein we interview the KOLs of major players as well as the upcoming ones across various geographic regions. This allows us to have their view over the market scenario and acts as an important tool to come closer to the accurate market numbers. As many as 45 paid and unpaid primary interviews are taken from both the demand and supply side of the industry to make sure we land at an accurate judgement and analysis of the market.
This step involves the triangulation of data wherein our team analyses the interview transcripts, online survey responses and observation of on filed participants. The below mentioned chart should give a better understanding of the part 1 of the primary interview.

Part 2: In this part of primary research the data collected via secondary research and the part 1 of the primary research is validated with the interviews from individual consultants and subject matter experts.
Consultants are those set of people who have at least 12 years of experience and expertise within the industry whereas Subject Matter Experts are those with at least 15 years of experience behind their back within the same space. The data with the help of two main processes i.e., FGDs (Focused Group Discussions) and IDs (Individual Discussions). This gives us a 3rd party nonbiased primary view of the market scenario making it a more dependable one while collation of the data pointers.
Step 3: Data Bank Validation
Once all the information is collected via primary and secondary sources, we run that information for data validation. At our intelligence centre our research heads track a lot of information related to the market which includes the quarterly reports, the daily stock prices, and other relevant information. Our data bank server gets updated every fortnight and that is how the information which we collected using our primary and secondary information is revalidated in real time.

Step 4: QA/QC Process
After all the data collection and validation our team does a final level of quality check and quality assurance to get rid of any unwanted or undesired mistakes. This might include but not limited to getting rid of the any typos, duplication of numbers or missing of any important information. The people involved in this process include technical content writers, research heads and graphics people. Once this process is completed the title gets uploader on our platform for our clients to read it.
Step 5: Final QC/QA Process:
This is the last process and comes when the client has ordered the study. In this process a final QA/QC is done before the study is emailed to the client. Since we believe in giving our clients a good experience of our research studies, therefore, to make sure that we do not lack at our end in any way humanly possible we do a final round of quality check and then dispatch the study to the client.
Key Segments:
By Component
Solutions
Orchestration and Automation
Services
By Virtualized Network Functions
Compute
Storage
Network
By Application
Virtual Appliance
Core Network
By Organization Size
Small and Medium-sized Enterprises
Large Enterprises
By End Users
Service Providers
Data Centers
Enterprises
Request for Segment Customization as per your Business Requirement: Segment Customization Request
REGIONAL COVERAGE:
North America
US
Canada
Mexico
Europe
Eastern Europe
Poland
Romania
Hungary
Turkey
Rest of Eastern Europe
Western Europe
Germany
France
UK
Italy
Spain
Netherlands
Switzerland
Austria
Rest of Western Europe
Asia Pacific
China
India
Japan
South Korea
Vietnam
Singapore
Australia
Rest of Asia Pacific
Middle East & Africa
Middle East
UAE
Egypt
Saudi Arabia
Qatar
Rest of the Middle East
Africa
Nigeria
South Africa
Rest of Africa
Latin America
Brazil
Argentina
Colombia
Rest of Latin America
Request for Country Level Research Report: Country Level Customization Request
Available Customization
With the given market data, SNS Insider offers customization as per the company’s specific needs. The following customization options are available for the report:
Product Analysis
Criss-Cross segment analysis (e.g. Product X Application)
Product Matrix which gives a detailed comparison of the product portfolio of each company
Geographic Analysis
Additional countries in any of the regions
Company Information
Detailed analysis and profiling of additional market players (Up to five)
The IoT Telecom Services Market was valued at USD 30.55 billion in 2023 and is expected to reach USD 390.86 billion by 2032, growing at a CAGR of 32.78% over the forecast period 2024-2032.
Document Capture Software Market was valued at USD 18.33 billion in 2023 and is expected to reach USD 39.59 billion by 2032, growing at a CAGR of 8.99% from 2024-2032.
Server Market was valued at USD 111.60 billion in 2023 and is expected to reach USD 224.90 billion by 2032, growing at a CAGR of 8.14% from 2024-2032.
The Freelance Platforms Market was valued at USD 5.2 billion in 2023 and is expected to reach USD 21.6 billion by 2032, growing at a CAGR of 17.18% by 2032.
The IoT Professional Services Market was valued at USD 120.4 Billion in 2023 and will reach USD 226.8 Billion by 2032, growing at a CAGR of 7.30% by 2032.
3D Printing Market Size was valued at USD 21.1 billion in 2023 and is expected to reach USD 118.9 billion by 2032, growing at a CAGR of 21.2 % over the forecast period 2024-2032.

Hi! Click one of our member below to chat on Phone
© 2025 All Rights Reserved by SNS Insider Pvt Ltd


