image

Net-Zero Energy Buildings Market Report Scope & Overview:

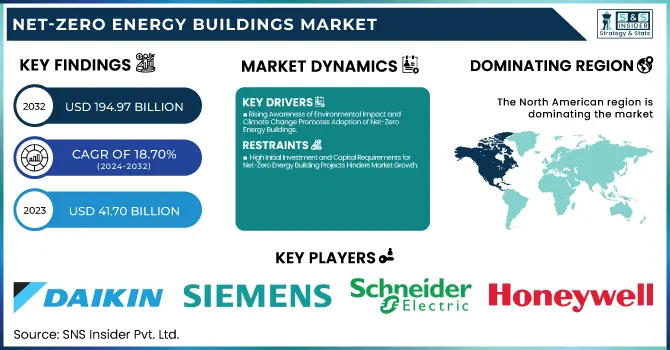
The Net-Zero Energy Buildings Market size was valued at USD 41.70 Billion in 2023 and is expected to reach USD 194.97 Billion by 2032, growing at a CAGR of 18.70% over the forecast period 2024-2032.

This research report covers significant areas such as cost analysis comparing NZEBs with conventional buildings, the policies and incentives of regional governments, investment trends in the industry, consumer awareness and the perception of net-zero technologies, and a lifecycle assessment of Net-Zero Energy Building's long-term benefits. It also focuses on the construction and maintenance cost trends as valuable information for cost-effective solutions and regional variations shaping the future of the market.

Market Dynamics

Drivers

  • Rising Awareness of Environmental Impact and Climate Change Promotes Adoption of Net-Zero Energy Buildings

The shift to Net-Zero Energy Buildings is primarily fueled by the increased global interest in climate change mitigation. With sustainability on the priority lists of governments, corporations, and consumers alike, energy efficiency solutions in construction and renovation are increasingly in demand. Net-Zero Energy Buildings have emerged as one of the best solutions to decrease carbon footprints to significantly long-term environmentally-friendly measures. Elevated environmental awareness is slowly cultivating investment in green building technologies that provide support in developing energy-efficient materials, renewable energy systems, and advanced building management technologies. Consumers and companies are willing to adhere more stringently to environmental regulatory requirements and sustainability targets because Net-Zero Energy Buildings represent an attractive solution in compliance with international efforts aimed at reducing carbon emissions.

Restraints

  • High Initial Investment and Capital Requirements for Net-Zero Energy Building Projects Hinders Market Growth

High upfront investment in construction and retrofitting is one of the major restraints that slow down the growth of the Net-Zero Energy Buildings market. Net-Zero Energy Buildings require advanced technologies, including energy-efficient insulation, renewable energy systems, and sophisticated energy management tools, which contribute to higher upfront costs compared to traditional buildings. Although these investments result in long-term savings through reduced consumption of energy, capital expenditures formed at the initial stage remain the hurdle for most developers and property owners. This financial constraint is quite a challenge for small-scale projects or locations with fewer provisions of funding and financial incentives in bringing about widespread uptake of Net-Zero Energy Buildings.

Opportunities

  • Growth in Retrofit Market for Existing Buildings Presents Significant Expansion Potential for Net-Zero Energy Solutions

An emerging opportunity in the Net-Zero Energy Buildings market is through retrofitting older buildings to become net-zero energy. A major portion of the global building stock is older, and inefficient, and thus holds enormous potential for upgrade to improve their energy performance. Retrofitting will be a much cheaper and less disruptive alternative compared to building an entirely new Net-Zero Energy Building. Governments, as well as property owners, are making bigger investments into retrofitting programs, sustained by the availability of financial incentives and subsidies for energy-efficient upgrades. This is a huge market opportunity for firms providing retrofitting technologies, energy-efficient materials, and integration of renewable energy solutions.

Challenge

  • Balancing Cost-Effectiveness with High Performance Remains a Key Challenge for Net-Zero Energy Buildings Implementation

Cost-effectiveness and high performance are two key challenges that will face the market of Net-Zero Energy Buildings. Long-term energy savings, as well as environmental benefits, are possible with Net-Zero Energy Buildings, but such buildings are initially expensive to build and integrate because of the various energy-efficient systems. Achieving high energy performance without a tremendous increase in costs is a highly complex challenge. The rapid growth of technology creates uncertainty about what investments will produce the best return in terms of long-term energy efficiency. In this regard, developers and owners of properties face the challenge of ensuring that the Net-Zero Energy Buildings will be financially sound and effective at achieving net-zero energy consumption.

Segmentation Analysis

By Component          

Energy Storage Systems dominated the Net-Zero Energy Buildings Market in 2023 and accounted for the maximum market share of around 30%. Energy storage systems are of prime importance in Net-Zero Energy Buildings since they enable proper management of renewable energy, mainly when integrating the intermittent sources, such as solar and wind energy. In 2023, the demand for energy storage solutions increased due to the development in battery technologies such as lithium-ion and solid-state batteries. These systems store extra energy generated in the daytime to use later. The buildings stay energy-efficient and self-sufficient this way. The U.S. Department of Energy, as well as many other governments and organizations, has been encouraging energy storage as part of broader goals on energy efficiency and sustainability. In response, companies like Tesla and Siemens have diversified their offerings to include more energy storage products.

By Building Type

In 2023, Residential buildings dominated the Net-Zero Energy Buildings market and accounted for a market share of around 40%. The biggest driver for the Net-Zero Energy Buildings market was the residential sector, mainly on account of ever-growing consumer interest in sustainable ways of living. Homeowners nowadays are in growing demand for more energy-efficient houses that reduce the utility cost associated with the built environment and thereby reduce their negative impact on the environment. Government policies, including the promotion of green building certifications like LEED, have made the same the more significant contributor to this trend. For instance, U.S. Energy Star-initiated programs provide rebates and incentives to homeowners to implement energy-efficient technologies, which has forced the growth of Net-Zero homes in the market.

By Technology

Solar Energy dominated and accounted for the largest share of 45% in the Net-Zero Energy Buildings Market in 2023. The share of solar energy has dominated the Net-Zero Energy Buildings market by almost half due to declining prices of solar panels and the wide implementation of photovoltaic (PV) systems in residential and commercial buildings. In general, it is one of the prime enabling technologies that contribute to net-zero energy consumption. Solar technology represents a source of renewable energy harnessed directly from sunlight. Governments have been offering financial incentives and tax credits for solar installations to accelerate the deployment of solar-powered Net-Zero Energy Buildings across the world, including the European Union and the United States. Companies like SunPower and First Solar are leading the market with advanced, efficient solar panel solutions.

By End-Use

New Construction dominated the Net-Zero Energy Buildings Market in 2023, accounting for 55% of the market share. The market shares of the Net-Zero Energy Buildings market are relatively higher due to the rise in the trend of designing and constructing energy-efficient structures from scratch. Developers and builders are seeking to build sustainable buildings that can meet stringent energy performance standards from the ground up. For example, such initiatives as "Net Zero Energy Building" run by the United States Department of Energy outline principles and funding available for building new net zero energy consumption structures. Regulations along with these funds foster new and green building initiatives as the whole building construction and refurbishment works for achieving maximum sustainability in all directions.

Regional Analysis

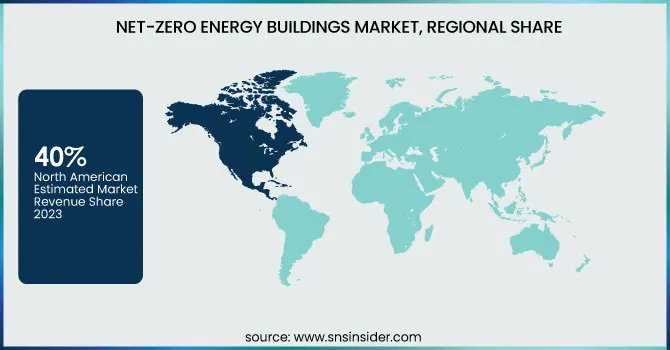
The North American region dominated the Net-Zero Energy Buildings Market and held approximately 40% of the market share in the year 2023. Due to the increase in the United States of America and Canada towards sustainability and energy efficiency, North America has accounted for the highest share in the global Net-Zero Energy Buildings market. In the United States particularly, the Energy Star program and tax benefits for solar installations have spurred demand for Net-Zero homes. For example, California is a major contributor, where the state has made all new homes Net-Zero household by 2025 mandatory and it is turning into a driving force for demand. Furthermore, initiatives like the Investment Tax Credit (ITC) run by the U.S. government that work toward advancing clean energy options in buildings have played a role in helping North America take the lead in this space. Canada, which puts a huge emphasis on green building certifications such as LEED, comes next and the region will see a further increase in its market share due to energy-efficient construction. Furthermore, big players including Tesla, Johnson Controls and Honeywell participate extensively in the region and accelerate the advancement of energy storage and energy-efficient building products.

Moreover, the Asia Pacific region emerged as the fastest growing region for the Net-Zero Energy Buildings Market with an approximate CAGR of 18% in the forecast period. It is led by increasing urbanization, government initiatives, and energy demands. China and India are the major players in this sector, making considerable progress toward the adoption of green building technologies. For example, China's 13th Five-Year Plan focuses on green building standards, and the country is actively pursuing net-zero energy buildings in its smart city projects. India is increasingly seeing Net-Zero homes and commercial buildings attributed to the likes of the Smart Cities Mission-a mission that fosters sustainable development in urban communities. Other than this, some countries like Japan, South Korea, and Singapore are setting lofty targets for buildings to be 'energy-efficient and are offering considerable financial incentives as well for its green building projects. Growth in demand for renewable energy technologies, including solar and wind power, coupled with strong government support, is likely to drive the region through progress in the Net-Zero Energy Buildings market. A stellar CAGR for the Asia Pacific market indicates the region has the potential to become a leader in years ahead as these initiatives continue to grow.

Key Players

  • Daikin Industries Ltd. (VRV Heat Recovery System, Altherma Heat Pump)

  • General Electric Company (GE Solar Inverters, LED Lighting Solutions)

  • Siemens AG (Desigo CC Building Management System, GAMMA KNX Smart Building Technology)

  • Schneider Electric SE (EcoStruxure Microgrid, Wiser Energy Management System)

  • Honeywell International Inc. (Forge Energy Optimization, Solstice N41 Refrigerant)

  • Johnson Controls International plc (Metasys Building Automation System, YORK Absorption Chillers)

  • Kingspan Group Plc (QuadCore Insulated Panels, Kooltherm Insulation Boards)

  • Canadian Solar Inc. (HiKu Solar Panels, BiHiKu Bifacial Modules)

  • Rockwool Group (Rockpanel Facade Boards, Rockwool Thermal Insulation)

  • SunPower Corporation (Total SE) (Maxeon Solar Panels, Performance Series Modules)

  • Integrated Environmental Solutions Ltd. (VE Energy Modeling Software, iSCAN Building Analytics)

  • Saint-Gobain (SageGlass Dynamic Glazing, Isover Insulation Solutions)

  • Mitsubishi Electric Corporation (Ecodan Heat Pumps, CITY MULTI VRF Systems)

  • Trane Technologies PLC (Thermo King Refrigeration, Tracer SC+ Building Automation)

  • Carrier Global Corporation (AquaEdge Chillers, Infinity Heat Pump)

  • Solatube International Inc. (Brighten Up Daylighting System, Smart LED System)

  • SAGE Electrochromics Inc. (Compagnie de Saint-Gobain S.A.) (SageGlass, Harmony Electrochromic Glass)

  • Skanska AB (Deep Green Buildings, Passive House Construction)

  • Lendlease Corp (Climate Positive Buildings, Timber High-Rise Structures)

  • Panasonic Corporation (HIT Solar Panels, EverVolt Energy Storage System)

Recent Development:

  • June 2024: CREDAI collaborated with AEEE to endorse Net-Zero buildings in India, emphasizing energy efficiency and sustainable construction practices.

  • March 2024: India progressed toward its goal of having Net-Zero carbon buildings. It highlighted aspects of energy efficiency, sustainable material usage, and renewable energy utilization.

  • March 2024: Mahindra Lifespace launched Mahindra Zen in Bengaluru-the first Net-Zero waste and energy homes with features of energy efficiency.

Net-Zero Energy Buildings Market Report Scope:

Report Attributes Details
Market Size in 2023 USD 41.70 Billion
Market Size by 2032 USD 194.97 Billion
CAGR CAGR of 18.70% From 2024 to 2032
Base Year 2023
Forecast Period 2024-2032
Historical Data 2020-2022
Report Scope & Coverage Market Size, Segments Analysis, Competitive  Landscape, Regional Analysis, DROC & SWOT Analysis, Forecast Outlook
Key Segments •By Component (Building Envelope, HVAC Systems, Lighting Systems, Energy Storage Systems, Others)
•By Building Type (Residential, Commercial, Industrial)
•By Technology (Solar Energy, Wind Energy, Geothermal Energy, Biomass Energy, Others)
•By End-Use (New Construction, Renovation & Retrofitting)
Regional Analysis/Coverage North America (US, Canada, Mexico), Europe (Eastern Europe [Poland, Romania, Hungary, Turkey, Rest of Eastern Europe] Western Europe] Germany, France, UK, Italy, Spain, Netherlands, Switzerland, Austria, Rest of Western Europe]), Asia Pacific (China, India, Japan, South Korea, Vietnam, Singapore, Australia, Rest of Asia Pacific), Middle East & Africa (Middle East [UAE, Egypt, Saudi Arabia, Qatar, Rest of Middle East], Africa [Nigeria, South Africa, Rest of Africa], Latin America (Brazil, Argentina, Colombia, Rest of Latin America)
Company Profiles Daikin Industries Ltd., General Electric Company, Siemens AG, Schneider Electric SE, Honeywell International Inc., Johnson Controls International plc, Kingspan Group Plc, Canadian Solar Inc., Rockwool Group, SunPower Corporation and other key players

Frequently Asked Questions

Ans: The market size of the Net-Zero Energy Buildings market was valued at USD 41.70 billion in 2023.

Ans: The market is expected to reach USD 194.97 billion by 2032.

Ans: The Net-Zero Energy Buildings market is projected to grow at a CAGR of 18.70% from 2024 to 2032.

Ans: Energy Storage Systems dominated the market in 2023, accounting for around 30% of the market share.

Ans: North America held approximately 40% of the market share in 2023.

Table of Contents

1. Introduction

1.1 Market Definition

1.2 Scope (Inclusion and Exclusions)

1.3 Research Assumptions

2. Executive Summary

2.1 Market Overview

2.2 Regional Synopsis

2.3 Competitive Summary

3. Research Methodology

3.1 Top-Down Approach

3.2 Bottom-up Approach

3.3. Data Validation

3.4 Primary Interviews

4. Market Dynamics Impact Analysis

4.1 Market Driving Factors Analysis

4.1.1 Drivers

4.1.2 Restraints

4.1.3 Opportunities

4.1.4 Challenges

4.2 PESTLE Analysis

4.3 Porter’s Five Forces Model

5. Statistical Insights and Trends Reporting

5.1 Cost Analysis: Net-Zero vs. Conventional Buildings

5.2 Government Policies & Incentives by Region

5.3 Industry Investment & Funding Trends

5.4 Consumer Awareness & Perception Surveys

5.5 Lifecycle Assessment of Net-Zero Buildings

5.6 Construction & Maintenance Cost Trends

6. Competitive Landscape

6.1 List of Major Companies, By Region

6.2 Market Share Analysis, By Region

6.3 Product Benchmarking

6.3.1 Product specifications and features

6.3.2 Pricing

6.4 Strategic Initiatives

6.4.1 Marketing and promotional activities

6.4.2 Distribution and supply chain strategies

6.4.3 Expansion plans and new product launches

6.4.4 Strategic partnerships and collaborations

6.5 Technological Advancements

6.6 Market Positioning and Branding

7. Net-Zero Energy Buildings Market Segmentation, by Component

7.1 Chapter Overview

7.2 Building Envelope

7.2.1 Building Envelope Market Trends Analysis (2020-2032)

7.2.2 Building Envelope Market Size Estimates and Forecasts to 2032 (USD Billion)

7.3 HVAC Systems

7.3.1 HVAC Systems Market Trends Analysis (2020-2032)

7.3.2 HVAC Systems Market Size Estimates and Forecasts to 2032 (USD Billion)

7.4 Lighting Systems

7.4.1 Lighting Systems Market Trends Analysis (2020-2032)

7.4.2 Lighting Systems Market Size Estimates and Forecasts to 2032 (USD Billion)

7.5 Energy Storage Systems

7.5.1 Energy Storage Systems Market Trends Analysis (2020-2032)

7.5.2 Energy Storage Systems Market Size Estimates and Forecasts to 2032 (USD Billion)

7.6 Others

7.6.1 Others Market Trends Analysis (2020-2032)

7.6.2 Others Market Size Estimates and Forecasts to 2032 (USD Billion)

8. Net-Zero Energy Buildings Market Segmentation, by Building Type

8.1 Chapter Overview

8.2 Residential

8.2.1 Residential Market Trends Analysis (2020-2032)

8.2.2 Residential Market Size Estimates and Forecasts to 2032 (USD Billion)

8.3 Commercial

8.3.1 Commercial Market Trends Analysis (2020-2032)

8.3.2 Commercial Market Size Estimates and Forecasts to 2032 (USD Billion)

8.4 Industrial

8.4.1 Industrial Market Trends Analysis (2020-2032)

8.4.2 Industrial Market Size Estimates and Forecasts to 2032 (USD Billion)

9. Net-Zero Energy Buildings Market Segmentation, by Technology

9.1 Chapter Overview

9.2 Solar Energy

9.2.1 Solar Energy Market Trends Analysis (2020-2032)

9.2.2 Solar Energy Market Size Estimates and Forecasts to 2032 (USD Billion)

9.3 Wind Energy

9.3.1 Wind Energy Market Trends Analysis (2020-2032)

9.3.2 Wind Energy Market Size Estimates and Forecasts to 2032 (USD Billion)

9.4 Geothermal Energy

               9.4.1 Geothermal Energy Market Trends Analysis (2020-2032)

9.4.2 Geothermal Energy Market Size Estimates and Forecasts to 2032 (USD Billion)

9.5 Biomass Energy

9.5.1 Biomass Energy Market Trends Analysis (2020-2032)

9.5.2 Biomass Energy Market Size Estimates and Forecasts to 2032 (USD Billion)

9.6 Others

9.6.1 Others Market Trends Analysis (2020-2032)

9.6.2 Others Market Size Estimates and Forecasts to 2032 (USD Billion)

10. Net-Zero Energy Buildings Market Segmentation, by End-Use

10.1 Chapter Overview

10.2 New Construction

10.2.1 New Construction Market Trends Analysis (2020-2032)

10.2.2 New Construction Market Size Estimates and Forecasts to 2032 (USD Billion)

10.3 Renovation & Retrofitting

10.3.1 Renovation & Retrofitting Market Trends Analysis (2020-2032)

10.3.2 Renovation & Retrofitting Market Size Estimates and Forecasts to 2032 (USD Billion)

11. Regional Analysis

11.1 Chapter Overview

11.2 North America

11.2.1 Trends Analysis

11.2.2 North America Net-Zero Energy Buildings Market Estimates and Forecasts, by Country (2020-2032) (USD Billion)

11.2.3 North America Net-Zero Energy Buildings Market Estimates and Forecasts, by Component (2020-2032) (USD Billion) 

11.2.4 North America Net-Zero Energy Buildings Market Estimates and Forecasts, by Building Type (2020-2032) (USD Billion)

11.2.5 North America Net-Zero Energy Buildings Market Estimates and Forecasts, by Technology (2020-2032) (USD Billion)

11.2.6 North America Net-Zero Energy Buildings Market Estimates and Forecasts, by End-Use (2020-2032) (USD Billion)

11.2.7 USA

11.2.7.1 USA Net-Zero Energy Buildings Market Estimates and Forecasts, by Component (2020-2032) (USD Billion)

11.2.7.2 USA Net-Zero Energy Buildings Market Estimates and Forecasts, by Building Type (2020-2032) (USD Billion)

11.2.7.3 USA Net-Zero Energy Buildings Market Estimates and Forecasts, by Technology (2020-2032) (USD Billion)

11.2.7.4 USA Net-Zero Energy Buildings Market Estimates and Forecasts, by End-Use (2020-2032) (USD Billion)

11.2.8 Canada

11.2.8.1 Canada Net-Zero Energy Buildings Market Estimates and Forecasts, by Component (2020-2032) (USD Billion)

11.2.8.2 Canada Net-Zero Energy Buildings Market Estimates and Forecasts, by Building Type (2020-2032) (USD Billion)

11.2.8.3 Canada Net-Zero Energy Buildings Market Estimates and Forecasts, by Technology (2020-2032) (USD Billion)

11.2.8.4 Canada Net-Zero Energy Buildings Market Estimates and Forecasts, by End-Use (2020-2032) (USD Billion)

11.2.9 Mexico

11.2.9.1 Mexico Net-Zero Energy Buildings Market Estimates and Forecasts, by Component (2020-2032) (USD Billion)

11.2.9.2 Mexico Net-Zero Energy Buildings Market Estimates and Forecasts, by Building Type (2020-2032) (USD Billion)

11.2.9.3 Mexico Net-Zero Energy Buildings Market Estimates and Forecasts, by Technology (2020-2032) (USD Billion)

11.2.9.4 Mexico Net-Zero Energy Buildings Market Estimates and Forecasts, by End-Use (2020-2032) (USD Billion)

11.3 Europe

11.3.1 Eastern Europe

11.3.1.1 Trends Analysis

11.3.1.2 Eastern Europe Net-Zero Energy Buildings Market Estimates and Forecasts, by Country (2020-2032) (USD Billion)

11.3.1.3 Eastern Europe Net-Zero Energy Buildings Market Estimates and Forecasts, by Component (2020-2032) (USD Billion) 

11.3.1.4 Eastern Europe Net-Zero Energy Buildings Market Estimates and Forecasts, by Building Type (2020-2032) (USD Billion)

11.3.1.5 Eastern Europe Net-Zero Energy Buildings Market Estimates and Forecasts, by Technology (2020-2032) (USD Billion)

11.3.1.6 Eastern Europe Net-Zero Energy Buildings Market Estimates and Forecasts, by End-Use (2020-2032) (USD Billion)

11.3.1.7 Poland

11.3.1.7.1 Poland Net-Zero Energy Buildings Market Estimates and Forecasts, by Component (2020-2032) (USD Billion)

11.3.1.7.2 Poland Net-Zero Energy Buildings Market Estimates and Forecasts, by Building Type (2020-2032) (USD Billion)

11.3.1.7.3 Poland Net-Zero Energy Buildings Market Estimates and Forecasts, by Technology (2020-2032) (USD Billion)

11.3.1.7.4 Poland Net-Zero Energy Buildings Market Estimates and Forecasts, by End-Use (2020-2032) (USD Billion)

11.3.1.8 Romania

11.3.1.8.1 Romania Net-Zero Energy Buildings Market Estimates and Forecasts, by Component (2020-2032) (USD Billion)

11.3.1.8.2 Romania Net-Zero Energy Buildings Market Estimates and Forecasts, by Building Type (2020-2032) (USD Billion)

11.3.1.8.3 Romania Net-Zero Energy Buildings Market Estimates and Forecasts, by Technology (2020-2032) (USD Billion)

11.3.1.8.4 Romania Net-Zero Energy Buildings Market Estimates and Forecasts, by End-Use (2020-2032) (USD Billion)

11.3.1.9 Hungary

11.3.1.9.1 Hungary Net-Zero Energy Buildings Market Estimates and Forecasts, by Component (2020-2032) (USD Billion)

11.3.1.9.2 Hungary Net-Zero Energy Buildings Market Estimates and Forecasts, by Building Type (2020-2032) (USD Billion)

11.3.1.9.3 Hungary Net-Zero Energy Buildings Market Estimates and Forecasts, by Technology (2020-2032) (USD Billion)

11.3.1.9.4 Hungary Net-Zero Energy Buildings Market Estimates and Forecasts, by End-Use (2020-2032) (USD Billion)

11.3.1.10 Turkey

11.3.1.10.1 Turkey Net-Zero Energy Buildings Market Estimates and Forecasts, by Component (2020-2032) (USD Billion)

11.3.1.10.2 Turkey Net-Zero Energy Buildings Market Estimates and Forecasts, by Building Type (2020-2032) (USD Billion)

11.3.1.10.3 Turkey Net-Zero Energy Buildings Market Estimates and Forecasts, by Technology (2020-2032) (USD Billion)

11.3.1.10.4 Turkey Net-Zero Energy Buildings Market Estimates and Forecasts, by End-Use (2020-2032) (USD Billion)

11.3.1.11 Rest of Eastern Europe

11.3.1.11.1 Rest of Eastern Europe Net-Zero Energy Buildings Market Estimates and Forecasts, by Component (2020-2032) (USD Billion)

11.3.1.11.2 Rest of Eastern Europe Net-Zero Energy Buildings Market Estimates and Forecasts, by Building Type (2020-2032) (USD Billion)

11.3.1.11.3 Rest of Eastern Europe Net-Zero Energy Buildings Market Estimates and Forecasts, by Technology (2020-2032) (USD Billion)

11.3.1.11.4 Rest of Eastern Europe Net-Zero Energy Buildings Market Estimates and Forecasts, by End-Use (2020-2032) (USD Billion)

11.3.2 Western Europe

11.3.2.1 Trends Analysis

11.3.2.2 Western Europe Net-Zero Energy Buildings Market Estimates and Forecasts, by Country (2020-2032) (USD Billion)

11.3.2.3 Western Europe Net-Zero Energy Buildings Market Estimates and Forecasts, by Component (2020-2032) (USD Billion) 

11.3.2.4 Western Europe Net-Zero Energy Buildings Market Estimates and Forecasts, by Building Type (2020-2032) (USD Billion)

11.3.2.5 Western Europe Net-Zero Energy Buildings Market Estimates and Forecasts, by Technology (2020-2032) (USD Billion)

11.3.2.6 Western Europe Net-Zero Energy Buildings Market Estimates and Forecasts, by End-Use (2020-2032) (USD Billion)

11.3.2.7 Germany

11.3.2.7.1 Germany Net-Zero Energy Buildings Market Estimates and Forecasts, by Component (2020-2032) (USD Billion)

11.3.2.7.2 Germany Net-Zero Energy Buildings Market Estimates and Forecasts, by Building Type (2020-2032) (USD Billion)

11.3.2.7.3 Germany Net-Zero Energy Buildings Market Estimates and Forecasts, by Technology (2020-2032) (USD Billion)

11.3.2.7.4 Germany Net-Zero Energy Buildings Market Estimates and Forecasts, by End-Use (2020-2032) (USD Billion)

11.3.2.8 France

11.3.2.8.1 France Net-Zero Energy Buildings Market Estimates and Forecasts, by Component (2020-2032) (USD Billion)

11.3.2.8.2 France Net-Zero Energy Buildings Market Estimates and Forecasts, by Building Type (2020-2032) (USD Billion)

11.3.2.8.3 France Net-Zero Energy Buildings Market Estimates and Forecasts, by Technology (2020-2032) (USD Billion)

11.3.2.8.4 France Net-Zero Energy Buildings Market Estimates and Forecasts, by End-Use (2020-2032) (USD Billion)

11.3.2.9 UK

11.3.2.9.1 UK Net-Zero Energy Buildings Market Estimates and Forecasts, by Component (2020-2032) (USD Billion)

11.3.2.9.2 UK Net-Zero Energy Buildings Market Estimates and Forecasts, by Building Type (2020-2032) (USD Billion)

11.3.2.9.3 UK Net-Zero Energy Buildings Market Estimates and Forecasts, by Technology (2020-2032) (USD Billion)

11.3.2.9.4 UK Net-Zero Energy Buildings Market Estimates and Forecasts, by End-Use (2020-2032) (USD Billion)

11.3.2.10 Italy

11.3.2.10.1 Italy Net-Zero Energy Buildings Market Estimates and Forecasts, by Component (2020-2032) (USD Billion)

11.3.2.10.2 Italy Net-Zero Energy Buildings Market Estimates and Forecasts, by Building Type (2020-2032) (USD Billion)

11.3.2.10.3 Italy Net-Zero Energy Buildings Market Estimates and Forecasts, by Technology (2020-2032) (USD Billion)

11.3.2.10.4 Italy Net-Zero Energy Buildings Market Estimates and Forecasts, by End-Use (2020-2032) (USD Billion)

11.3.2.11 Spain

11.3.2.11.1 Spain Net-Zero Energy Buildings Market Estimates and Forecasts, by Component (2020-2032) (USD Billion)

11.3.2.11.2 Spain Net-Zero Energy Buildings Market Estimates and Forecasts, by Building Type (2020-2032) (USD Billion)

11.3.2.11.3 Spain Net-Zero Energy Buildings Market Estimates and Forecasts, by Technology (2020-2032) (USD Billion)

11.3.2.11.4 Spain Net-Zero Energy Buildings Market Estimates and Forecasts, by End-Use (2020-2032) (USD Billion)

11.3.2.12 Netherlands

11.3.2.12.1 Netherlands Net-Zero Energy Buildings Market Estimates and Forecasts, by Component (2020-2032) (USD Billion)

11.3.2.12.2 Netherlands Net-Zero Energy Buildings Market Estimates and Forecasts, by Building Type (2020-2032) (USD Billion)

11.3.2.12.3 Netherlands Net-Zero Energy Buildings Market Estimates and Forecasts, by Technology (2020-2032) (USD Billion)

11.3.2.12.4 Netherlands Net-Zero Energy Buildings Market Estimates and Forecasts, by End-Use (2020-2032) (USD Billion)

11.3.2.13 Switzerland

11.3.2.13.1 Switzerland Net-Zero Energy Buildings Market Estimates and Forecasts, by Component (2020-2032) (USD Billion)

11.3.2.13.2 Switzerland Net-Zero Energy Buildings Market Estimates and Forecasts, by Building Type (2020-2032) (USD Billion)

11.3.2.13.3 Switzerland Net-Zero Energy Buildings Market Estimates and Forecasts, by Technology (2020-2032) (USD Billion)

11.3.2.13.4 Switzerland Net-Zero Energy Buildings Market Estimates and Forecasts, by End-Use (2020-2032) (USD Billion)

11.3.2.14 Austria

11.3.2.14.1 Austria Net-Zero Energy Buildings Market Estimates and Forecasts, by Component (2020-2032) (USD Billion)

11.3.2.14.2 Austria Net-Zero Energy Buildings Market Estimates and Forecasts, by Building Type (2020-2032) (USD Billion)

11.3.2.14.3 Austria Net-Zero Energy Buildings Market Estimates and Forecasts, by Technology (2020-2032) (USD Billion)

11.3.2.14.4 Austria Net-Zero Energy Buildings Market Estimates and Forecasts, by End-Use (2020-2032) (USD Billion)

11.3.2.15 Rest of Western Europe

11.3.2.15.1 Rest of Western Europe Net-Zero Energy Buildings Market Estimates and Forecasts, by Component (2020-2032) (USD Billion)

11.3.2.15.2 Rest of Western Europe Net-Zero Energy Buildings Market Estimates and Forecasts, by Building Type (2020-2032) (USD Billion)

11.3.2.15.3 Rest of Western Europe Net-Zero Energy Buildings Market Estimates and Forecasts, by Technology (2020-2032) (USD Billion)

11.3.2.15.4 Rest of Western Europe Net-Zero Energy Buildings Market Estimates and Forecasts, by End-Use (2020-2032) (USD Billion)

11.4 Asia Pacific

11.4.1 Trends Analysis

11.4.2 Asia Pacific Net-Zero Energy Buildings Market Estimates and Forecasts, by Country (2020-2032) (USD Billion)

11.4.3 Asia Pacific Net-Zero Energy Buildings Market Estimates and Forecasts, by Component (2020-2032) (USD Billion) 

11.4.4 Asia Pacific Net-Zero Energy Buildings Market Estimates and Forecasts, by Building Type (2020-2032) (USD Billion)

11.4.5 Asia Pacific Net-Zero Energy Buildings Market Estimates and Forecasts, by Technology (2020-2032) (USD Billion)

11.4.6 Asia Pacific Net-Zero Energy Buildings Market Estimates and Forecasts, by End-Use (2020-2032) (USD Billion)

11.4.7 China

11.4.7.1 China Net-Zero Energy Buildings Market Estimates and Forecasts, by Component (2020-2032) (USD Billion)

11.4.7.2 China Net-Zero Energy Buildings Market Estimates and Forecasts, by Building Type (2020-2032) (USD Billion)

11.4.7.3 China Net-Zero Energy Buildings Market Estimates and Forecasts, by Technology (2020-2032) (USD Billion)

11.4.7.4 China Net-Zero Energy Buildings Market Estimates and Forecasts, by End-Use (2020-2032) (USD Billion)

11.4.8 India

11.4.8.1 India Net-Zero Energy Buildings Market Estimates and Forecasts, by Component (2020-2032) (USD Billion)

11.4.8.2 India Net-Zero Energy Buildings Market Estimates and Forecasts, by Building Type (2020-2032) (USD Billion)

11.4.8.3 India Net-Zero Energy Buildings Market Estimates and Forecasts, by Technology (2020-2032) (USD Billion)

11.4.8.4 India Net-Zero Energy Buildings Market Estimates and Forecasts, by End-Use (2020-2032) (USD Billion)

11.4.9 Japan

11.4.9.1 Japan Net-Zero Energy Buildings Market Estimates and Forecasts, by Component (2020-2032) (USD Billion)

11.4.9.2 Japan Net-Zero Energy Buildings Market Estimates and Forecasts, by Building Type (2020-2032) (USD Billion)

11.4.9.3 Japan Net-Zero Energy Buildings Market Estimates and Forecasts, by Technology (2020-2032) (USD Billion)

11.4.9.4 Japan Net-Zero Energy Buildings Market Estimates and Forecasts, by End-Use (2020-2032) (USD Billion)

11.4.10 South Korea

11.4.10.1 South Korea Net-Zero Energy Buildings Market Estimates and Forecasts, by Component (2020-2032) (USD Billion)

11.4.10.2 South Korea Net-Zero Energy Buildings Market Estimates and Forecasts, by Building Type (2020-2032) (USD Billion)

11.4.10.3 South Korea Net-Zero Energy Buildings Market Estimates and Forecasts, by Technology (2020-2032) (USD Billion)

11.4.10.4 South Korea Net-Zero Energy Buildings Market Estimates and Forecasts, by End-Use (2020-2032) (USD Billion)

11.4.11 Vietnam

11.4.11.1 Vietnam Net-Zero Energy Buildings Market Estimates and Forecasts, by Component (2020-2032) (USD Billion)

11.4.11.2 Vietnam Net-Zero Energy Buildings Market Estimates and Forecasts, by Building Type (2020-2032) (USD Billion)

11.4.11.3 Vietnam Net-Zero Energy Buildings Market Estimates and Forecasts, by Technology (2020-2032) (USD Billion)

11.4.11.4 Vietnam Net-Zero Energy Buildings Market Estimates and Forecasts, by End-Use (2020-2032) (USD Billion)

11.4.12 Singapore

11.4.12.1 Singapore Net-Zero Energy Buildings Market Estimates and Forecasts, by Component (2020-2032) (USD Billion)

11.4.12.2 Singapore Net-Zero Energy Buildings Market Estimates and Forecasts, by Building Type (2020-2032) (USD Billion)

11.4.12.3 Singapore Net-Zero Energy Buildings Market Estimates and Forecasts, by Technology (2020-2032) (USD Billion)

11.4.12.4 Singapore Net-Zero Energy Buildings Market Estimates and Forecasts, by End-Use (2020-2032) (USD Billion)

11.4.13 Australia

11.4.13.1 Australia Net-Zero Energy Buildings Market Estimates and Forecasts, by Component (2020-2032) (USD Billion)

11.4.13.2 Australia Net-Zero Energy Buildings Market Estimates and Forecasts, by Building Type (2020-2032) (USD Billion)

11.4.13.3 Australia Net-Zero Energy Buildings Market Estimates and Forecasts, by Technology (2020-2032) (USD Billion)

11.4.13.4 Australia Net-Zero Energy Buildings Market Estimates and Forecasts, by End-Use (2020-2032) (USD Billion)

11.4.14 Rest of Asia Pacific

11.4.14.1 Rest of Asia Pacific Net-Zero Energy Buildings Market Estimates and Forecasts, by Component (2020-2032) (USD Billion)

11.4.14.2 Rest of Asia Pacific Net-Zero Energy Buildings Market Estimates and Forecasts, by Building Type (2020-2032) (USD Billion)

11.4.14.3 Rest of Asia Pacific Net-Zero Energy Buildings Market Estimates and Forecasts, by Technology (2020-2032) (USD Billion)

11.4.14.4 Rest of Asia Pacific Net-Zero Energy Buildings Market Estimates and Forecasts, by End-Use (2020-2032) (USD Billion)

11.5 Middle East and Africa

11.5.1 Middle East

11.5.1.1 Trends Analysis

11.5.1.2 Middle East Net-Zero Energy Buildings Market Estimates and Forecasts, by Country (2020-2032) (USD Billion)

11.5.1.3 Middle East Net-Zero Energy Buildings Market Estimates and Forecasts, by Component (2020-2032) (USD Billion) 

11.5.1.4 Middle East Net-Zero Energy Buildings Market Estimates and Forecasts, by Building Type (2020-2032) (USD Billion)

11.5.1.5 Middle East Net-Zero Energy Buildings Market Estimates and Forecasts, by Technology (2020-2032) (USD Billion)

11.5.1.6 Middle East Net-Zero Energy Buildings Market Estimates and Forecasts, by End-Use (2020-2032) (USD Billion)

11.5.1.7 UAE

11.5.1.7.1 UAE Net-Zero Energy Buildings Market Estimates and Forecasts, by Component (2020-2032) (USD Billion)

11.5.1.7.2 UAE Net-Zero Energy Buildings Market Estimates and Forecasts, by Building Type (2020-2032) (USD Billion)

11.5.1.7.3 UAE Net-Zero Energy Buildings Market Estimates and Forecasts, by Technology (2020-2032) (USD Billion)

11.5.1.7.4 UAE Net-Zero Energy Buildings Market Estimates and Forecasts, by End-Use  (2020-2032) (USD Billion)

11.5.1.8 Egypt

11.5.1.8.1 Egypt Net-Zero Energy Buildings Market Estimates and Forecasts, by Component (2020-2032) (USD Billion)

11.5.1.8.2 Egypt Net-Zero Energy Buildings Market Estimates and Forecasts, by Building Type (2020-2032) (USD Billion)

11.5.1.8.3 Egypt Net-Zero Energy Buildings Market Estimates and Forecasts, by Technology (2020-2032) (USD Billion)

11.5.1.8.4 Egypt Net-Zero Energy Buildings Market Estimates and Forecasts, by End-Use (2020-2032) (USD Billion)

11.5.1.9 Saudi Arabia

11.5.1.9.1 Saudi Arabia Net-Zero Energy Buildings Market Estimates and Forecasts, by Component (2020-2032) (USD Billion)

11.5.1.9.2 Saudi Arabia Net-Zero Energy Buildings Market Estimates and Forecasts, by Building Type (2020-2032) (USD Billion)

11.5.1.9.3 Saudi Arabia Net-Zero Energy Buildings Market Estimates and Forecasts, by Technology (2020-2032) (USD Billion)

11.5.1.9.4 Saudi Arabia Net-Zero Energy Buildings Market Estimates and Forecasts, by End-Use (2020-2032) (USD Billion)

11.5.1.10 Qatar

11.5.1.10.1 Qatar Net-Zero Energy Buildings Market Estimates and Forecasts, by Component (2020-2032) (USD Billion)

11.5.1.10.2 Qatar Net-Zero Energy Buildings Market Estimates and Forecasts, by Building Type (2020-2032) (USD Billion)

11.5.1.10.3 Qatar Net-Zero Energy Buildings Market Estimates and Forecasts, by Technology (2020-2032) (USD Billion)

11.5.1.10.4 Qatar Net-Zero Energy Buildings Market Estimates and Forecasts, by End-Use (2020-2032) (USD Billion)

11.5.1.11 Rest of Middle East

11.5.1.11.1 Rest of Middle East Net-Zero Energy Buildings Market Estimates and Forecasts, by Component (2020-2032) (USD Billion)

11.5.1.11.2 Rest of Middle East Net-Zero Energy Buildings Market Estimates and Forecasts, by Building Type (2020-2032) (USD Billion)

11.5.1.11.3 Rest of Middle East Net-Zero Energy Buildings Market Estimates and Forecasts, by Technology (2020-2032) (USD Billion)

11.5.1.11.4 Rest of Middle East Net-Zero Energy Buildings Market Estimates and Forecasts, by End-Use (2020-2032) (USD Billion)

11.5.2 Africa

11.5.2.1 Trends Analysis

11.5.2.2 Africa Net-Zero Energy Buildings Market Estimates and Forecasts, by Country (2020-2032) (USD Billion)

11.5.2.3 Africa Net-Zero Energy Buildings Market Estimates and Forecasts, by Component (2020-2032) (USD Billion) 

11.5.2.4 Africa Net-Zero Energy Buildings Market Estimates and Forecasts, by Building Type (2020-2032) (USD Billion)

11.5.2.5 Africa Net-Zero Energy Buildings Market Estimates and Forecasts, by Technology (2020-2032) (USD Billion)

11.5.2.6 Africa Net-Zero Energy Buildings Market Estimates and Forecasts, by End-Use (2020-2032) (USD Billion)

11.5.2.7 South Africa

11.5.2.7.1 South Africa Net-Zero Energy Buildings Market Estimates and Forecasts, by Component (2020-2032) (USD Billion)

11.5.2.7.2 South Africa Net-Zero Energy Buildings Market Estimates and Forecasts, by Building Type (2020-2032) (USD Billion)

11.5.2.7.3 South Africa Net-Zero Energy Buildings Market Estimates and Forecasts, by Technology (2020-2032) (USD Billion)

11.5.2.7.4 South Africa Net-Zero Energy Buildings Market Estimates and Forecasts, by End-Use (2020-2032) (USD Billion)

11.5.2.8 Nigeria

11.5.2.8.1 Nigeria Net-Zero Energy Buildings Market Estimates and Forecasts, by Component (2020-2032) (USD Billion)

11.5.2.8.2 Nigeria Net-Zero Energy Buildings Market Estimates and Forecasts, by Building Type (2020-2032) (USD Billion)

11.5.2.8.3 Nigeria Net-Zero Energy Buildings Market Estimates and Forecasts, by Technology (2020-2032) (USD Billion)

11.5.2.8.4 Nigeria Net-Zero Energy Buildings Market Estimates and Forecasts, by End-Use (2020-2032) (USD Billion)

11.5.2.9 Rest of Africa

11.5.2.9.1 Rest of Africa Net-Zero Energy Buildings Market Estimates and Forecasts, by Component (2020-2032) (USD Billion)

11.5.2.9.2 Rest of Africa Net-Zero Energy Buildings Market Estimates and Forecasts, by Building Type (2020-2032) (USD Billion)

11.5.2.9.3 Rest of Africa Net-Zero Energy Buildings Market Estimates and Forecasts, by Technology (2020-2032) (USD Billion)

11.5.2.9.4 Rest of Africa Net-Zero Energy Buildings Market Estimates and Forecasts, by End-Use (2020-2032) (USD Billion)

11.6 Latin America

11.6.1 Trends Analysis

11.6.2 Latin America Net-Zero Energy Buildings Market Estimates and Forecasts, by Country (2020-2032) (USD Billion)

11.6.3 Latin America Net-Zero Energy Buildings Market Estimates and Forecasts, by Component (2020-2032) (USD Billion) 

11.6.4 Latin America Net-Zero Energy Buildings Market Estimates and Forecasts, by Building Type (2020-2032) (USD Billion)

11.6.5 Latin America Net-Zero Energy Buildings Market Estimates and Forecasts, by Technology (2020-2032) (USD Billion)

11.6.6 Latin America Net-Zero Energy Buildings Market Estimates and Forecasts, by End-Use (2020-2032) (USD Billion)

11.6.7 Brazil

11.6.7.1 Brazil Net-Zero Energy Buildings Market Estimates and Forecasts, by Component (2020-2032) (USD Billion)

11.6.7.2 Brazil Net-Zero Energy Buildings Market Estimates and Forecasts, by Building Type (2020-2032) (USD Billion)

11.6.7.3 Brazil Net-Zero Energy Buildings Market Estimates and Forecasts, by Technology (2020-2032) (USD Billion)

11.6.7.4 Brazil Net-Zero Energy Buildings Market Estimates and Forecasts, by End-Use (2020-2032) (USD Billion)

11.6.8 Argentina

11.6.8.1 Argentina Net-Zero Energy Buildings Market Estimates and Forecasts, by Component (2020-2032) (USD Billion)

11.6.8.2 Argentina Net-Zero Energy Buildings Market Estimates and Forecasts, by Building Type (2020-2032) (USD Billion)

11.6.8.3 Argentina Net-Zero Energy Buildings Market Estimates and Forecasts, by Technology (2020-2032) (USD Billion)

11.6.8.4 Argentina Net-Zero Energy Buildings Market Estimates and Forecasts, by End-Use (2020-2032) (USD Billion)

11.6.9 Colombia

11.6.9.1 Colombia Net-Zero Energy Buildings Market Estimates and Forecasts, by Component (2020-2032) (USD Billion)

11.6.9.2 Colombia Net-Zero Energy Buildings Market Estimates and Forecasts, by Building Type (2020-2032) (USD Billion)

11.6.9.3 Colombia Net-Zero Energy Buildings Market Estimates and Forecasts, by Technology (2020-2032) (USD Billion)

11.6.9.4 Colombia Net-Zero Energy Buildings Market Estimates and Forecasts, by End-Use (2020-2032) (USD Billion)

11.6.10 Rest of Latin America

11.6.10.1 Rest of Latin America Net-Zero Energy Buildings Market Estimates and Forecasts, by Component (2020-2032) (USD Billion)

11.6.10.2 Rest of Latin America Net-Zero Energy Buildings Market Estimates and Forecasts, by Building Type (2020-2032) (USD Billion)

11.6.10.3 Rest of Latin America Net-Zero Energy Buildings Market Estimates and Forecasts, by Technology (2020-2032) (USD Billion)

11.6.10.4 Rest of Latin America Net-Zero Energy Buildings Market Estimates and Forecasts, by End-Use (2020-2032) (USD Billion)

12. Company Profiles

12.1 Daikin Industries Ltd.

12.1.1 Company Overview

12.1.2 Financial

12.1.3 Products/ Services Offered

12.1.4 SWOT Analysis

12.2 General Electric Company

12.2.1 Company Overview

12.2.2 Financial

12.2.3 Products/ Services Offered

12.2.4 SWOT Analysis

12.3 Siemens AG

12.3.1 Company Overview

12.3.2 Financial

12.3.3 Products/ Services Offered

12.3.4 SWOT Analysis

12.4 Schneider Electric SE

12.4.1 Company Overview

12.4.2 Financial

12.4.3 Products/ Services Offered

12.4.4 SWOT Analysis

12.5 Honeywell International Inc.

12.5.1 Company Overview

12.5.2 Financial

12.5.3 Products/ Services Offered

12.5.4 SWOT Analysis

12.6 Johnson Controls International plc

12.6.1 Company Overview

12.6.2 Financial

12.6.3 Products/ Services Offered

12.6.4 SWOT Analysis

12.7 Kingspan Group Plc

12.7.1 Company Overview

12.7.2 Financial

12.7.3 Products/ Services Offered

12.7.4 SWOT Analysis

12.8 Canadian Solar Inc.

12.8.1 Company Overview

12.8.2 Financial

12.8.3 Products/ Services Offered

12.8.4 SWOT Analysis

12.9 Rockwool Group

12.9.1 Company Overview

12.9.2 Financial

12.9.3 Products/ Services Offered

12.9.4 SWOT Analysis

12.10 SunPower Corporation

12.10.1 Company Overview

12.10.2 Financial

12.10.3 Products/ Services Offered

12.10.4 SWOT Analysis

13. Use Cases and Best Practices

14. Conclusion

An accurate research report requires proper strategizing as well as implementation. There are multiple factors involved in the completion of good and accurate research report and selecting the best methodology to compete the research is the toughest part. Since the research reports we provide play a crucial role in any company’s decision-making process, therefore we at SNS Insider always believe that we should choose the best method which gives us results closer to reality. This allows us to reach at a stage wherein we can provide our clients best and accurate investment to output ratio.

Each report that we prepare takes a timeframe of 350-400 business hours for production. Starting from the selection of titles through a couple of in-depth brain storming session to the final QC process before uploading our titles on our website we dedicate around 350 working hours. The titles are selected based on their current market cap and the foreseen CAGR and growth.


The 5 steps process:

Step 1: Secondary Research:

Secondary Research or Desk Research is as the name suggests is a research process wherein, we collect data through the readily available information. In this process we use various paid and unpaid databases which our team has access to and gather data through the same. This includes examining of listed companies’ annual reports, Journals, SEC filling etc. Apart from this our team has access to various associations across the globe across different industries. Lastly, we have exchange relationships with various university as well as individual libraries.

Secondary Research

Step 2: Primary Research

When we talk about primary research, it is a type of study in which the researchers collect relevant data samples directly, rather than relying on previously collected data.  This type of research is focused on gaining content specific facts that can be sued to solve specific problems. Since the collected data is fresh and first hand therefore it makes the study more accurate and genuine.

We at SNS Insider have divided Primary Research into 2 parts.

Part 1 wherein we interview the KOLs of major players as well as the upcoming ones across various geographic regions. This allows us to have their view over the market scenario and acts as an important tool to come closer to the accurate market numbers. As many as 45 paid and unpaid primary interviews are taken from both the demand and supply side of the industry to make sure we land at an accurate judgement and analysis of the market.

This step involves the triangulation of data wherein our team analyses the interview transcripts, online survey responses and observation of on filed participants. The below mentioned chart should give a better understanding of the part 1 of the primary interview.

Primary Research

Part 2: In this part of primary research the data collected via secondary research and the part 1 of the primary research is validated with the interviews from individual consultants and subject matter experts.

Consultants are those set of people who have at least 12 years of experience and expertise within the industry whereas Subject Matter Experts are those with at least 15 years of experience behind their back within the same space. The data with the help of two main processes i.e., FGDs (Focused Group Discussions) and IDs (Individual Discussions). This gives us a 3rd party nonbiased primary view of the market scenario making it a more dependable one while collation of the data pointers.

Step 3: Data Bank Validation

Once all the information is collected via primary and secondary sources, we run that information for data validation. At our intelligence centre our research heads track a lot of information related to the market which includes the quarterly reports, the daily stock prices, and other relevant information. Our data bank server gets updated every fortnight and that is how the information which we collected using our primary and secondary information is revalidated in real time.

Data Bank Validation

Step 4: QA/QC Process

After all the data collection and validation our team does a final level of quality check and quality assurance to get rid of any unwanted or undesired mistakes. This might include but not limited to getting rid of the any typos, duplication of numbers or missing of any important information. The people involved in this process include technical content writers, research heads and graphics people. Once this process is completed the title gets uploader on our platform for our clients to read it.

Step 5: Final QC/QA Process:

This is the last process and comes when the client has ordered the study. In this process a final QA/QC is done before the study is emailed to the client. Since we believe in giving our clients a good experience of our research studies, therefore, to make sure that we do not lack at our end in any way humanly possible we do a final round of quality check and then dispatch the study to the client.

Key Segments:

By Component

  • Building Envelope

  • HVAC Systems

  • Lighting Systems

  • Energy Storage Systems

  • Others

By Building Type

  • Residential

  • Commercial

  • Industrial

By Technology

  • Solar Energy

  • Wind Energy

  • Geothermal Energy

  • Biomass Energy

  • Others

By End-Use

  • New Construction

  • Renovation & Retrofitting

Request for Segment Customization as per your Business Requirement: Segment Customization Request

Regional Coverage:

North America

  • US

  • Canada

  • Mexico

Europe

  • Eastern Europe

    • Poland

    • Romania

    • Hungary

    • Turkey

    • Rest of Eastern Europe

  • Western Europe

    • Germany

    • France

    • UK

    • Italy

    • Spain

    • Netherlands

    • Switzerland

    • Austria

    • Rest of Western Europe

Asia Pacific

  • China

  • India

  • Japan

  • South Korea

  • Vietnam

  • Singapore

  • Australia

  • Rest of Asia Pacific

Middle East & Africa

  • Middle East

    • UAE

    • Egypt

    • Saudi Arabia

    • Qatar

    • Rest of Middle East

  • Africa

    • Nigeria

    • South Africa

    • Rest of Africa

Latin America

  • Brazil

  • Argentina

  • Colombia

  • Rest of Latin America

Request for Country Level Research Report: Country Level Customization Request

Available Customization

With the given market data, SNS Insider offers customization as per the company’s specific needs. The following customization options are available for the report:

  • Detailed Volume Analysis

  • Criss-Cross segment analysis (e.g. Product X Application)

  • Competitive Product Benchmarking

  • Geographic Analysis

  • Additional countries in any of the regions

  • Customized Data Representation

  • Detailed analysis and profiling of additional market players


  •            5000 (33% Discount)


  •            8950 (40% Discount)


  •            3050 (23% Discount)

Start a Conversation

Hi! Click one of our member below to chat on Phone