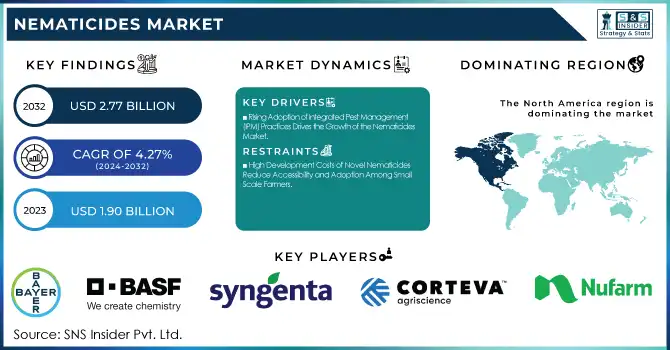
The Nematicides Market Size was valued at USD 1.90 Billion in 2023 and is expected to reach USD 2.77 Billion by 2032, growing at a CAGR of 4.27% over the forecast period of 2024-2032.
To Get more information on Nematicides Market - Request Free Sample Report
The Nematicides Market is evolving with advancements in sustainable pest control and shifting agricultural practices. Our report presents an in-depth pricing analysis, highlighting regional cost variations and market competitiveness. A thorough supply chain and distribution analysis uncovers key stakeholders and logistical trends. With rising investments, the funding landscape explores venture capital flows and government incentives. Innovation drives growth, and the research and development pipeline track technological advancements and novel formulations. Additionally, economic and policy impact analysis examines regulations and trade policies shaping market dynamics. Beyond industry trends, consumer education and awareness initiatives influence adoption. Our report encapsulates these critical aspects, offering a comprehensive perspective on the market’s evolution and opportunities.
Drivers
Rising Adoption of Integrated Pest Management (IPM) Practices Drives the Growth of the Nematicides Market
The increasing shift toward Integrated Pest Management (IPM) strategies is significantly driving the demand for nematicides. Farmers and agribusinesses are focusing on sustainable pest control solutions to minimize crop damage while reducing reliance on synthetic chemicals. Nematicides play a crucial role in IPM programs by effectively managing harmful nematodes that affect root development and overall plant health. As concerns over pesticide resistance and soil degradation grow, the adoption of targeted nematicides within IPM frameworks has surged. Additionally, government initiatives promoting eco-friendly agricultural practices and the implementation of stricter regulations on broad-spectrum pesticides have encouraged farmers to integrate nematicides into their crop protection strategies. The increased awareness of the economic impact of nematode infestations, particularly in high-value crops such as fruits, vegetables, and commercial plantations, further fuels the market. With ongoing research and technological advancements, nematicides are becoming more precise and effective, ensuring minimal environmental impact while maximizing agricultural productivity.
Restraints
High Development Costs of Novel Nematicides Reduce Accessibility and Adoption Among Small-Scale Farmers
The research and development of new nematicides involve high costs, posing a major restraint to market growth. Developing effective and environmentally safe nematicides requires extensive field trials, toxicology studies, and regulatory approvals, leading to high upfront investments. These costs are ultimately reflected in product pricing, making nematicides less affordable for small-scale farmers in developing regions. Additionally, the shift toward biological nematicides, while promising, requires advanced biotechnological research, further increasing development expenses. The lack of widespread awareness and technical knowledge among farmers regarding proper nematicide application methods also limits market penetration. Without significant subsidies or financial support programs, small and medium-scale farmers struggle to adopt advanced nematicide solutions, restricting market growth potential.
Opportunities
Expansion of Precision Agriculture Technologies Enhances the Effectiveness and Targeted Application of Nematicides
The integration of precision agriculture technologies is revolutionizing nematicide application methods, presenting a lucrative growth opportunity. Innovations such as drone-based pesticide spraying, remote sensing, and soil health monitoring enable farmers to optimize nematicide usage, reducing costs and environmental impact. Site-specific application methods ensure that nematicides are applied precisely where nematode infestations occur, enhancing efficiency and minimizing wastage. Data-driven decision-making through AI-powered analytics also allows for predictive nematode management, improving crop protection outcomes. The growing adoption of precision farming tools, particularly in developed regions, is expected to drive demand for advanced nematicides tailored for smart agricultural systems.
Challenge
Limited Awareness Among Farmers About Nematode Management Restricts the Widespread Adoption of Nematicides
Despite the economic impact of nematode infestations, many farmers remain unaware of the importance of proactive nematode management, hindering market expansion. Smallholder farmers, particularly in developing regions, often lack access to diagnostic tools to identify nematode-related crop damage, leading to delayed or improper treatment. The misconception that traditional pest control methods can effectively manage nematode populations further restricts nematicide adoption. Additionally, limited technical knowledge regarding proper nematicide application, dosage, and compatibility with other crop protection measures reduces the effectiveness of these products. Addressing this challenge requires extensive farmer education programs, government-led awareness initiatives, and training on integrated nematode management strategies.
By Type
Chemical nematicides dominated the Nematicides Market in 2023, holding a 72.5% market share. Among chemical nematicides, fumigants emerged as the leading subsegment, accounting for a significant market share due to their high efficacy in controlling nematodes. The dominance of chemical nematicides is primarily attributed to their immediate and broad-spectrum action against nematode infestations in key crops such as corn, soybean, and vegetables. Organizations like the United States Environmental Protection Agency (EPA) continue to regulate chemical nematicides, ensuring their safe usage while maintaining their availability in the market. Additionally, the European Food Safety Authority (EFSA) has been revising regulations to balance nematicide effectiveness with environmental concerns. Companies like Corteva Agriscience, Syngenta, and Bayer have expanded their chemical nematicide portfolios, driving growth in this segment.
By Crop Type
Field crops dominated the Nematicides Market in 2023, holding a 30.2% market share. The widespread cultivation of crops such as wheat, corn, soybeans, and rice make them highly susceptible to nematode infestations, necessitating the use of nematicides. Countries such as the United States, Brazil, and India have reported increasing nematode-related yield losses, prompting government initiatives for better pest management strategies. For instance, the United States Department of Agriculture (USDA) has emphasized integrated nematode control measures for major field crops. The growing demand for high-yielding, pest-resistant crops has further fueled the adoption of nematicides in large-scale commercial farming.
By Formulation
Granular formulations dominated the Nematicides Market in 2023, holding a 36.2% market share. Granular nematicides are widely preferred due to their ease of application, controlled release, and reduced risk of leaching into groundwater. The ability of granular formulations to provide long-lasting protection against nematodes in crops such as corn, potatoes, and sugar beets has increased their adoption. Regulatory bodies, including the Environmental Protection Agency (EPA) and the Food and Agriculture Organization (FAO), have encouraged the use of safer granular formulations over liquid fumigants due to environmental concerns. Companies such as FMC Corporation and Bayer AG have been investing in granular nematicide innovations to enhance their efficacy and expand their market reach.
By Nematode Type
Root-knot nematodes dominated the Nematicides Market in 2023, holding a 55.4% market share. These nematodes pose a significant threat to a wide range of crops, including tomatoes, carrots, soybeans, and cotton, causing extensive yield losses. The increasing prevalence of root-knot nematodes in major agricultural economies, including the United States, Brazil, and China, has driven the demand for effective nematicide solutions. The International Institute of Tropical Agriculture (IITA) has highlighted the economic impact of root-knot nematodes, emphasizing the need for targeted nematicide applications. Additionally, rising temperatures and soil conditions favourable for nematode proliferation have contributed to their dominance in the market.
By Mode of Application
Drenching dominated the Nematicides Market in 2023, holding a 30.1% market share. This method is preferred for its direct application to the soil and plant roots, ensuring effective nematode control. Drenching is widely used in high-value crops such as fruits, vegetables, and ornamental plants, where precise nematode management is crucial. Governments and research institutions, including the Indian Council of Agricultural Research (ICAR), have promoted soil drenching methods as part of sustainable pest control practices. Additionally, advancements in bio-nematicides have further increased the adoption of drenching as an efficient and eco-friendly application method.
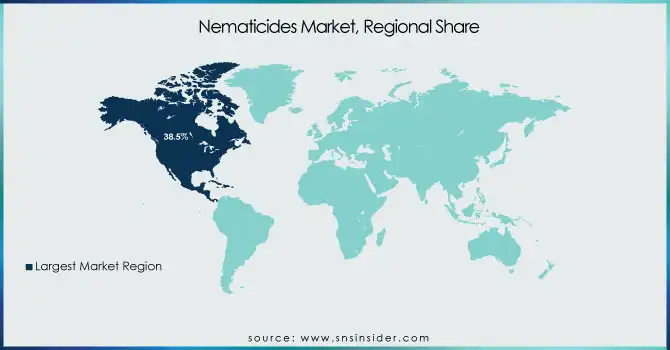
North America dominated the Nematicides Market in 2023, holding a market share of 38.5%. The region's dominance is driven by large-scale commercial farming, high nematode infestation levels, and strong regulatory support for nematicide adoption. The United States is the leading country, accounting for a substantial share due to its extensive agricultural land dedicated to crops like corn, soybean, and potatoes, which are highly susceptible to nematodes. The United States Department of Agriculture (USDA) has consistently emphasized the need for effective nematode management, leading to increased demand for both chemical and biological nematicides. In 2023, the EPA approved new bio-based nematicides to reduce environmental impact while maintaining efficiency. Canada also plays a key role, with rising nematode issues in wheat and potato farming, prompting the adoption of safer, long-lasting nematicide solutions. The presence of major nematicide manufacturers, such as Corteva Agriscience, Bayer, and Syngenta, has further contributed to market expansion in the region.
On the other hand, Asia Pacific emerged as the fastest-growing region in the Nematicides Market, with a significant growth rate in the forecast period. The region's rapid growth is fueled by increasing awareness of nematode-related yield losses, government initiatives to improve agricultural productivity, and the rising adoption of biological nematicides. China is the leading market, driven by its large-scale vegetable and fruit production, where nematodes significantly impact crop yields. The Chinese Ministry of Agriculture and Rural Affairs has introduced policies encouraging the use of biopesticides, including bio-nematicides, to ensure sustainable farming practices. India is another major contributor, with nematode infestations in crops like tomatoes, sugarcane, and rice leading to a surge in nematicide demand. The Indian Council of Agricultural Research (ICAR) reported a 15–20% crop loss due to nematodes, pushing farmers to adopt nematicides aggressively. Additionally, emerging economies like Vietnam, Indonesia, and Thailand are experiencing increased nematicide adoption as part of integrated pest management (IPM) programs.
Get Customized Report as per Your Business Requirement - Enquiry Now
Key Players
BASF SE (Velum, Nemasphere)
Bayer AG (Velum Prime, Monceren)
Corteva Agriscience (Salibro, Vydate)
Syngenta AG (Tervigo, Clariva)
FMC Corporation (Rugby, Presence)
UPL Limited (VAMOS, Phoskill)
American Vanguard Corporation (Counter, Nemacur)
Nufarm (Trunemco, Thor)
ADAMA Agricultural Solutions Ltd. (Nimitz, Custodia)
Valent BioSciences LLC (DiTera, MeloCon)
Isagro S.p.A (Biox-M, Remedier)
Marrone Bio Innovations (Majestene, Grandevo)
Certis Biologicals (MeloCon, Cordon)
Tessenderlo Kerley Inc. (NovaSource) (Enphase, Telone)
PI Industries (Nemacel, Fostera)
Albaugh LLC (Oxamyl, Agri-Mek)
Chr. Hansen (Nemix, VectoLex)
Ishihara Sangyo Kaisha, Ltd. (Lance, Hachi-Hachi)
Valent U.S.A. LLC (DiTera, Sevin)
Vive Crop Protection (AZterknot, Fenprote)
Recent Highlights
September 2023: Bayer introduced Velum Rise, a dual-action nematicide and fungicide, and Emesto Complete, a seed treatment for potatoes, to protect crops from nematodes and diseases while enhancing yields
September 2023: Corteva launched Reklemel, a targeted nematicide with a favorable safety profile, offering effective control of nematodes in vegetables and fruits while supporting sustainable farming.
| Report Attributes | Details |
|---|---|
| Market Size in 2023 | USD 1.90 Billion |
| Market Size by 2032 | USD 2.77 Billion |
| CAGR | CAGR of 4.27% From 2024 to 2032 |
| Base Year | 2023 |
| Forecast Period | 2024-2032 |
| Historical Data | 2020-2022 |
| Report Scope & Coverage | Market Size, Segments Analysis, Competitive Landscape, Regional Analysis, DROC & SWOT Analysis, Forecast Outlook |
| Key Segments | •By Type (Chemical [Fumigants, Organophosphates, Carbamates, Non-Fumigant Nematicides, Others], Biological [Microbials, Biochemical, Macrobials, Bionematicides]) •By Crop Type (Field Crops, Horticultural Crops, Commercial Crops, Turf & Ornamental Crops, Protected Cultivation / Greenhouse Crops, Others) •By Formulation (Granular, Liquid, Water-Dispersible Powder (WDP), Emulsifiable Concentrates (EC), Gels & Pastes, Others) •By Nematode Type (Root-Knot Nematodes, Cyst Nematodes, Lesion Nematodes, Others) •By Mode of Application (Drenching, Soil Dressing, Seed Treatment, Fumigation, Others) |
| Regional Analysis/Coverage | North America (US, Canada, Mexico), Europe (Eastern Europe [Poland, Romania, Hungary, Turkey, Rest of Eastern Europe] Western Europe] Germany, France, UK, Italy, Spain, Netherlands, Switzerland, Austria, Rest of Western Europe]), Asia Pacific (China, India, Japan, South Korea, Vietnam, Singapore, Australia, Rest of Asia Pacific), Middle East & Africa (Middle East [UAE, Egypt, Saudi Arabia, Qatar, Rest of Middle East], Africa [Nigeria, South Africa, Rest of Africa], Latin America (Brazil, Argentina, Colombia, Rest of Latin America) |
| Company Profiles | BASF SE, Bayer AG, Corteva Agriscience, Syngenta AG, FMC Corporation, UPL Limited, American Vanguard Corporation, Nufarm, ADAMA Agricultural Solutions Ltd., Valent BioSciences LLC and other key players |
Ans: The Nematicides Market was valued at USD 1.90 Billion in 2023.
Ans: The Nematicides Market is projected to grow at a CAGR of 4.27% from 2024 to 2032.
Ans: Precision agriculture technologies enhance efficiency in the Nematicides Market.
Ans: North America leads the Nematicides Market, holding a 38.5% share.
Ans: Corteva Agriscience, Syngenta, and Bayer are key players in the Nematicides Market.
Table of Contents:
1. Introduction
1.1 Market Definition
1.2 Scope (Inclusion and Exclusions)
1.3 Research Assumptions
2. Executive Summary
2.1 Market Overview
2.2 Regional Synopsis
2.3 Competitive Summary
3. Research Methodology
3.1 Top-Down Approach
3.2 Bottom-up Approach
3.3. Data Validation
3.4 Primary Interviews
4. Market Dynamics Impact Analysis
4.1 Market Driving Factors Analysis
4.1.1 Drivers
4.1.2 Restraints
4.2 PESTLE Analysis
4.3 Porter’s Five Forces Model
5. Statistical Insights and Trends Reporting
5.1 Adoption Rates of Emerging Technologies
5.2 Nematode TypeUsage Trends
5.3 Demographics and Behavior
5.4 Software and Integration
6. Competitive Landscape
6.1 List of Major Companies, By Region
6.2 Market Share Analysis, By Region
6.3 Product Benchmarking
6.3.1 Product specifications and features
6.3.2 Pricing
6.4 Strategic Initiatives
6.4.1 Marketing and promotional activities
6.4.2 Distribution and supply chain strategies
6.4.3 Expansion plans and new product launches
6.4.4 Strategic partnerships and collaborations
6.5 Technological Advancements
6.6 Market Positioning and Branding
7. Nematicides Market Segmentation, By Type
7.1 Chapter Overview
7.2 Chemical
7.2.1 Chemical Market Trends Analysis (2020-2032)
7.2.2 Chemical Market Size Estimates and Forecasts to 2032 (USD Billion)
7.2.3 Fumigants
7.2.3.1 Fumigants Market Trends Analysis (2020-2032)
7.2.3.2 Fumigants Market Size Estimates and Forecasts to 2032 (USD Billion)
7.2.4 Organophosphates
7.2.4.1 Organophosphates Market Trends Analysis (2020-2032)
7.2.4.2 Organophosphates Market Size Estimates and Forecasts to 2032 (USD Billion)
7.2.5 Carbamates
7.2.5.1 Carbamates Market Trends Analysis (2020-2032)
7.2.5.2 Carbamates Market Size Estimates and Forecasts to 2032 (USD Billion)
7.2.6 Non-Fumigant Nematicides
7.2.6.1 Non-Fumigant Nematicides Market Trends Analysis (2020-2032)
7.2.6.2 Non-Fumigant Nematicides Market Size Estimates and Forecasts to 2032 (USD Billion)
7.2.7 Others
7.2.7.1 Others Market Trends Analysis (2020-2032)
7.2.7.2 Others Market Size Estimates and Forecasts to 2032 (USD Billion)
7.3 Biological
7.3.1 Biological Market Trends Analysis (2020-2032)
7.3.2 Biological Market Size Estimates and Forecasts to 2032 (USD Billion)
7.3.3 Microbials
7.3.3.1 Microbials Market Trends Analysis (2020-2032)
7.3.3.2 Microbials Market Size Estimates and Forecasts to 2032 (USD Billion)
7.3.4 Biochemical
7.4.4.1 Biochemical Market Trends Analysis (2020-2032)
7.4.4.2 Biochemical Market Size Estimates and Forecasts to 2032 (USD Billion)
7.3.5 Macrobials
7.3.5.1 Macrobials Market Trends Analysis (2020-2032)
7.3.5.2 Macrobials Market Size Estimates and Forecasts to 2032 (USD Billion)
7.3.6 Bionematicides
7.3.6.1 Bionematicides Market Trends Analysis (2020-2032)
7.3.6.2 Bionematicides Market Size Estimates and Forecasts to 2032 (USD Billion)
8. Nematicides Market Segmentation, By Crop Type
8.1 Chapter Overview
8.2 Field Crops
8.2.1 Field Crops Market Trends Analysis (2020-2032)
8.2.2 Field Crops Market Size Estimates And Forecasts To 2032 (USD Billion)
8.3 Horticultural Crops
8.3.1 Horticultural Crops Market Trends Analysis (2020-2032)
8.3.2 Horticultural Crops Market Size Estimates And Forecasts To 2032 (USD Billion)
8.4 Commercial Crops
8.4.1 Commercial Crops Market Trends Analysis (2020-2032)
8.4.2 Commercial Crops Market Size Estimates And Forecasts To 2032 (USD Billion)
8.5 Turf & Ornamental Crops
8.5.1 Turf & Ornamental Crops Market Trends Analysis (2020-2032)
8.5.2 Turf & Ornamental Crops Market Size Estimates And Forecasts To 2032 (USD Billion)
8.6 Protected Cultivation / Greenhouse Crops
8.6.1 Protected Cultivation / Greenhouse Crops Market Trends Analysis (2020-2032)
8.6.2 Protected Cultivation / Greenhouse Crops Market Size Estimates And Forecasts To 2032 (USD Billion)
8.7 Others
8.7.1 Others Market Trends Analysis (2020-2032)
8.7.2 Others Market Size Estimates And Forecasts To 2032 (USD Billion)
9. Nematicides Market Segmentation, By Formulation
9.1 Chapter Overview
9.2 Granular
9.2.1 Granular Market Trends Analysis (2020-2032)
9.2.2 Granular Market Size Estimates And Forecasts To 2032 (USD Billion)
9.3 Liquid
9.3.1 Liquid Market Trends Analysis (2020-2032)
9.3.2 Liquid Market Size Estimates And Forecasts To 2032 (USD Billion)
9.4 Water-Dispersible Powder (WDP)
9.4.1 Water-Dispersible Powder (WDP) Market Trends Analysis (2020-2032)
9.4.2 Water-Dispersible Powder (WDP) Market Size Estimates And Forecasts To 2032 (USD Billion)
9.5 Emulsifiable Concentrates (EC)
9.5.1 Emulsifiable Concentrates (EC) Market Trends Analysis (2020-2032)
9.5.2 Emulsifiable Concentrates (EC) Market Size Estimates And Forecasts To 2032 (USD Billion)
9.5 Gels & Pastes
9.5.1 Gels & Pastes Market Trends Analysis (2020-2032)
9.5.2 Gels & Pastes Market Size Estimates And Forecasts To 2032 (USD Billion)
9.5 Others
9.5.1 Others Market Trends Analysis (2020-2032)
9.5.2 Others Market Size Estimates And Forecasts To 2032 (USD Billion)
10. Nematicides Market Segmentation, By Nematode Type
10.1 Chapter Overview
10.2 Root-Knot Nematodes
10.2.1 Root-Knot Nematodes Market Trends Analysis (2020-2032)
10.2.2 Root-Knot Nematodes Market Size Estimates And Forecasts To 2032 (USD Billion)
10.3 Cyst Nematodes
10.3.1 Cyst Nematodes Market Trends Analysis (2020-2032)
10.3.2 Cyst Nematodes Market Size Estimates And Forecasts To 2032 (USD Billion)
10.4 Lesion Nematodes
10.4.1 Lesion Nematodes Market Trends Analysis (2020-2032)
10.4.2 Lesion Nematodes Market Size Estimates And Forecasts To 2032 (USD Billion)
10.5 Others
10.5.1 Others Market Trends Analysis (2020-2032)
10.5.2 Others Market Size Estimates And Forecasts To 2032 (USD Billion)
11. Nematicides Market Segmentation, By Mode of Application
11.1 Chapter Overview
11.2 Drenching
11.2.1 Drenching Market Trends Analysis (2020-2032)
11.2.2 Drenching Market Size Estimates And Forecasts To 2032 (USD Billion)
11.3 Soil Dressing
11.3.1 Soil Dressing Market Trends Analysis (2020-2032)
11.3.2 Soil Dressing Market Size Estimates And Forecasts To 2032 (USD Billion)
11.4 Seed Treatment
11.4.1 Seed Treatment Market Trends Analysis (2020-2032)
11.4.2 Seed Treatment Market Size Estimates And Forecasts To 2032 (USD Billion)
11.5 Fumigation
11.5.1 Fumigation Market Trends Analysis (2020-2032)
11.5.2 Fumigation Market Size Estimates And Forecasts To 2032 (USD Billion)
11.6 Others
11.6.1 Others Market Trends Analysis (2020-2032)
11.6.2 Others Market Size Estimates And Forecasts To 2032 (USD Billion)
12. Regional Analysis
12.1 Chapter Overview
12.2 North America
12.2.1 Trends Analysis
12.2.2 North America Nematicides Market Estimates And Forecasts, By Country (2020-2032) (USD Billion)
12.2.3 North America Nematicides Market Estimates And Forecasts, By Type (2020-2032) (USD Billion)
12.2.4 North America Nematicides Market Estimates And Forecasts, By Crop Type (2020-2032) (USD Billion)
12.2.5 North America Nematicides Market Estimates And Forecasts, By Formulation (2020-2032) (USD Billion)
12.2.6 North America Nematicides Market Estimates And Forecasts, By Nematode Type(2020-2032) (USD Billion)
12.2.7 North America Nematicides Market Estimates And Forecasts, By Mode of Application (2020-2032) (USD Billion)
12.2.8 USA
12.2.8.1 USA Nematicides Market Estimates And Forecasts, By Type (2020-2032) (USD Billion)
12.2.8.2 USA Nematicides Market Estimates And Forecasts, By Crop Type (2020-2032) (USD Billion)
12.2.8.3 USA Nematicides Market Estimates And Forecasts, By Formulation (2020-2032) (USD Billion)
12.2.8.4 USA Nematicides Market Estimates And Forecasts, By Nematode Type(2020-2032) (USD Billion)
12.2.8.5 USA Nematicides Market Estimates And Forecasts, By Mode of Application (2020-2032) (USD Billion)
12.2.9 Canada
12.2.9.1 Canada Nematicides Market Estimates And Forecasts, By Type (2020-2032) (USD Billion)
12.2.9.2 Canada Nematicides Market Estimates And Forecasts, By Crop Type (2020-2032) (USD Billion)
12.2.9.3 Canada Nematicides Market Estimates And Forecasts, By Formulation (2020-2032) (USD Billion)
12.2.9.4 Canada Nematicides Market Estimates And Forecasts, By Nematode Type(2020-2032) (USD Billion)
12.2.9.5 Canada Nematicides Market Estimates And Forecasts, By Mode of Application (2020-2032) (USD Billion)
12.2.10 Mexico
12.2.10.1 Mexico Nematicides Market Estimates And Forecasts, By Type (2020-2032) (USD Billion)
12.2.10.2 Mexico Nematicides Market Estimates And Forecasts, By Crop Type (2020-2032) (USD Billion)
12.2.10.3 Mexico Nematicides Market Estimates And Forecasts, By Formulation (2020-2032) (USD Billion)
12.2.10.4 Mexico Nematicides Market Estimates And Forecasts, By Nematode Type(2020-2032) (USD Billion)
12.2.10.5 Mexico Nematicides Market Estimates And Forecasts, By Mode of Application (2020-2032) (USD Billion)
12.3 Europe
12.3.1 Eastern Europe
12.3.1.1 Trends Analysis
12.3.1.2 Eastern Europe Nematicides Market Estimates And Forecasts, By Country (2020-2032) (USD Billion)
12.3.1.3 Eastern Europe Nematicides Market Estimates And Forecasts, By Type (2020-2032) (USD Billion)
12.3.1.4 Eastern Europe Nematicides Market Estimates And Forecasts, By Crop Type (2020-2032) (USD Billion)
12.3.1.5 Eastern Europe Nematicides Market Estimates And Forecasts, By Formulation (2020-2032) (USD Billion)
12.3.1.6 Eastern Europe Nematicides Market Estimates And Forecasts, By Nematode Type(2020-2032) (USD Billion)
12.3.1.7 Eastern Europe Nematicides Market Estimates And Forecasts, By Mode of Application (2020-2032) (USD Billion)
12.3.1.8 Poland
12.3.1.8.1 Poland Nematicides Market Estimates And Forecasts, By Type (2020-2032) (USD Billion)
12.3.1.8.2 Poland Nematicides Market Estimates And Forecasts, By Crop Type (2020-2032) (USD Billion)
12.3.1.8.3 Poland Nematicides Market Estimates And Forecasts, By Formulation (2020-2032) (USD Billion)
12.3.1.8.4 Poland Nematicides Market Estimates And Forecasts, By Nematode Type(2020-2032) (USD Billion)
12.3.1.8.5 Poland Nematicides Market Estimates And Forecasts, By Mode of Application (2020-2032) (USD Billion)
12.3.1.9 Romania
12.3.1.9.1 Romania Nematicides Market Estimates And Forecasts, By Type (2020-2032) (USD Billion)
12.3.1.9.2 Romania Nematicides Market Estimates And Forecasts, By Crop Type (2020-2032) (USD Billion)
12.3.1.9.3 Romania Nematicides Market Estimates And Forecasts, By Formulation (2020-2032) (USD Billion)
12.3.1.9.4 Romania Nematicides Market Estimates And Forecasts, By Nematode Type(2020-2032) (USD Billion)
12.3.1.9.5 Romania Nematicides Market Estimates And Forecasts, By Mode of Application (2020-2032) (USD Billion)
12.3.1.10 Hungary
12.3.1.10.1 Hungary Nematicides Market Estimates And Forecasts, By Type (2020-2032) (USD Billion)
12.3.1.10.2 Hungary Nematicides Market Estimates And Forecasts, By Crop Type (2020-2032) (USD Billion)
12.3.1.10.3 Hungary Nematicides Market Estimates And Forecasts, By Formulation (2020-2032) (USD Billion)
12.3.1.10.4 Hungary Nematicides Market Estimates And Forecasts, By Nematode Type(2020-2032) (USD Billion)
12.3.1.10.5 Hungary Nematicides Market Estimates And Forecasts, By Mode of Application (2020-2032) (USD Billion)
12.3.1.11 Turkey
12.3.1.11.1 Turkey Nematicides Market Estimates And Forecasts, By Type (2020-2032) (USD Billion)
12.3.1.11.2 Turkey Nematicides Market Estimates And Forecasts, By Crop Type (2020-2032) (USD Billion)
12.3.1.11.3 Turkey Nematicides Market Estimates And Forecasts, By Formulation (2020-2032) (USD Billion)
12.3.1.11.4 Turkey Nematicides Market Estimates And Forecasts, By Nematode Type(2020-2032) (USD Billion)
12.3.1.11.5 Turkey Nematicides Market Estimates And Forecasts, By Mode of Application (2020-2032) (USD Billion)
12.3.1.12 Rest Of Eastern Europe
12.3.1.12.1 Rest Of Eastern Europe Nematicides Market Estimates And Forecasts, By Type (2020-2032) (USD Billion)
12.3.1.12.2 Rest Of Eastern Europe Nematicides Market Estimates And Forecasts, By Crop Type (2020-2032) (USD Billion)
12.3.1.12.3 Rest Of Eastern Europe Nematicides Market Estimates And Forecasts, By Formulation (2020-2032) (USD Billion)
12.3.1.12.4 Rest Of Eastern Europe Nematicides Market Estimates And Forecasts, By Nematode Type(2020-2032) (USD Billion)
12.3.1.12.5 Rest Of Eastern Europe Nematicides Market Estimates And Forecasts, By Mode of Application (2020-2032) (USD Billion)
12.3.2 Western Europe
12.3.2.1 Trends Analysis
12.3.2.2 Western Europe Nematicides Market Estimates And Forecasts, By Country (2020-2032) (USD Billion)
12.3.2.3 Western Europe Nematicides Market Estimates And Forecasts, By Type (2020-2032) (USD Billion)
12.3.2.4 Western Europe Nematicides Market Estimates And Forecasts, By Crop Type (2020-2032) (USD Billion)
12.3.2.5 Western Europe Nematicides Market Estimates And Forecasts, By Formulation (2020-2032) (USD Billion)
12.3.2.6 Western Europe Nematicides Market Estimates And Forecasts, By Nematode Type(2020-2032) (USD Billion)
12.3.2.7 Western Europe Nematicides Market Estimates And Forecasts, By Mode of Application (2020-2032) (USD Billion)
12.3.2.8 Germany
12.3.2.8.1 Germany Nematicides Market Estimates And Forecasts, By Type (2020-2032) (USD Billion)
12.3.2.8.2 Germany Nematicides Market Estimates And Forecasts, By Crop Type (2020-2032) (USD Billion)
12.3.2.8.3 Germany Nematicides Market Estimates And Forecasts, By Formulation (2020-2032) (USD Billion)
12.3.2.8.4 Germany Nematicides Market Estimates And Forecasts, By Nematode Type(2020-2032) (USD Billion)
12.3.2.8.5 Germany Nematicides Market Estimates And Forecasts, By Mode of Application (2020-2032) (USD Billion)
12.3.2.9 France
12.3.2.9.1 France Nematicides Market Estimates And Forecasts, By Type (2020-2032) (USD Billion)
12.3.2.9.2 France Nematicides Market Estimates And Forecasts, By Crop Type (2020-2032) (USD Billion)
12.3.2.9.3 France Nematicides Market Estimates And Forecasts, By Formulation (2020-2032) (USD Billion)
12.3.2.9.4 France Nematicides Market Estimates And Forecasts, By Nematode Type(2020-2032) (USD Billion)
12.3.2.9.5 France Nematicides Market Estimates And Forecasts, By Mode of Application (2020-2032) (USD Billion)
12.3.2.10 UK
12.3.2.10.1 UK Nematicides Market Estimates And Forecasts, By Type (2020-2032) (USD Billion)
12.3.2.10.2 UK Nematicides Market Estimates And Forecasts, By Crop Type (2020-2032) (USD Billion)
12.3.2.10.3 UK Nematicides Market Estimates And Forecasts, By Formulation (2020-2032) (USD Billion)
12.3.2.10.4 UK Nematicides Market Estimates And Forecasts, By Nematode Type(2020-2032) (USD Billion)
12.3.2.10.5 UK Nematicides Market Estimates And Forecasts, By Mode of Application (2020-2032) (USD Billion)
12.3.2.11 Italy
12.3.2.11.1 Italy Nematicides Market Estimates And Forecasts, By Type (2020-2032) (USD Billion)
12.3.2.11.2 Italy Nematicides Market Estimates And Forecasts, By Crop Type (2020-2032) (USD Billion)
12.3.2.11.3 Italy Nematicides Market Estimates And Forecasts, By Formulation (2020-2032) (USD Billion)
12.3.2.11.4 Italy Nematicides Market Estimates And Forecasts, By Nematode Type(2020-2032) (USD Billion)
12.3.2.11.5 Italy Nematicides Market Estimates And Forecasts, By Mode of Application (2020-2032) (USD Billion)
12.3.2.12 Spain
12.3.2.12.1 Spain Nematicides Market Estimates And Forecasts, By Type (2020-2032) (USD Billion)
12.3.2.12.2 Spain Nematicides Market Estimates And Forecasts, By Crop Type (2020-2032) (USD Billion)
12.3.2.12.3 Spain Nematicides Market Estimates And Forecasts, By Formulation (2020-2032) (USD Billion)
12.3.2.12.4 Spain Nematicides Market Estimates And Forecasts, By Nematode Type(2020-2032) (USD Billion)
12.3.2.12.5 Spain Nematicides Market Estimates And Forecasts, By Mode of Application (2020-2032) (USD Billion)
12.3.2.13 Netherlands
12.3.2.13.1 Netherlands Nematicides Market Estimates And Forecasts, By Type (2020-2032) (USD Billion)
12.3.2.13.2 Netherlands Nematicides Market Estimates And Forecasts, By Crop Type (2020-2032) (USD Billion)
12.3.2.13.3 Netherlands Nematicides Market Estimates And Forecasts, By Formulation (2020-2032) (USD Billion)
12.3.2.13.4 Netherlands Nematicides Market Estimates And Forecasts, By Nematode Type(2020-2032) (USD Billion)
12.3.2.13.5 Netherlands Nematicides Market Estimates And Forecasts, By Mode of Application (2020-2032) (USD Billion)
12.3.2.14 Switzerland
12.3.2.14.1 Switzerland Nematicides Market Estimates And Forecasts, By Type (2020-2032) (USD Billion)
12.3.2.14.2 Switzerland Nematicides Market Estimates And Forecasts, By Crop Type (2020-2032) (USD Billion)
12.3.2.14.3 Switzerland Nematicides Market Estimates And Forecasts, By Formulation (2020-2032) (USD Billion)
12.3.2.14.4 Switzerland Nematicides Market Estimates And Forecasts, By Nematode Type(2020-2032) (USD Billion)
12.3.2.12.5 Switzerland Nematicides Market Estimates And Forecasts, By Mode of Application (2020-2032) (USD Billion)
12.3.2.15 Austria
12.3.2.15.1 Austria Nematicides Market Estimates And Forecasts, By Type (2020-2032) (USD Billion)
12.3.2.15.2 Austria Nematicides Market Estimates And Forecasts, By Crop Type (2020-2032) (USD Billion)
12.3.2.15.3 Austria Nematicides Market Estimates And Forecasts, By Formulation (2020-2032) (USD Billion)
12.3.2.15.4 Austria Nematicides Market Estimates And Forecasts, By Nematode Type(2020-2032) (USD Billion)
12.3.2.15.5 Austria Nematicides Market Estimates And Forecasts, By Mode of Application (2020-2032) (USD Billion)
12.3.2.16 Rest Of Western Europe
12.3.2.16.1 Rest Of Western Europe Nematicides Market Estimates And Forecasts, By Type (2020-2032) (USD Billion)
12.3.2.16.2 Rest Of Western Europe Nematicides Market Estimates And Forecasts, By Crop Type (2020-2032) (USD Billion)
12.3.2.16.3 Rest Of Western Europe Nematicides Market Estimates And Forecasts, By Formulation (2020-2032) (USD Billion)
12.3.2.16.4 Rest Of Western Europe Nematicides Market Estimates And Forecasts, By Nematode Type(2020-2032) (USD Billion)
12.3.2.16.5 Rest Of Western Europe Nematicides Market Estimates And Forecasts, By Mode of Application (2020-2032) (USD Billion)
12.4 Asia Pacific
12.4.1 Trends Analysis
12.4.2 Asia Pacific Nematicides Market Estimates And Forecasts, By Country (2020-2032) (USD Billion)
12.4.3 Asia Pacific Nematicides Market Estimates And Forecasts, By Type (2020-2032) (USD Billion)
12.4.4 Asia Pacific Nematicides Market Estimates And Forecasts, By Crop Type (2020-2032) (USD Billion)
12.4.5 Asia Pacific Nematicides Market Estimates And Forecasts, By Formulation (2020-2032) (USD Billion)
12.4.6 Asia Pacific Nematicides Market Estimates And Forecasts, By Nematode Type(2020-2032) (USD Billion)
12.4.7 Asia Pacific Nematicides Market Estimates And Forecasts, By Mode of Application (2020-2032) (USD Billion)
12.4.8 China
12.4.8.1 China Nematicides Market Estimates And Forecasts, By Type (2020-2032) (USD Billion)
12.4.8.2 China Nematicides Market Estimates And Forecasts, By Crop Type (2020-2032) (USD Billion)
12.4.8.3 China Nematicides Market Estimates And Forecasts, By Formulation (2020-2032) (USD Billion)
12.4.8.4 China Nematicides Market Estimates And Forecasts, By Nematode Type(2020-2032) (USD Billion)
12.4.8.5 China Nematicides Market Estimates And Forecasts, By Mode of Application (2020-2032) (USD Billion)
12.4.9 India
12.4.9.1 India Nematicides Market Estimates And Forecasts, By Type (2020-2032) (USD Billion)
12.4.9.2 India Nematicides Market Estimates And Forecasts, By Crop Type (2020-2032) (USD Billion)
12.4.9.3 India Nematicides Market Estimates And Forecasts, By Formulation (2020-2032) (USD Billion)
12.4.9.4 India Nematicides Market Estimates And Forecasts, By Nematode Type(2020-2032) (USD Billion)
12.4.9.5 India Nematicides Market Estimates And Forecasts, By Mode of Application (2020-2032) (USD Billion)
12.4.10 Japan
12.4.10.1 Japan Nematicides Market Estimates And Forecasts, By Type (2020-2032) (USD Billion)
12.4.10.2 Japan Nematicides Market Estimates And Forecasts, By Crop Type (2020-2032) (USD Billion)
12.4.10.3 Japan Nematicides Market Estimates And Forecasts, By Formulation (2020-2032) (USD Billion)
12.4.10.4 Japan Nematicides Market Estimates And Forecasts, By Nematode Type(2020-2032) (USD Billion)
12.4.10.5 Japan Nematicides Market Estimates And Forecasts, By Mode of Application (2020-2032) (USD Billion)
12.4.11 South Korea
12.4.11.1 South Korea Nematicides Market Estimates And Forecasts, By Type (2020-2032) (USD Billion)
12.4.11.2 South Korea Nematicides Market Estimates And Forecasts, By Crop Type (2020-2032) (USD Billion)
12.4.11.3 South Korea Nematicides Market Estimates And Forecasts, By Formulation (2020-2032) (USD Billion)
12.4.11.4 South Korea Nematicides Market Estimates And Forecasts, By Nematode Type(2020-2032) (USD Billion)
12.4.11.5 South Korea Nematicides Market Estimates And Forecasts, By Mode of Application (2020-2032) (USD Billion)
12.4.12 Vietnam
12.4.12.1 Vietnam Nematicides Market Estimates And Forecasts, By Type (2020-2032) (USD Billion)
12.4.12.2 Vietnam Nematicides Market Estimates And Forecasts, By Crop Type (2020-2032) (USD Billion)
12.4.12.3 Vietnam Nematicides Market Estimates And Forecasts, By Formulation (2020-2032) (USD Billion)
12.4.12.4 Vietnam Nematicides Market Estimates And Forecasts, By Nematode Type(2020-2032) (USD Billion)
12.4.12.5 Vietnam Nematicides Market Estimates And Forecasts, By Mode of Application (2020-2032) (USD Billion)
12.4.13 Singapore
12.4.13.1 Singapore Nematicides Market Estimates And Forecasts, By Type (2020-2032) (USD Billion)
12.4.13.2 Singapore Nematicides Market Estimates And Forecasts, By Crop Type (2020-2032) (USD Billion)
12.4.13.3 Singapore Nematicides Market Estimates And Forecasts, By Formulation (2020-2032) (USD Billion)
12.4.13.4 Singapore Nematicides Market Estimates And Forecasts, By Nematode Type(2020-2032) (USD Billion)
12.4.13.5 Singapore Nematicides Market Estimates And Forecasts, By Mode of Application (2020-2032) (USD Billion)
12.4.14 Australia
12.4.14.1 Australia Nematicides Market Estimates And Forecasts, By Type (2020-2032) (USD Billion)
12.4.14.2 Australia Nematicides Market Estimates And Forecasts, By Crop Type (2020-2032) (USD Billion)
12.4.14.3 Australia Nematicides Market Estimates And Forecasts, By Formulation (2020-2032) (USD Billion)
12.4.14.4 Australia Nematicides Market Estimates And Forecasts, By Nematode Type(2020-2032) (USD Billion)
12.4.14.5 Australia Nematicides Market Estimates And Forecasts, By Mode of Application (2020-2032) (USD Billion)
12.4.15 Rest Of Asia Pacific
12.4.15.1 Rest Of Asia Pacific Nematicides Market Estimates And Forecasts, By Type (2020-2032) (USD Billion)
12.4.15.2 Rest Of Asia Pacific Nematicides Market Estimates And Forecasts, By Crop Type (2020-2032) (USD Billion)
12.4.15.3 Rest Of Asia Pacific Nematicides Market Estimates And Forecasts, By Formulation (2020-2032) (USD Billion)
12.4.15.4 Rest Of Asia Pacific Nematicides Market Estimates And Forecasts, By Nematode Type(2020-2032) (USD Billion)
12.4.15.5 Rest Of Asia Pacific Nematicides Market Estimates And Forecasts, By Mode of Application (2020-2032) (USD Billion)
12.5 Middle East And Africa
12.5.1 Middle East
12.5.1.1 Trends Analysis
12.5.1.2 Middle East Nematicides Market Estimates And Forecasts, By Country (2020-2032) (USD Billion)
12.5.1.3 Middle East Nematicides Market Estimates And Forecasts, By Type (2020-2032) (USD Billion)
12.5.1.4 Middle East Nematicides Market Estimates And Forecasts, By Crop Type (2020-2032) (USD Billion)
12.5.1.5 Middle East Nematicides Market Estimates And Forecasts, By Formulation (2020-2032) (USD Billion)
12.5.1.6 Middle East Nematicides Market Estimates And Forecasts, By Nematode Type(2020-2032) (USD Billion)
12.5.1.7 Middle East Nematicides Market Estimates And Forecasts, By Mode of Application (2020-2032) (USD Billion)
12.5.1.8 UAE
12.5.1.8.1 UAE Nematicides Market Estimates And Forecasts, By Type (2020-2032) (USD Billion)
12.5.1.8.2 UAE Nematicides Market Estimates And Forecasts, By Crop Type (2020-2032) (USD Billion)
12.5.1.8.3 UAE Nematicides Market Estimates And Forecasts, By Formulation (2020-2032) (USD Billion)
12.5.1.8.4 UAE Nematicides Market Estimates And Forecasts, By Nematode Type(2020-2032) (USD Billion)
12.5.1.8.5 UAE Nematicides Market Estimates And Forecasts, By Mode of Application (2020-2032) (USD Billion)
12.5.1.9 Egypt
12.5.1.9.1 Egypt Nematicides Market Estimates And Forecasts, By Type (2020-2032) (USD Billion)
12.5.1.9.2 Egypt Nematicides Market Estimates And Forecasts, By Crop Type (2020-2032) (USD Billion)
12.5.1.9.3 Egypt Nematicides Market Estimates And Forecasts, By Formulation (2020-2032) (USD Billion)
12.5.1.9.4 Egypt Nematicides Market Estimates And Forecasts, By Nematode Type(2020-2032) (USD Billion)
12.5.1.9.5 Egypt Nematicides Market Estimates And Forecasts, By Mode of Application (2020-2032) (USD Billion)
12.5.1.10 Saudi Arabia
12.5.1.10.1 Saudi Arabia Nematicides Market Estimates And Forecasts, By Type (2020-2032) (USD Billion)
12.5.1.10.2 Saudi Arabia Nematicides Market Estimates And Forecasts, By Crop Type (2020-2032) (USD Billion)
12.5.1.10.3 Saudi Arabia Nematicides Market Estimates And Forecasts, By Formulation (2020-2032) (USD Billion)
12.5.1.10.4 Saudi Arabia Nematicides Market Estimates And Forecasts, By Nematode Type(2020-2032) (USD Billion)
12.5.1.10.5 Saudi Arabia Nematicides Market Estimates And Forecasts, By Mode of Application (2020-2032) (USD Billion)
12.5.1.11 Qatar
12.5.1.11.1 Qatar Nematicides Market Estimates And Forecasts, By Type (2020-2032) (USD Billion)
12.5.1.11.2 Qatar Nematicides Market Estimates And Forecasts, By Crop Type (2020-2032) (USD Billion)
12.5.1.11.3 Qatar Nematicides Market Estimates And Forecasts, By Formulation (2020-2032) (USD Billion)
12.5.1.11.4 Qatar Nematicides Market Estimates And Forecasts, By Nematode Type(2020-2032) (USD Billion)
12.5.1.11.5 Qatar Nematicides Market Estimates And Forecasts, By Mode of Application (2020-2032) (USD Billion)
12.5.1.12 Rest Of Middle East
12.5.1.12.1 Rest Of Middle East Nematicides Market Estimates And Forecasts, By Type (2020-2032) (USD Billion)
12.5.1.12.2 Rest Of Middle East Nematicides Market Estimates And Forecasts, By Crop Type (2020-2032) (USD Billion)
12.5.1.12.3 Rest Of Middle East Nematicides Market Estimates And Forecasts, By Formulation (2020-2032) (USD Billion)
12.5.1.12.4 Rest Of Middle East Nematicides Market Estimates And Forecasts, By Nematode Type(2020-2032) (USD Billion)
12.5.1.12.5 Rest Of Middle East Nematicides Market Estimates And Forecasts, By Mode of Application (2020-2032) (USD Billion)
12.5.2 Africa
12.5.2.1 Trends Analysis
12.5.2.2 Africa Nematicides Market Estimates And Forecasts, By Country (2020-2032) (USD Billion)
12.5.2.3 Africa Nematicides Market Estimates And Forecasts, By Type (2020-2032) (USD Billion)
12.5.2.4 Africa Nematicides Market Estimates And Forecasts, By Crop Type (2020-2032) (USD Billion)
12.5.2.5 Africa Nematicides Market Estimates And Forecasts, By Formulation (2020-2032) (USD Billion)
12.5.2.6 Africa Nematicides Market Estimates And Forecasts, By Nematode Type(2020-2032) (USD Billion)
12.5.2.7 Africa Nematicides Market Estimates And Forecasts, By Mode of Application (2020-2032) (USD Billion)
12.5.2.8 South Africa
12.5.2.8.1 South Africa Nematicides Market Estimates And Forecasts, By Type (2020-2032) (USD Billion)
12.5.2.8.2 South Africa Nematicides Market Estimates And Forecasts, By Crop Type (2020-2032) (USD Billion)
12.5.2.8.3 South Africa Nematicides Market Estimates And Forecasts, By Formulation (2020-2032) (USD Billion)
12.5.2.8.4 South Africa Nematicides Market Estimates And Forecasts, By Nematode Type(2020-2032) (USD Billion)
12.5.2.8.5 South Africa Nematicides Market Estimates And Forecasts, By Mode of Application (2020-2032) (USD Billion)
12.5.2.9 Nigeria
12.5.2.9.1 Nigeria Nematicides Market Estimates And Forecasts, By Type (2020-2032) (USD Billion)
12.5.2.9.2 Nigeria Nematicides Market Estimates And Forecasts, By Crop Type (2020-2032) (USD Billion)
12.5.2.9.3 Nigeria Nematicides Market Estimates And Forecasts, By Formulation (2020-2032) (USD Billion)
12.5.2.9.4 Nigeria Nematicides Market Estimates And Forecasts, By Nematode Type(2020-2032) (USD Billion)
12.5.2.9.5 Nigeria Nematicides Market Estimates And Forecasts, By Mode of Application (2020-2032) (USD Billion)
12.5.2.10 Rest Of Africa
12.5.2.10.1 Rest Of Africa Nematicides Market Estimates And Forecasts, By Type (2020-2032) (USD Billion)
12.5.2.10.2 Rest Of Africa Nematicides Market Estimates And Forecasts, By Crop Type (2020-2032) (USD Billion)
12.5.2.10.3 Rest Of Africa Nematicides Market Estimates And Forecasts, By Formulation (2020-2032) (USD Billion)
12.5.2.10.4 Rest Of Africa Nematicides Market Estimates And Forecasts, By Nematode Type(2020-2032) (USD Billion)
12.5.2.10.5 Rest Of Africa Nematicides Market Estimates And Forecasts, By Mode of Application (2020-2032) (USD Billion)
12.6 Latin America
12.6.1 Trends Analysis
12.6.2 Latin America Nematicides Market Estimates And Forecasts, By Country (2020-2032) (USD Billion)
12.6.3 Latin America Nematicides Market Estimates And Forecasts, By Type (2020-2032) (USD Billion)
12.6.4 Latin America Nematicides Market Estimates And Forecasts, By Crop Type (2020-2032) (USD Billion)
12.6.5 Latin America Nematicides Market Estimates And Forecasts, By Formulation (2020-2032) (USD Billion)
12.6.6 Latin America Nematicides Market Estimates And Forecasts, By Nematode Type(2020-2032) (USD Billion)
12.6.7 Latin America Nematicides Market Estimates And Forecasts, By Mode of Application (2020-2032) (USD Billion)
12.6.8 Brazil
12.6.8.1 Brazil Nematicides Market Estimates And Forecasts, By Type (2020-2032) (USD Billion)
12.6.8.2 Brazil Nematicides Market Estimates And Forecasts, By Crop Type (2020-2032) (USD Billion)
12.6.8.3 Brazil Nematicides Market Estimates And Forecasts, By Formulation (2020-2032) (USD Billion)
12.6.8.4 Brazil Nematicides Market Estimates And Forecasts, By Nematode Type(2020-2032) (USD Billion)
12.6.8.5 Brazil Nematicides Market Estimates And Forecasts, By Mode of Application (2020-2032) (USD Billion)
12.6.9 Argentina
12.6.9.1 Argentina Nematicides Market Estimates And Forecasts, By Type (2020-2032) (USD Billion)
12.6.9.2 Argentina Nematicides Market Estimates And Forecasts, By Crop Type (2020-2032) (USD Billion)
12.6.9.3 Argentina Nematicides Market Estimates And Forecasts, By Formulation (2020-2032) (USD Billion)
12.6.9.4 Argentina Nematicides Market Estimates And Forecasts, By Nematode Type(2020-2032) (USD Billion)
12.6.9.5 Argentina Nematicides Market Estimates And Forecasts, By Mode of Application (2020-2032) (USD Billion)
12.6.10 Colombia
12.6.10.1 Colombia Nematicides Market Estimates And Forecasts, By Type (2020-2032) (USD Billion)
12.6.10.2 Colombia Nematicides Market Estimates And Forecasts, By Crop Type (2020-2032) (USD Billion)
12.6.10.3 Colombia Nematicides Market Estimates And Forecasts, By Formulation (2020-2032) (USD Billion)
12.6.10.4 Colombia Nematicides Market Estimates And Forecasts, By Nematode Type(2020-2032) (USD Billion)
12.6.10.5 Colombia Nematicides Market Estimates And Forecasts, By Mode of Application (2020-2032) (USD Billion)
12.6.11 Rest Of Latin America
12.6.11.1 Rest Of Latin America Nematicides Market Estimates And Forecasts, By Type (2020-2032) (USD Billion)
12.6.11.2 Rest Of Latin America Nematicides Market Estimates And Forecasts, By Crop Type (2020-2032) (USD Billion)
12.6.11.3 Rest Of Latin America Nematicides Market Estimates And Forecasts, By Formulation (2020-2032) (USD Billion)
12.6.11.4 Rest Of Latin America Nematicides Market Estimates And Forecasts, By Nematode Type(2020-2032) (USD Billion)
12.6.11.5 Rest Of Latin America Nematicides Market Estimates And Forecasts, By Mode of Application (2020-2032) (USD Billion)
13. Company Profiles
13.1 BASF SE
13.1.1 Company Overview
13.1.2 Financial
13.1.3 Products/ Services Offered
13.1.4 SWOT Analysis
13.2 Bayer AG
13.2.1 Company Overview
13.2.2 Financial
13.2.3 Products/ Services Offered
13.2.4 SWOT Analysis
13.3 Corteva Agriscience
13.3.1 Company Overview
13.3.2 Financial
13.3.3 Products/ Services Offered
13.3.4 SWOT Analysis
13.4 Syngenta AG
13.4.1 Company Overview
13.4.2 Financial
13.4.3 Products/ Services Offered
13.4.4 SWOT Analysis
13.5 FMC Corporation
13.5.1 Company Overview
13.5.2 Financial
13.5.3 Products/ Services Offered
13.5.4 SWOT Analysis
13.6 UPL Limited
13.6.1 Company Overview
13.6.2 Financial
13.6.3 Products/ Services Offered
13.6.4 SWOT Analysis
13.7 American Vanguard Corporation
13.7.1 Company Overview
13.7.2 Financial
13.7.3 Products/ Services Offered
13.7.4 SWOT Analysis
13.8 Nufarm
13.8.1 Company Overview
13.8.2 Financial
13.8.3 Products/ Services Offered
13.8.4 SWOT Analysis
13.9 ADAMA Agricultural Solutions Ltd.
13.9.1 Company Overview
13.9.2 Financial
13.9.3 Products/ Services Offered
13.9.4 SWOT Analysis
13.10 Valent BioSciences LLC
13.10.1 Company Overview
13.10.2 Financial
13.10.3 Products/ Services Offered
13.10.4 SWOT Analysis
14. Use Cases and Best Practices
15. Conclusion
An accurate research report requires proper strategizing as well as implementation. There are multiple factors involved in the completion of good and accurate research report and selecting the best methodology to compete the research is the toughest part. Since the research reports we provide play a crucial role in any company’s decision-making process, therefore we at SNS Insider always believe that we should choose the best method which gives us results closer to reality. This allows us to reach at a stage wherein we can provide our clients best and accurate investment to output ratio.
Each report that we prepare takes a timeframe of 350-400 business hours for production. Starting from the selection of titles through a couple of in-depth brain storming session to the final QC process before uploading our titles on our website we dedicate around 350 working hours. The titles are selected based on their current market cap and the foreseen CAGR and growth.
The 5 steps process:
Step 1: Secondary Research:
Secondary Research or Desk Research is as the name suggests is a research process wherein, we collect data through the readily available information. In this process we use various paid and unpaid databases which our team has access to and gather data through the same. This includes examining of listed companies’ annual reports, Journals, SEC filling etc. Apart from this our team has access to various associations across the globe across different industries. Lastly, we have exchange relationships with various university as well as individual libraries.

Step 2: Primary Research
When we talk about primary research, it is a type of study in which the researchers collect relevant data samples directly, rather than relying on previously collected data. This type of research is focused on gaining content specific facts that can be sued to solve specific problems. Since the collected data is fresh and first hand therefore it makes the study more accurate and genuine.
We at SNS Insider have divided Primary Research into 2 parts.
Part 1 wherein we interview the KOLs of major players as well as the upcoming ones across various geographic regions. This allows us to have their view over the market scenario and acts as an important tool to come closer to the accurate market numbers. As many as 45 paid and unpaid primary interviews are taken from both the demand and supply side of the industry to make sure we land at an accurate judgement and analysis of the market.
This step involves the triangulation of data wherein our team analyses the interview transcripts, online survey responses and observation of on filed participants. The below mentioned chart should give a better understanding of the part 1 of the primary interview.

Part 2: In this part of primary research the data collected via secondary research and the part 1 of the primary research is validated with the interviews from individual consultants and subject matter experts.
Consultants are those set of people who have at least 12 years of experience and expertise within the industry whereas Subject Matter Experts are those with at least 15 years of experience behind their back within the same space. The data with the help of two main processes i.e., FGDs (Focused Group Discussions) and IDs (Individual Discussions). This gives us a 3rd party nonbiased primary view of the market scenario making it a more dependable one while collation of the data pointers.
Step 3: Data Bank Validation
Once all the information is collected via primary and secondary sources, we run that information for data validation. At our intelligence centre our research heads track a lot of information related to the market which includes the quarterly reports, the daily stock prices, and other relevant information. Our data bank server gets updated every fortnight and that is how the information which we collected using our primary and secondary information is revalidated in real time.

Step 4: QA/QC Process
After all the data collection and validation our team does a final level of quality check and quality assurance to get rid of any unwanted or undesired mistakes. This might include but not limited to getting rid of the any typos, duplication of numbers or missing of any important information. The people involved in this process include technical content writers, research heads and graphics people. Once this process is completed the title gets uploader on our platform for our clients to read it.
Step 5: Final QC/QA Process:
This is the last process and comes when the client has ordered the study. In this process a final QA/QC is done before the study is emailed to the client. Since we believe in giving our clients a good experience of our research studies, therefore, to make sure that we do not lack at our end in any way humanly possible we do a final round of quality check and then dispatch the study to the client.
Key Segments:
By Type
Chemical
Fumigants
Organophosphates
Carbamates
Non-Fumigant Nematicides
Others
Biological
Microbials
Biochemical
Macrobials
Bionematicides
By Crop Type
Field Crops
Horticultural Crops
Commercial Crops
Turf & Ornamental Crops
Protected Cultivation / Greenhouse Crops
Others
By Formulation
Granular
Liquid
Water-Dispersible Powder (WDP)
Emulsifiable Concentrates (EC)
Gels & Pastes
Others
By Nematode Type
Root-Knot Nematodes
Cyst Nematodes
Lesion Nematodes
Others
By Mode of Application
Drenching
Soil Dressing
Seed Treatment
Fumigation
Others
Request for Segment Customization as per your Business Requirement: Segment Customization Request
Regional Coverage:
North America
US
Canada
Mexico
Europe
Eastern Europe
Poland
Romania
Hungary
Turkey
Rest of Eastern Europe
Western Europe
Germany
France
UK
Italy
Spain
Netherlands
Switzerland
Austria
Rest of Western Europe
Asia Pacific
China
India
Japan
South Korea
Vietnam
Singapore
Australia
Rest of Asia Pacific
Middle East & Africa
Middle East
UAE
Egypt
Saudi Arabia
Qatar
Rest of Middle East
Africa
Nigeria
South Africa
Rest of Africa
Latin America
Brazil
Argentina
Colombia
Rest of Latin America
Request for Country Level Research Report: Country Level Customization Request
Available Customization
With the given market data, SNS Insider offers customization as per the company’s specific needs. The following customization options are available for the report:
Detailed Volume Analysis
Criss-Cross segment analysis (e.g. Product X Application)
Competitive Product Benchmarking
Geographic Analysis
Additional countries in any of the regions
Customized Data Representation
Detailed analysis and profiling of additional market players
The N-Methyltaurine Sodium Salt Market Size was valued at USD 0.65 Billion in 2023 and is expected to reach USD 1.08 Billion by 2032, growing at a CAGR of 5.80% over the forecast period of 2024-2032.
The Palmitic Acid Market Size was valued at USD 301.7 million in 2023, and is expected to reach USD 384.6 million by 2032, and grow at a CAGR of 2.8% over the forecast period 2024-2032.
The Photoinitiator Market size was USD 2.40 billion in 2023 and is expected to reach USD 4.39 billion by 2032 and grow at a CAGR of 6.92% over the forecast period of 2024-2032.
The Heat-Resistant coatings market size was valued at USD 6.80 billion in 2023 and is expected to reach USD 10.60 billion by 2032 and grow at a CAGR of 5.06% over the forecast period 2024-2032.
The Acetonitrile Market size was USD 414.94 Million in 2023 and is expected to reach USD 692.74 Million by 2032, growing at a CAGR of 5.86 % from 2024-2032.
Cold Chain Packaging Market size was USD 25.8 Billion in 2023 and is expected to reach USD 70.4 Billion by 2032 and grow at a CAGR of 11.82% from 2024-2032.

Hi! Click one of our member below to chat on Phone
© 2025 All Rights Reserved by SNS Insider Pvt Ltd


