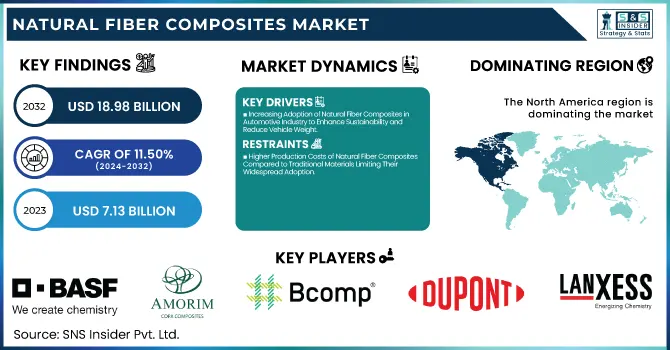
The Natural Fiber Composites Market Size was valued at USD 7.13 Billion in 2023 and is expected to reach USD 18.98 Billion by 2032, growing at a CAGR of 11.50% over the forecast period of 2024-2032.
To Get more information on Natural Fiber Composites Market - Request Free Sample Report
As the Natural Fiber Composites Market continues to grow, industries are turning towards more sustainable materials. Our report uncovers the journey of these composites, beginning with the supply chain analysis, where key suppliers and distribution networks play a crucial role. The report also focusses on the cost structure, revealing how production costs compare to traditional materials. The report dives into trade analysis, shedding light on shifting export-import trends and raw material price fluctuations. Sustainability is at the forefront, with carbon footprint metrics showing how these composites contribute to a greener future. Finally, regional trade agreements are examined, highlighting how policies shape the market’s direction. This comprehensive analysis provides a clear view of the market’s evolving landscape.
Drivers
Increasing Adoption of Natural Fiber Composites in Automotive Industry to Enhance Sustainability and Reduce Vehicle Weight
As the automotive industry focuses on enhancing durability without compromising performance, it is witnessing a transformative shift in the way that automotive manufacturers are increasingly turning to natural fiber composites to reduce the weight of their vehicles. As these materials are lighter than traditional materials including metals, they help boost fuel efficiency and also reduce emissions. Moreover, the growing emphasis on promoting sustainability in the manufacturing processes has caused a surge in the adoption of eco-friendly and renewable materials such as natural fiber composites. From automobile interior panels, door panels, to dashboards, natural fiber composites are gaining traction among automakers due to the paradigm shift towards reduced weight and fuel-efficient, and eco-friendly vehicles. As more consumers realize the environmental cost of automotive production, their appetite for sustainable alternatives is only swelling. They are being increasingly used in composites due to their good mechanical properties, lower cost, lower density, and compliance with strict environmental regulations. As the automotive sector strives to achieve lower carbon footprints and improve energy efficiency, the demand for composites is anticipated to propel market growth in the forecast period.
Restraints
Higher Production Costs of Natural Fiber Composites Compared to Traditional Materials Limiting Their Widespread Adoption
The incorporation of natural fibers for composite applications has numerous environmental benefits compared to synthetic fibers but still has higher production costs than standard materials such as plastics and metals. In price sensitive sectors, this discrepancy can lead some manufacturers to view the benefits of moving to natural fibre composites as impossible to justify. The extraction, processing, and treatment of natural fibers to enhance their properties incurs extra costs in the production process. In addition, the requirement for specialized production methods and equipment also add to the cost. In cost-sensitive sectors like automotive and construction, the relatively high initial expense of natural fiber composites may prove a barrier. Manufacturers need to find innovative processing technologies, scale production, and establish the supply chain efficiencies needed to lower production costs enough to make these materials commercially viable. Until these cost obstacles can be overcome, the use of natural fiber composites will be limited in several industries.
Opportunities
Expansion of the Natural Fiber Composites Market in Emerging Economies with Growing Industrialization and Sustainability Focus
The natural fiber composites market depicts the opportunity in the emerging economies such as Asia Pacific, Latin America, etc. As industrialization accelerates and sustainability becomes a priority, these markets demand eco-friendly materials in various sectors. Stricter legislation in those areas that regulates pollution and carbon emissions is opening a great opportunity for natural fibers composites. Furthermore, natural fibers include a wide range of different types of fibers, and such regions also have a good deal of accessibility to raw materials such as bamboo, jute, hemp, etc., which also makes them the most preferred locations for sourcing natural fibers. With the increasing awareness of consumers concerning environmental issues, it is expected that consumers and manufacturers in these emerging economies continue seeking alternatives to plastics and metals in the production of their goods, which should represent a big opportunity for natural fiber composites. Over the coming years, the rising construction of infrastructures, especially green buildings, will boost the demand for these composites in the market.
Challenge
Lack of Standardization and Consistent Quality Control for Natural Fiber Composites Limiting Widespread Adoption
Lack of standardized processes for manufacturing and quality control is a major challenge for the natural fiber composites market. There are no universal standards for natural fiber composites as there are for metals and plastics, so there are no conservation production guidelines for the composite products. Different processing methods and raw material conditions along with variations in treatment processes cause inconsistencies to natural fiber composites which make them less attractive and a less desired candidate for industrial processes that require solid quality and reliability. The absence of standardization results in ambiguity for end-users as well as producers, restraining the commercial acceptance of natural fiber composites. There is an industry need for standards around what your identity constitutes, as well as standards around the authentication / certification procedures that you will go through. Such initiatives will contribute to ensuring consistency, durability, and performance of natural fibre composites and promote greater confidence in their application in different sectors.
By Raw Material
In 2023, wood segment dominated the natural fiber composites market and accounted for the largest share of about 52.10%. Wood is the most commonly available and economical material for softwood, displaying optimal properties in terms of mechanical resistance, stiffness, and low density, leading to widespread usage in composite applications. Wood fibers are commonly used in the automotive, construction, and furniture industries, because of their sustainability and lower environmental impact. This growth in the use of wood-based natural fiber composites has also been driven by support from associations such as the European Composites Industry Association (EuCIA), as well as favourable government policies aimed at encouraging sustainable manufacturing. Adhesive-based wood composites also enable industries to meet sustainability goals further driving the segment growth.
By Resin
Polypropylene (PP) dominated the Natural Fiber Composites market in 2023, and held 48.3% of the share. This dominance is due to the benefits of polypropylene, such as being low cost and offering great chemical resistance and ease of processing, making it an obvious choice for the production of composites with natural fibers. Polypropylene based composites provide excellent durability, which makes them more preferable in the manufacturing of interiors panels, bumpers, and dashboards of the automotive sector. There is also a growing emphasis on sustainability in the automotive sector whether in the form of regulatory oversight or through initiatives like the European Union's push towards greener automotive production, which further contributes to the increasing demand for polypropylene-based natural fiber composites.
By Matrix Type
The Inorganic Compound dominated the Natural Fiber Composites market and accounted for a market share of about 54.2% share in 2023. Inorganic compounds like glass fiber and mineral-based composites are generally preferred, as they offer high strength, superior thermal stability, and better fire resistance. Such properties have made inorganic compounds ideal for use in the automotive and construction industries where safety and durability are of utmost importance. Moreover, compared to organic matrices, inorganic matrices are less susceptible to moisture absorption, which improves the performance of natural fiber composites in demanding environments. Porous silica has dominated the inorganic and access to high performance applications has been the main driving force behind the market share.
By Technology
The injection molding dominated the Natural Fiber Composites market with a 46.90% share in 2023. This technology is widely used due to its rapid, cost-effective mass production capability, as well as its ability to create intricate shapes capitalizing on the elements of the automotive and consumer goods sectors. The ability of injection molding to accurately control the fiber distribution and resin matrix results in enhanced mechanical properties of the obtained composites. Its major share in the global market is attributed to the increasing adoption of injection molding in automotive manufacturing, with a corresponding demand for lightweight and durable parts. The American Composites Manufacturers Association (ACMA) and other industry groups still tout the benefits of injection molding in making quality natural fiber composite components.
By End-use Industry
In 2023, the automotive industry dominated the Natural Fiber Composites based on end use and accounted for 58.70% market share. A huge driving force in automotive manufacturing is the need for lightweight, durable, and sustainable materials. Natural fiber composites find wide application in automotive components, including interior panels, bumpers, and door trims, where they are employed to reduce vehicle weight and improve fuel economy. These favorable factors are complemented by stricter automotive regulations, including CO2 emissions in the European Union, that encourage the use of innovative materials, including natural fiber composites, to reduce the carbon footprint of the automotive sector. These trends help retain the automotive industry as the major consumer for natural fiber composites.
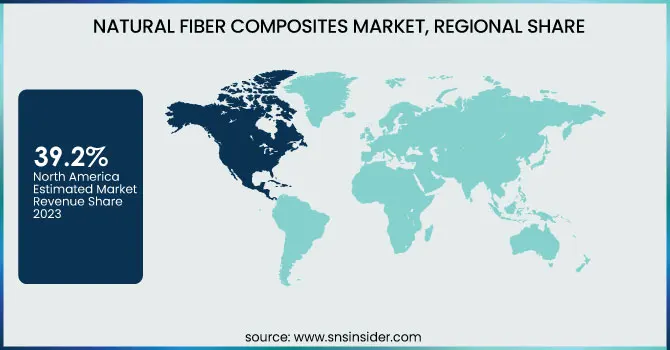
In 2023, North America dominated the Natural Fiber Composites market, holding a significant market share of around 39.2%. The region accounted for a large percentage of the global market, driven by robust demand in the automotive, construction, and consumer goods industries. In particular, the United States has been a key player, with the automotive industry leading the charge in adopting sustainable materials. The U.S. government’s support for eco-friendly manufacturing through initiatives like the Clean Energy Standard and increasing investments in sustainable technologies have propelled the demand for natural fiber composites. Additionally, leading companies in North America, such as Trex Company, Inc., have pushed the use of wood-based composites in decking and building materials, further enhancing regional market growth. North America’s high level of awareness regarding sustainability, coupled with regulatory support, solidifies its dominance in the market.
On the other hand, Asia Pacific emerged as the fastest-growing region in the Natural Fiber Composites market, with a significant growth rate in the forecast period. The growth is primarily fueled by the rapid industrialization and urbanization in countries such as China, India, and Japan, which have led to an increasing demand for sustainable materials in various sectors. For instance, China’s automotive industry is adopting natural fiber composites to reduce vehicle weight and meet stricter emissions regulations. Furthermore, India’s growing focus on sustainable construction materials has driven the demand for natural fiber composites in the building and infrastructure sector. The rapid expansion of industries like automotive and construction, coupled with the region’s push toward eco-friendly manufacturing practices, has made Asia Pacific a key growth area for natural fiber composites. This region’s favorable government policies and large manufacturing base further contribute to its significant growth.
Get Customized Report as per Your Business Requirement - Enquiry Now
Key Players
A B Composites Pvt. Ltd. (Natural Fiber Composites, Bio-based Resin Composites)
Amorim Cork Composites S.A. (Cork Composites, Cork Panels)
BASF SE (Ecovio, Ultramid)
Bcomp Ltd. (AmpliTex, PowerRibs)
DuPont (Hytrel, Sorona)
Fibre Extrusion Technology Ltd. (Natural Fiber Filament, Bio-based Fibers)
FlexForm Technologies (Ecoflex, FlexForm Natural Fiber Composites)
Green Dot Bioplastics (Terratek SC, Terratek C3)
Green Dot Bioplastics Inc. (Terratek SC, Terratek C3)
JELU-WERK J. Ehrler GmbH & Co. KG (JELUwood, JELU Fiber)
JNC Corporation (JNC Biocomposite, Natural Fiber Reinforced Plastics)
Lanxess AG (Tepex, Durethan)
Lingrove Inc. (Ekoa, Ecores)
Owens Corning (Owens Corning Natural Fiber Composites, Flexural Composite Panels)
Plasthill Oy (Biofiber Composites, Sustainable Natural Fiber Products)
Polyvlies Franz Beyer GmbH (Biofiber Nonwoven Fabrics, Polyvlies Composites)
Procotex (Natural Fiber Yarns, Fiber Reinforced Plastics)
Solvay S.A. (Amodel, Technyl)
TECNARO GMBH (Arboform, Arbosheet)
Trex Company, Inc. (Trex Decking, Trex Transcend)
Recent Highlights
May 2024: Toray Advanced Composites added capacity and capability for continuous fiber thermoplastic composites in response to increasing customer demand in aerospace and automotive markets. To boost production efficiency and product performance and consolidate its presence in the advanced composites market, Toray is now investing in additional new machinery.
| Report Attributes | Details |
|---|---|
| Market Size in 2023 | USD 7.13 Billion |
| Market Size by 2032 | USD 18.98 Billion |
| CAGR | CAGR of 11.50% From 2024 to 2032 |
| Base Year | 2023 |
| Forecast Period | 2024-2032 |
| Historical Data | 2020-2022 |
| Report Scope & Coverage | Market Size, Segments Analysis, Competitive Landscape, Regional Analysis, DROC & SWOT Analysis, Forecast Outlook |
| Key Segments | •By Raw Material (Wood, Cotton, Flax, Kenaf, Hemp, Others) •By Resin (Polypropylene (PP), Polyethylene (PE), Polyamide (PA), Others) •By Matrix Type (Inorganic Compound, Natural Polymer, Synthetic Polymer) •By Technology (Injection Molding, Compression Molding, Pultrusion, Others) •By End-use Industry (Automotive, Electronics, Sporting Goods, Construction, Others) |
| Regional Analysis/Coverage | North America (US, Canada, Mexico), Europe (Eastern Europe [Poland, Romania, Hungary, Turkey, Rest of Eastern Europe] Western Europe] Germany, France, UK, Italy, Spain, Netherlands, Switzerland, Austria, Rest of Western Europe]), Asia Pacific (China, India, Japan, South Korea, Vietnam, Singapore, Australia, Rest of Asia Pacific), Middle East & Africa (Middle East [UAE, Egypt, Saudi Arabia, Qatar, Rest of Middle East], Africa [Nigeria, South Africa, Rest of Africa], Latin America (Brazil, Argentina, Colombia, Rest of Latin America) |
| Company Profiles | Trex Company, Inc., Bcomp Ltd., TECNARO GMBH, UPM, DuPont, Toray Industries, Inc., Solvay S.A., BASF SE, Owens Corning, Lanxess AG and other key players |
Ans: The Natural Fiber Composites Market is valued at USD 7.13 Billion in 2023.
Ans: The Natural Fiber Composites Market is projected to grow at a CAGR of 11.50% over the forecast period of 2024-2032.
Ans: The automotive industry is primarily driving the growth of the Natural Fiber Composites Market through increased sustainability initiatives.
Ans: The wood segment dominated the Natural Fiber Composites Market, accounting for approximately 52.10% of the market share in 2023.
Ans: North America dominated the Natural Fiber Composites Market, accounting for around 40.5% of the market share in 2023.
Table of Contents:
1. Introduction
1.1 Market Definition
1.2 Scope (Inclusion and Exclusions)
1.3 Research Assumptions
2. Executive Summary
2.1 Market Overview
2.2 Regional Synopsis
2.3 Competitive Summary
3. Research Methodology
3.1 Top-Down Approach
3.2 Bottom-up Approach
3.3. Data Validation
3.4 Primary Interviews
4. Market Dynamics Impact Analysis
4.1 Market Driving Factors Analysis
4.1.1 Drivers
4.1.2 Restraints
4.2 PESTLE Analysis
4.3 Porter’s Five Forces Model
5. Statistical Insights and Trends Reporting
5.1 Supply Chain Analysis
5.2 Cost Structure Analysis
5.3 Trade Analysis (Export & Import Data)
5.4 Raw Material Price Trends
5.5 Carbon Footprint & Sustainability Metrics
6. Competitive Landscape
6.1 List of Major Companies, By Region
6.2 Market Share Analysis, By Region
6.3 Product Benchmarking
6.3.1 Product specifications and features
6.3.2 Pricing
6.4 Strategic Initiatives
6.4.1 Marketing and promotional activities
6.4.2 Distribution and supply chain strategies
6.4.3 Expansion plans and new product launches
6.4.4 Strategic partnerships and collaborations
6.5 Technological Advancements
6.6 Market Positioning and Branding
7. Natural Fiber Composites Market Segmentation, By Raw Material
7.1 Chapter Overview
7.2 Wood
7.2.1 Wood Market Trends Analysis (2020-2032)
7.2.2 Wood Market Size Estimates and Forecasts to 2032 (USD Billion)
7.3 Cotton
7.3.1 Cotton Market Trends Analysis (2020-2032)
7.3.2 Cotton Market Size Estimates and Forecasts to 2032 (USD Billion)
7.4 Flax
7.4.1 Flax Market Trends Analysis (2020-2032)
7.4.2 Flax Market Size Estimates and Forecasts to 2032 (USD Billion)
7.5 Kenaf
7.5.1 Kenaf Market Trends Analysis (2020-2032)
7.5.2 Kenaf Market Size Estimates and Forecasts to 2032 (USD Billion)
7.6 Hemp
7.6.1 Hemp Market Trends Analysis (2020-2032)
7.6.2 Hemp Market Size Estimates and Forecasts to 2032 (USD Billion)
7.7 Others
7.7.1 Others Market Trends Analysis (2020-2032)
7.7.2 Others Market Size Estimates and Forecasts to 2032 (USD Billion)
8. Natural Fiber Composites Market Segmentation, By Resin
8.1 Chapter Overview
8.2 Polypropylene (PP)
8.2.1 Polypropylene (PP) Market Trends Analysis (2020-2032)
8.2.2 Polypropylene (PP) Market Size Estimates And Forecasts To 2032 (USD Billion)
8.3 Polyethylene (PE)
8.3.1 Polyethylene (PE) Market Trends Analysis (2020-2032)
8.3.2 Polyethylene (PE) Market Size Estimates And Forecasts To 2032 (USD Billion)
8.4 Polyamide (PA)
8.4.1 Polyamide (PA) Market Trends Analysis (2020-2032)
8.4.2 Polyamide (PA) Market Size Estimates And Forecasts To 2032 (USD Billion)
8.5 Others
8.5.1 Others Market Trends Analysis (2020-2032)
8.5.2 Others Market Size Estimates And Forecasts To 2032 (USD Billion)
9. Natural Fiber Composites Market Segmentation, By Matrix Type
9.1 Chapter Overview
9.2 Inorganic Compound
9.2.1 Inorganic Compound Market Trends Analysis (2020-2032)
9.2.2 Inorganic Compound Market Size Estimates And Forecasts To 2032 (USD Billion)
9.3 Natural Polymer
9.3.1 Natural Polymer Market Trends Analysis (2020-2032)
9.3.2 Natural Polymer Market Size Estimates And Forecasts To 2032 (USD Billion)
9.4 Synthetic Polymer
9.4.1 Synthetic Polymer Market Trends Analysis (2020-2032)
9.4.2 Synthetic Polymer Market Size Estimates And Forecasts To 2032 (USD Billion)
10. Natural Fiber Composites Market Segmentation, By Technology
10.1 Chapter Overview
10.2 Injection Molding
10.2.1 Injection Molding Market Trends Analysis (2020-2032)
10.2.2 Injection Molding Market Size Estimates And Forecasts To 2032 (USD Billion)
10.3 Compression Molding
10.3.1 Compression Molding Market Trends Analysis (2020-2032)
10.3.2 Compression Molding Market Size Estimates And Forecasts To 2032 (USD Billion)
10.4 Pultrusion
10.4.1 Pultrusion Market Trends Analysis (2020-2032)
10.4.2 Pultrusion Market Size Estimates And Forecasts To 2032 (USD Billion)
10.5 Others
10.5.1 Others Market Trends Analysis (2020-2032)
10.5.2 Others Market Size Estimates And Forecasts To 2032 (USD Billion)
11. Natural Fiber Composites Market Segmentation, By End-use Industry
11.1 Chapter Overview
11.2 Automotive
11.2.1 Automotive Market Trends Analysis (2020-2032)
11.2.2 Automotive Market Size Estimates And Forecasts To 2032 (USD Billion)
11.3 Electronics
11.3.1 Electronics Market Trends Analysis (2020-2032)
11.3.2 Electronics Market Size Estimates And Forecasts To 2032 (USD Billion)
11.4 Sporting Goods
11.4.1 Sporting Goods Market Trends Analysis (2020-2032)
11.4.2 Sporting Goods Market Size Estimates And Forecasts To 2032 (USD Billion)
11.5 Construction
11.5.1 Construction Market Trends Analysis (2020-2032)
11.5.2 Construction Market Size Estimates And Forecasts To 2032 (USD Billion)
11.6 Others
11.6.1 Others Market Trends Analysis (2020-2032)
11.6.2 Others Market Size Estimates And Forecasts To 2032 (USD Billion)
12. Regional Analysis
12.1 Chapter Overview
12.2 North America
12.2.1 Trends Analysis
12.2.2 North America Natural Fiber Composites Market Estimates And Forecasts, By Country (2020-2032) (USD Billion)
12.2.3 North America Natural Fiber Composites Market Estimates And Forecasts, By Raw Material (2020-2032) (USD Billion)
12.2.4 North America Natural Fiber Composites Market Estimates And Forecasts, By Resin (2020-2032) (USD Billion)
12.2.5 North America Natural Fiber Composites Market Estimates And Forecasts, By Matrix Type (2020-2032) (USD Billion)
12.2.6 North America Natural Fiber Composites Market Estimates And Forecasts, By Technology (2020-2032) (USD Billion)
12.2.7 North America Natural Fiber Composites Market Estimates And Forecasts, By End-use Industry (2020-2032) (USD Billion)
12.2.8 USA
12.2.8.1 USA Natural Fiber Composites Market Estimates And Forecasts, By Raw Material (2020-2032) (USD Billion)
12.2.8.2 USA Natural Fiber Composites Market Estimates And Forecasts, By Resin (2020-2032) (USD Billion)
12.2.8.3 USA Natural Fiber Composites Market Estimates And Forecasts, By Matrix Type (2020-2032) (USD Billion)
12.2.8.4 USA Natural Fiber Composites Market Estimates And Forecasts, By Technology (2020-2032) (USD Billion)
12.2.8.5 USA Natural Fiber Composites Market Estimates And Forecasts, By End-use Industry (2020-2032) (USD Billion)
12.2.9 Canada
12.2.9.1 Canada Natural Fiber Composites Market Estimates And Forecasts, By Raw Material (2020-2032) (USD Billion)
12.2.9.2 Canada Natural Fiber Composites Market Estimates And Forecasts, By Resin (2020-2032) (USD Billion)
12.2.9.3 Canada Natural Fiber Composites Market Estimates And Forecasts, By Matrix Type (2020-2032) (USD Billion)
12.2.9.4 Canada Natural Fiber Composites Market Estimates And Forecasts, By Technology (2020-2032) (USD Billion)
12.2.9.5 Canada Natural Fiber Composites Market Estimates And Forecasts, By End-use Industry (2020-2032) (USD Billion)
12.2.10 Mexico
12.2.10.1 Mexico Natural Fiber Composites Market Estimates And Forecasts, By Raw Material (2020-2032) (USD Billion)
12.2.10.2 Mexico Natural Fiber Composites Market Estimates And Forecasts, By Resin (2020-2032) (USD Billion)
12.2.10.3 Mexico Natural Fiber Composites Market Estimates And Forecasts, By Matrix Type (2020-2032) (USD Billion)
12.2.10.4 Mexico Natural Fiber Composites Market Estimates And Forecasts, By Technology (2020-2032) (USD Billion)
12.2.10.5 Mexico Natural Fiber Composites Market Estimates And Forecasts, By End-use Industry (2020-2032) (USD Billion)
12.3 Europe
12.3.1 Eastern Europe
12.3.1.1 Trends Analysis
12.3.1.2 Eastern Europe Natural Fiber Composites Market Estimates And Forecasts, By Country (2020-2032) (USD Billion)
12.3.1.3 Eastern Europe Natural Fiber Composites Market Estimates And Forecasts, By Raw Material (2020-2032) (USD Billion)
12.3.1.4 Eastern Europe Natural Fiber Composites Market Estimates And Forecasts, By Resin (2020-2032) (USD Billion)
12.3.1.5 Eastern Europe Natural Fiber Composites Market Estimates And Forecasts, By Matrix Type (2020-2032) (USD Billion)
12.3.1.6 Eastern Europe Natural Fiber Composites Market Estimates And Forecasts, By Technology (2020-2032) (USD Billion)
12.3.1.7 Eastern Europe Natural Fiber Composites Market Estimates And Forecasts, By End-use Industry (2020-2032) (USD Billion)
12.3.1.8 Poland
12.3.1.8.1 Poland Natural Fiber Composites Market Estimates And Forecasts, By Raw Material (2020-2032) (USD Billion)
12.3.1.8.2 Poland Natural Fiber Composites Market Estimates And Forecasts, By Resin (2020-2032) (USD Billion)
12.3.1.8.3 Poland Natural Fiber Composites Market Estimates And Forecasts, By Matrix Type (2020-2032) (USD Billion)
12.3.1.8.4 Poland Natural Fiber Composites Market Estimates And Forecasts, By Technology (2020-2032) (USD Billion)
12.3.1.8.5 Poland Natural Fiber Composites Market Estimates And Forecasts, By End-use Industry (2020-2032) (USD Billion)
12.3.1.9 Romania
12.3.1.9.1 Romania Natural Fiber Composites Market Estimates And Forecasts, By Raw Material (2020-2032) (USD Billion)
12.3.1.9.2 Romania Natural Fiber Composites Market Estimates And Forecasts, By Resin (2020-2032) (USD Billion)
12.3.1.9.3 Romania Natural Fiber Composites Market Estimates And Forecasts, By Matrix Type (2020-2032) (USD Billion)
12.3.1.9.4 Romania Natural Fiber Composites Market Estimates And Forecasts, By Technology (2020-2032) (USD Billion)
12.3.1.9.5 Romania Natural Fiber Composites Market Estimates And Forecasts, By End-use Industry (2020-2032) (USD Billion)
12.3.1.10 Hungary
12.3.1.10.1 Hungary Natural Fiber Composites Market Estimates And Forecasts, By Raw Material (2020-2032) (USD Billion)
12.3.1.10.2 Hungary Natural Fiber Composites Market Estimates And Forecasts, By Resin (2020-2032) (USD Billion)
12.3.1.10.3 Hungary Natural Fiber Composites Market Estimates And Forecasts, By Matrix Type (2020-2032) (USD Billion)
12.3.1.10.4 Hungary Natural Fiber Composites Market Estimates And Forecasts, By Technology (2020-2032) (USD Billion)
12.3.1.10.5 Hungary Natural Fiber Composites Market Estimates And Forecasts, By End-use Industry (2020-2032) (USD Billion)
12.3.1.11 Turkey
12.3.1.11.1 Turkey Natural Fiber Composites Market Estimates And Forecasts, By Raw Material (2020-2032) (USD Billion)
12.3.1.11.2 Turkey Natural Fiber Composites Market Estimates And Forecasts, By Resin (2020-2032) (USD Billion)
12.3.1.11.3 Turkey Natural Fiber Composites Market Estimates And Forecasts, By Matrix Type (2020-2032) (USD Billion)
12.3.1.11.4 Turkey Natural Fiber Composites Market Estimates And Forecasts, By Technology (2020-2032) (USD Billion)
12.3.1.11.5 Turkey Natural Fiber Composites Market Estimates And Forecasts, By End-use Industry (2020-2032) (USD Billion)
12.3.1.12 Rest Of Eastern Europe
12.3.1.12.1 Rest Of Eastern Europe Natural Fiber Composites Market Estimates And Forecasts, By Raw Material (2020-2032) (USD Billion)
12.3.1.12.2 Rest Of Eastern Europe Natural Fiber Composites Market Estimates And Forecasts, By Resin (2020-2032) (USD Billion)
12.3.1.12.3 Rest Of Eastern Europe Natural Fiber Composites Market Estimates And Forecasts, By Matrix Type (2020-2032) (USD Billion)
12.3.1.12.4 Rest Of Eastern Europe Natural Fiber Composites Market Estimates And Forecasts, By Technology (2020-2032) (USD Billion)
12.3.1.12.5 Rest Of Eastern Europe Natural Fiber Composites Market Estimates And Forecasts, By End-use Industry (2020-2032) (USD Billion)
12.3.2 Western Europe
12.3.2.1 Trends Analysis
12.3.2.2 Western Europe Natural Fiber Composites Market Estimates And Forecasts, By Country (2020-2032) (USD Billion)
12.3.2.3 Western Europe Natural Fiber Composites Market Estimates And Forecasts, By Raw Material (2020-2032) (USD Billion)
12.3.2.4 Western Europe Natural Fiber Composites Market Estimates And Forecasts, By Resin (2020-2032) (USD Billion)
12.3.2.5 Western Europe Natural Fiber Composites Market Estimates And Forecasts, By Matrix Type (2020-2032) (USD Billion)
12.3.2.6 Western Europe Natural Fiber Composites Market Estimates And Forecasts, By Technology (2020-2032) (USD Billion)
12.3.2.7 Western Europe Natural Fiber Composites Market Estimates And Forecasts, By End-use Industry (2020-2032) (USD Billion)
12.3.2.8 Germany
12.3.2.8.1 Germany Natural Fiber Composites Market Estimates And Forecasts, By Raw Material (2020-2032) (USD Billion)
12.3.2.8.2 Germany Natural Fiber Composites Market Estimates And Forecasts, By Resin (2020-2032) (USD Billion)
12.3.2.8.3 Germany Natural Fiber Composites Market Estimates And Forecasts, By Matrix Type (2020-2032) (USD Billion)
12.3.2.8.4 Germany Natural Fiber Composites Market Estimates And Forecasts, By Technology (2020-2032) (USD Billion)
12.3.2.8.5 Germany Natural Fiber Composites Market Estimates And Forecasts, By End-use Industry (2020-2032) (USD Billion)
12.3.2.9 France
12.3.2.9.1 France Natural Fiber Composites Market Estimates And Forecasts, By Raw Material (2020-2032) (USD Billion)
12.3.2.9.2 France Natural Fiber Composites Market Estimates And Forecasts, By Resin (2020-2032) (USD Billion)
12.3.2.9.3 France Natural Fiber Composites Market Estimates And Forecasts, By Matrix Type (2020-2032) (USD Billion)
12.3.2.9.4 France Natural Fiber Composites Market Estimates And Forecasts, By Technology (2020-2032) (USD Billion)
12.3.2.9.5 France Natural Fiber Composites Market Estimates And Forecasts, By End-use Industry (2020-2032) (USD Billion)
12.3.2.10 UK
12.3.2.10.1 UK Natural Fiber Composites Market Estimates And Forecasts, By Raw Material (2020-2032) (USD Billion)
12.3.2.10.2 UK Natural Fiber Composites Market Estimates And Forecasts, By Resin (2020-2032) (USD Billion)
12.3.2.10.3 UK Natural Fiber Composites Market Estimates And Forecasts, By Matrix Type (2020-2032) (USD Billion)
12.3.2.10.4 UK Natural Fiber Composites Market Estimates And Forecasts, By Technology (2020-2032) (USD Billion)
12.3.2.10.5 UK Natural Fiber Composites Market Estimates And Forecasts, By End-use Industry (2020-2032) (USD Billion)
12.3.2.11 Italy
12.3.2.11.1 Italy Natural Fiber Composites Market Estimates And Forecasts, By Raw Material (2020-2032) (USD Billion)
12.3.2.11.2 Italy Natural Fiber Composites Market Estimates And Forecasts, By Resin (2020-2032) (USD Billion)
12.3.2.11.3 Italy Natural Fiber Composites Market Estimates And Forecasts, By Matrix Type (2020-2032) (USD Billion)
12.3.2.11.4 Italy Natural Fiber Composites Market Estimates And Forecasts, By Technology (2020-2032) (USD Billion)
12.3.2.11.5 Italy Natural Fiber Composites Market Estimates And Forecasts, By End-use Industry (2020-2032) (USD Billion)
12.3.2.12 Spain
12.3.2.12.1 Spain Natural Fiber Composites Market Estimates And Forecasts, By Raw Material (2020-2032) (USD Billion)
12.3.2.12.2 Spain Natural Fiber Composites Market Estimates And Forecasts, By Resin (2020-2032) (USD Billion)
12.3.2.12.3 Spain Natural Fiber Composites Market Estimates And Forecasts, By Matrix Type (2020-2032) (USD Billion)
12.3.2.12.4 Spain Natural Fiber Composites Market Estimates And Forecasts, By Technology (2020-2032) (USD Billion)
12.3.2.12.5 Spain Natural Fiber Composites Market Estimates And Forecasts, By End-use Industry (2020-2032) (USD Billion)
12.3.2.13 Netherlands
12.3.2.13.1 Netherlands Natural Fiber Composites Market Estimates And Forecasts, By Raw Material (2020-2032) (USD Billion)
12.3.2.13.2 Netherlands Natural Fiber Composites Market Estimates And Forecasts, By Resin (2020-2032) (USD Billion)
12.3.2.13.3 Netherlands Natural Fiber Composites Market Estimates And Forecasts, By Matrix Type (2020-2032) (USD Billion)
12.3.2.13.4 Netherlands Natural Fiber Composites Market Estimates And Forecasts, By Technology (2020-2032) (USD Billion)
12.3.2.13.5 Netherlands Natural Fiber Composites Market Estimates And Forecasts, By End-use Industry (2020-2032) (USD Billion)
12.3.2.14 Switzerland
12.3.2.14.1 Switzerland Natural Fiber Composites Market Estimates And Forecasts, By Raw Material (2020-2032) (USD Billion)
12.3.2.14.2 Switzerland Natural Fiber Composites Market Estimates And Forecasts, By Resin (2020-2032) (USD Billion)
12.3.2.14.3 Switzerland Natural Fiber Composites Market Estimates And Forecasts, By Matrix Type (2020-2032) (USD Billion)
12.3.2.14.4 Switzerland Natural Fiber Composites Market Estimates And Forecasts, By Technology (2020-2032) (USD Billion)
12.3.2.12.5 Switzerland Natural Fiber Composites Market Estimates And Forecasts, By End-use Industry (2020-2032) (USD Billion)
12.3.2.15 Austria
12.3.2.15.1 Austria Natural Fiber Composites Market Estimates And Forecasts, By Raw Material (2020-2032) (USD Billion)
12.3.2.15.2 Austria Natural Fiber Composites Market Estimates And Forecasts, By Resin (2020-2032) (USD Billion)
12.3.2.15.3 Austria Natural Fiber Composites Market Estimates And Forecasts, By Matrix Type (2020-2032) (USD Billion)
12.3.2.15.4 Austria Natural Fiber Composites Market Estimates And Forecasts, By Technology (2020-2032) (USD Billion)
12.3.2.15.5 Austria Natural Fiber Composites Market Estimates And Forecasts, By End-use Industry (2020-2032) (USD Billion)
12.3.2.16 Rest Of Western Europe
12.3.2.16.1 Rest Of Western Europe Natural Fiber Composites Market Estimates And Forecasts, By Raw Material (2020-2032) (USD Billion)
12.3.2.16.2 Rest Of Western Europe Natural Fiber Composites Market Estimates And Forecasts, By Resin (2020-2032) (USD Billion)
12.3.2.16.3 Rest Of Western Europe Natural Fiber Composites Market Estimates And Forecasts, By Matrix Type (2020-2032) (USD Billion)
12.3.2.16.4 Rest Of Western Europe Natural Fiber Composites Market Estimates And Forecasts, By Technology (2020-2032) (USD Billion)
12.3.2.16.5 Rest Of Western Europe Natural Fiber Composites Market Estimates And Forecasts, By End-use Industry (2020-2032) (USD Billion)
12.4 Asia Pacific
12.4.1 Trends Analysis
12.4.2 Asia Pacific Natural Fiber Composites Market Estimates And Forecasts, By Country (2020-2032) (USD Billion)
12.4.3 Asia Pacific Natural Fiber Composites Market Estimates And Forecasts, By Raw Material (2020-2032) (USD Billion)
12.4.4 Asia Pacific Natural Fiber Composites Market Estimates And Forecasts, By Resin (2020-2032) (USD Billion)
12.4.5 Asia Pacific Natural Fiber Composites Market Estimates And Forecasts, By Matrix Type (2020-2032) (USD Billion)
12.4.6 Asia Pacific Natural Fiber Composites Market Estimates And Forecasts, By Technology (2020-2032) (USD Billion)
12.4.7 Asia Pacific Natural Fiber Composites Market Estimates And Forecasts, By End-use Industry (2020-2032) (USD Billion)
12.4.8 China
12.4.8.1 China Natural Fiber Composites Market Estimates And Forecasts, By Raw Material (2020-2032) (USD Billion)
12.4.8.2 China Natural Fiber Composites Market Estimates And Forecasts, By Resin (2020-2032) (USD Billion)
12.4.8.3 China Natural Fiber Composites Market Estimates And Forecasts, By Matrix Type (2020-2032) (USD Billion)
12.4.8.4 China Natural Fiber Composites Market Estimates And Forecasts, By Technology (2020-2032) (USD Billion)
12.4.8.5 China Natural Fiber Composites Market Estimates And Forecasts, By End-use Industry (2020-2032) (USD Billion)
12.4.9 India
12.4.9.1 India Natural Fiber Composites Market Estimates And Forecasts, By Raw Material (2020-2032) (USD Billion)
12.4.9.2 India Natural Fiber Composites Market Estimates And Forecasts, By Resin (2020-2032) (USD Billion)
12.4.9.3 India Natural Fiber Composites Market Estimates And Forecasts, By Matrix Type (2020-2032) (USD Billion)
12.4.9.4 India Natural Fiber Composites Market Estimates And Forecasts, By Technology (2020-2032) (USD Billion)
12.4.9.5 India Natural Fiber Composites Market Estimates And Forecasts, By End-use Industry (2020-2032) (USD Billion)
12.4.10 Japan
12.4.10.1 Japan Natural Fiber Composites Market Estimates And Forecasts, By Raw Material (2020-2032) (USD Billion)
12.4.10.2 Japan Natural Fiber Composites Market Estimates And Forecasts, By Resin (2020-2032) (USD Billion)
12.4.10.3 Japan Natural Fiber Composites Market Estimates And Forecasts, By Matrix Type (2020-2032) (USD Billion)
12.4.10.4 Japan Natural Fiber Composites Market Estimates And Forecasts, By Technology (2020-2032) (USD Billion)
12.4.10.5 Japan Natural Fiber Composites Market Estimates And Forecasts, By End-use Industry (2020-2032) (USD Billion)
12.4.11 South Korea
12.4.11.1 South Korea Natural Fiber Composites Market Estimates And Forecasts, By Raw Material (2020-2032) (USD Billion)
12.4.11.2 South Korea Natural Fiber Composites Market Estimates And Forecasts, By Resin (2020-2032) (USD Billion)
12.4.11.3 South Korea Natural Fiber Composites Market Estimates And Forecasts, By Matrix Type (2020-2032) (USD Billion)
12.4.11.4 South Korea Natural Fiber Composites Market Estimates And Forecasts, By Technology (2020-2032) (USD Billion)
12.4.11.5 South Korea Natural Fiber Composites Market Estimates And Forecasts, By End-use Industry (2020-2032) (USD Billion)
12.4.12 Vietnam
12.4.12.1 Vietnam Natural Fiber Composites Market Estimates And Forecasts, By Raw Material (2020-2032) (USD Billion)
12.4.12.2 Vietnam Natural Fiber Composites Market Estimates And Forecasts, By Resin (2020-2032) (USD Billion)
12.4.12.3 Vietnam Natural Fiber Composites Market Estimates And Forecasts, By Matrix Type (2020-2032) (USD Billion)
12.4.12.4 Vietnam Natural Fiber Composites Market Estimates And Forecasts, By Technology (2020-2032) (USD Billion)
12.4.12.5 Vietnam Natural Fiber Composites Market Estimates And Forecasts, By End-use Industry (2020-2032) (USD Billion)
12.4.13 Singapore
12.4.13.1 Singapore Natural Fiber Composites Market Estimates And Forecasts, By Raw Material (2020-2032) (USD Billion)
12.4.13.2 Singapore Natural Fiber Composites Market Estimates And Forecasts, By Resin (2020-2032) (USD Billion)
12.4.13.3 Singapore Natural Fiber Composites Market Estimates And Forecasts, By Matrix Type (2020-2032) (USD Billion)
12.4.13.4 Singapore Natural Fiber Composites Market Estimates And Forecasts, By Technology (2020-2032) (USD Billion)
12.4.13.5 Singapore Natural Fiber Composites Market Estimates And Forecasts, By End-use Industry (2020-2032) (USD Billion)
12.4.14 Australia
12.4.14.1 Australia Natural Fiber Composites Market Estimates And Forecasts, By Raw Material (2020-2032) (USD Billion)
12.4.14.2 Australia Natural Fiber Composites Market Estimates And Forecasts, By Resin (2020-2032) (USD Billion)
12.4.14.3 Australia Natural Fiber Composites Market Estimates And Forecasts, By Matrix Type (2020-2032) (USD Billion)
12.4.14.4 Australia Natural Fiber Composites Market Estimates And Forecasts, By Technology (2020-2032) (USD Billion)
12.4.14.5 Australia Natural Fiber Composites Market Estimates And Forecasts, By End-use Industry (2020-2032) (USD Billion)
12.4.15 Rest Of Asia Pacific
12.4.15.1 Rest Of Asia Pacific Natural Fiber Composites Market Estimates And Forecasts, By Raw Material (2020-2032) (USD Billion)
12.4.15.2 Rest Of Asia Pacific Natural Fiber Composites Market Estimates And Forecasts, By Resin (2020-2032) (USD Billion)
12.4.15.3 Rest Of Asia Pacific Natural Fiber Composites Market Estimates And Forecasts, By Matrix Type (2020-2032) (USD Billion)
12.4.15.4 Rest Of Asia Pacific Natural Fiber Composites Market Estimates And Forecasts, By Technology (2020-2032) (USD Billion)
12.4.15.5 Rest Of Asia Pacific Natural Fiber Composites Market Estimates And Forecasts, By End-use Industry (2020-2032) (USD Billion)
12.5 Middle East And Africa
12.5.1 Middle East
12.5.1.1 Trends Analysis
12.5.1.2 Middle East Natural Fiber Composites Market Estimates And Forecasts, By Country (2020-2032) (USD Billion)
12.5.1.3 Middle East Natural Fiber Composites Market Estimates And Forecasts, By Raw Material (2020-2032) (USD Billion)
12.5.1.4 Middle East Natural Fiber Composites Market Estimates And Forecasts, By Resin (2020-2032) (USD Billion)
12.5.1.5 Middle East Natural Fiber Composites Market Estimates And Forecasts, By Matrix Type (2020-2032) (USD Billion)
12.5.1.6 Middle East Natural Fiber Composites Market Estimates And Forecasts, By Technology (2020-2032) (USD Billion)
12.5.1.7 Middle East Natural Fiber Composites Market Estimates And Forecasts, By End-use Industry (2020-2032) (USD Billion)
12.5.1.8 UAE
12.5.1.8.1 UAE Natural Fiber Composites Market Estimates And Forecasts, By Raw Material (2020-2032) (USD Billion)
12.5.1.8.2 UAE Natural Fiber Composites Market Estimates And Forecasts, By Resin (2020-2032) (USD Billion)
12.5.1.8.3 UAE Natural Fiber Composites Market Estimates And Forecasts, By Matrix Type (2020-2032) (USD Billion)
12.5.1.8.4 UAE Natural Fiber Composites Market Estimates And Forecasts, By Technology (2020-2032) (USD Billion)
12.5.1.8.5 UAE Natural Fiber Composites Market Estimates And Forecasts, By End-use Industry (2020-2032) (USD Billion)
12.5.1.9 Egypt
12.5.1.9.1 Egypt Natural Fiber Composites Market Estimates And Forecasts, By Raw Material (2020-2032) (USD Billion)
12.5.1.9.2 Egypt Natural Fiber Composites Market Estimates And Forecasts, By Resin (2020-2032) (USD Billion)
12.5.1.9.3 Egypt Natural Fiber Composites Market Estimates And Forecasts, By Matrix Type (2020-2032) (USD Billion)
12.5.1.9.4 Egypt Natural Fiber Composites Market Estimates And Forecasts, By Technology (2020-2032) (USD Billion)
12.5.1.9.5 Egypt Natural Fiber Composites Market Estimates And Forecasts, By End-use Industry (2020-2032) (USD Billion)
12.5.1.10 Saudi Arabia
12.5.1.10.1 Saudi Arabia Natural Fiber Composites Market Estimates And Forecasts, By Raw Material (2020-2032) (USD Billion)
12.5.1.10.2 Saudi Arabia Natural Fiber Composites Market Estimates And Forecasts, By Resin (2020-2032) (USD Billion)
12.5.1.10.3 Saudi Arabia Natural Fiber Composites Market Estimates And Forecasts, By Matrix Type (2020-2032) (USD Billion)
12.5.1.10.4 Saudi Arabia Natural Fiber Composites Market Estimates And Forecasts, By Technology (2020-2032) (USD Billion)
12.5.1.10.5 Saudi Arabia Natural Fiber Composites Market Estimates And Forecasts, By End-use Industry (2020-2032) (USD Billion)
12.5.1.11 Qatar
12.5.1.11.1 Qatar Natural Fiber Composites Market Estimates And Forecasts, By Raw Material (2020-2032) (USD Billion)
12.5.1.11.2 Qatar Natural Fiber Composites Market Estimates And Forecasts, By Resin (2020-2032) (USD Billion)
12.5.1.11.3 Qatar Natural Fiber Composites Market Estimates And Forecasts, By Matrix Type (2020-2032) (USD Billion)
12.5.1.11.4 Qatar Natural Fiber Composites Market Estimates And Forecasts, By Technology (2020-2032) (USD Billion)
12.5.1.11.5 Qatar Natural Fiber Composites Market Estimates And Forecasts, By End-use Industry (2020-2032) (USD Billion)
12.5.1.12 Rest Of Middle East
12.5.1.12.1 Rest Of Middle East Natural Fiber Composites Market Estimates And Forecasts, By Raw Material (2020-2032) (USD Billion)
12.5.1.12.2 Rest Of Middle East Natural Fiber Composites Market Estimates And Forecasts, By Resin (2020-2032) (USD Billion)
12.5.1.12.3 Rest Of Middle East Natural Fiber Composites Market Estimates And Forecasts, By Matrix Type (2020-2032) (USD Billion)
12.5.1.12.4 Rest Of Middle East Natural Fiber Composites Market Estimates And Forecasts, By Technology (2020-2032) (USD Billion)
12.5.1.12.5 Rest Of Middle East Natural Fiber Composites Market Estimates And Forecasts, By End-use Industry (2020-2032) (USD Billion)
12.5.2 Africa
12.5.2.1 Trends Analysis
12.5.2.2 Africa Natural Fiber Composites Market Estimates And Forecasts, By Country (2020-2032) (USD Billion)
12.5.2.3 Africa Natural Fiber Composites Market Estimates And Forecasts, By Raw Material (2020-2032) (USD Billion)
12.5.2.4 Africa Natural Fiber Composites Market Estimates And Forecasts, By Resin (2020-2032) (USD Billion)
12.5.2.5 Africa Natural Fiber Composites Market Estimates And Forecasts, By Matrix Type (2020-2032) (USD Billion)
12.5.2.6 Africa Natural Fiber Composites Market Estimates And Forecasts, By Technology (2020-2032) (USD Billion)
12.5.2.7 Africa Natural Fiber Composites Market Estimates And Forecasts, By End-use Industry (2020-2032) (USD Billion)
12.5.2.8 South Africa
12.5.2.8.1 South Africa Natural Fiber Composites Market Estimates And Forecasts, By Raw Material (2020-2032) (USD Billion)
12.5.2.8.2 South Africa Natural Fiber Composites Market Estimates And Forecasts, By Resin (2020-2032) (USD Billion)
12.5.2.8.3 South Africa Natural Fiber Composites Market Estimates And Forecasts, By Matrix Type (2020-2032) (USD Billion)
12.5.2.8.4 South Africa Natural Fiber Composites Market Estimates And Forecasts, By Technology (2020-2032) (USD Billion)
12.5.2.8.5 South Africa Natural Fiber Composites Market Estimates And Forecasts, By End-use Industry (2020-2032) (USD Billion)
12.5.2.9 Nigeria
12.5.2.9.1 Nigeria Natural Fiber Composites Market Estimates And Forecasts, By Raw Material (2020-2032) (USD Billion)
12.5.2.9.2 Nigeria Natural Fiber Composites Market Estimates And Forecasts, By Resin (2020-2032) (USD Billion)
12.5.2.9.3 Nigeria Natural Fiber Composites Market Estimates And Forecasts, By Matrix Type (2020-2032) (USD Billion)
12.5.2.9.4 Nigeria Natural Fiber Composites Market Estimates And Forecasts, By Technology (2020-2032) (USD Billion)
12.5.2.9.5 Nigeria Natural Fiber Composites Market Estimates And Forecasts, By End-use Industry (2020-2032) (USD Billion)
12.5.2.10 Rest Of Africa
12.5.2.10.1 Rest Of Africa Natural Fiber Composites Market Estimates And Forecasts, By Raw Material (2020-2032) (USD Billion)
12.5.2.10.2 Rest Of Africa Natural Fiber Composites Market Estimates And Forecasts, By Resin (2020-2032) (USD Billion)
12.5.2.10.3 Rest Of Africa Natural Fiber Composites Market Estimates And Forecasts, By Matrix Type (2020-2032) (USD Billion)
12.5.2.10.4 Rest Of Africa Natural Fiber Composites Market Estimates And Forecasts, By Technology (2020-2032) (USD Billion)
12.5.2.10.5 Rest Of Africa Natural Fiber Composites Market Estimates And Forecasts, By End-use Industry (2020-2032) (USD Billion)
12.6 Latin America
12.6.1 Trends Analysis
12.6.2 Latin America Natural Fiber Composites Market Estimates And Forecasts, By Country (2020-2032) (USD Billion)
12.6.3 Latin America Natural Fiber Composites Market Estimates And Forecasts, By Raw Material (2020-2032) (USD Billion)
12.6.4 Latin America Natural Fiber Composites Market Estimates And Forecasts, By Resin (2020-2032) (USD Billion)
12.6.5 Latin America Natural Fiber Composites Market Estimates And Forecasts, By Matrix Type (2020-2032) (USD Billion)
12.6.6 Latin America Natural Fiber Composites Market Estimates And Forecasts, By Technology (2020-2032) (USD Billion)
12.6.7 Latin America Natural Fiber Composites Market Estimates And Forecasts, By End-use Industry (2020-2032) (USD Billion)
12.6.8 Brazil
12.6.8.1 Brazil Natural Fiber Composites Market Estimates And Forecasts, By Raw Material (2020-2032) (USD Billion)
12.6.8.2 Brazil Natural Fiber Composites Market Estimates And Forecasts, By Resin (2020-2032) (USD Billion)
12.6.8.3 Brazil Natural Fiber Composites Market Estimates And Forecasts, By Matrix Type (2020-2032) (USD Billion)
12.6.8.4 Brazil Natural Fiber Composites Market Estimates And Forecasts, By Technology (2020-2032) (USD Billion)
12.6.8.5 Brazil Natural Fiber Composites Market Estimates And Forecasts, By End-use Industry (2020-2032) (USD Billion)
12.6.9 Argentina
12.6.9.1 Argentina Natural Fiber Composites Market Estimates And Forecasts, By Raw Material (2020-2032) (USD Billion)
12.6.9.2 Argentina Natural Fiber Composites Market Estimates And Forecasts, By Resin (2020-2032) (USD Billion)
12.6.9.3 Argentina Natural Fiber Composites Market Estimates And Forecasts, By Matrix Type (2020-2032) (USD Billion)
12.6.9.4 Argentina Natural Fiber Composites Market Estimates And Forecasts, By Technology (2020-2032) (USD Billion)
12.6.9.5 Argentina Natural Fiber Composites Market Estimates And Forecasts, By End-use Industry (2020-2032) (USD Billion)
12.6.10 Colombia
12.6.10.1 Colombia Natural Fiber Composites Market Estimates And Forecasts, By Raw Material (2020-2032) (USD Billion)
12.6.10.2 Colombia Natural Fiber Composites Market Estimates And Forecasts, By Resin (2020-2032) (USD Billion)
12.6.10.3 Colombia Natural Fiber Composites Market Estimates And Forecasts, By Matrix Type (2020-2032) (USD Billion)
12.6.10.4 Colombia Natural Fiber Composites Market Estimates And Forecasts, By Technology (2020-2032) (USD Billion)
12.6.10.5 Colombia Natural Fiber Composites Market Estimates And Forecasts, By End-use Industry (2020-2032) (USD Billion)
12.6.11 Rest Of Latin America
12.6.11.1 Rest Of Latin America Natural Fiber Composites Market Estimates And Forecasts, By Raw Material (2020-2032) (USD Billion)
12.6.11.2 Rest Of Latin America Natural Fiber Composites Market Estimates And Forecasts, By Resin (2020-2032) (USD Billion)
12.6.11.3 Rest Of Latin America Natural Fiber Composites Market Estimates And Forecasts, By Matrix Type (2020-2032) (USD Billion)
12.6.11.4 Rest Of Latin America Natural Fiber Composites Market Estimates And Forecasts, By Technology (2020-2032) (USD Billion)
12.6.11.5 Rest Of Latin America Natural Fiber Composites Market Estimates And Forecasts, By End-use Industry (2020-2032) (USD Billion)
13. Company Profiles
13.1 Trex Company, Inc.
13.1.1 Company Overview
13.1.2 Financial
13.1.3 Products/ Services Offered
13.1.4 SWOT Analysis
13.2 Bcomp Ltd.
13.2.1 Company Overview
13.2.2 Financial
13.2.3 Products/ Services Offered
13.2.4 SWOT Analysis
13.3 TECNARO GMBH
13.3.1 Company Overview
13.3.2 Financial
13.3.3 Products/ Services Offered
13.3.4 SWOT Analysis
13.4 UPM
13.4.1 Company Overview
13.4.2 Financial
13.4.3 Products/ Services Offered
13.4.4 SWOT Analysis
13.5 DuPont
13.5.1 Company Overview
13.5.2 Financial
13.5.3 Products/ Services Offered
13.5.4 SWOT Analysis
13.6 Toray Industries, Inc.
13.6.1 Company Overview
13.6.2 Financial
13.6.3 Products/ Services Offered
13.6.4 SWOT Analysis
13.7 Solvay S.A.
13.7.1 Company Overview
13.7.2 Financial
13.7.3 Products/ Services Offered
13.7.4 SWOT Analysis
13.8 BASF SE
13.8.1 Company Overview
13.8.2 Financial
13.8.3 Products/ Services Offered
13.8.4 SWOT Analysis
13.9 Owens Corning
13.9.1 Company Overview
13.9.2 Financial
13.9.3 Products/ Services Offered
13.9.4 SWOT Analysis
13.10 Lanxess AG
13.10.1 Company Overview
13.10.2 Financial
13.10.3 Products/ Services Offered
13.10.4 SWOT Analysis
14. Use Cases and Best Practices
15. Conclusion
An accurate research report requires proper strategizing as well as implementation. There are multiple factors involved in the completion of good and accurate research report and selecting the best methodology to compete the research is the toughest part. Since the research reports we provide play a crucial role in any company’s decision-making process, therefore we at SNS Insider always believe that we should choose the best method which gives us results closer to reality. This allows us to reach at a stage wherein we can provide our clients best and accurate investment to output ratio.
Each report that we prepare takes a timeframe of 350-400 business hours for production. Starting from the selection of titles through a couple of in-depth brain storming session to the final QC process before uploading our titles on our website we dedicate around 350 working hours. The titles are selected based on their current market cap and the foreseen CAGR and growth.
The 5 steps process:
Step 1: Secondary Research:
Secondary Research or Desk Research is as the name suggests is a research process wherein, we collect data through the readily available information. In this process we use various paid and unpaid databases which our team has access to and gather data through the same. This includes examining of listed companies’ annual reports, Journals, SEC filling etc. Apart from this our team has access to various associations across the globe across different industries. Lastly, we have exchange relationships with various university as well as individual libraries.

Step 2: Primary Research
When we talk about primary research, it is a type of study in which the researchers collect relevant data samples directly, rather than relying on previously collected data. This type of research is focused on gaining content specific facts that can be sued to solve specific problems. Since the collected data is fresh and first hand therefore it makes the study more accurate and genuine.
We at SNS Insider have divided Primary Research into 2 parts.
Part 1 wherein we interview the KOLs of major players as well as the upcoming ones across various geographic regions. This allows us to have their view over the market scenario and acts as an important tool to come closer to the accurate market numbers. As many as 45 paid and unpaid primary interviews are taken from both the demand and supply side of the industry to make sure we land at an accurate judgement and analysis of the market.
This step involves the triangulation of data wherein our team analyses the interview transcripts, online survey responses and observation of on filed participants. The below mentioned chart should give a better understanding of the part 1 of the primary interview.

Part 2: In this part of primary research the data collected via secondary research and the part 1 of the primary research is validated with the interviews from individual consultants and subject matter experts.
Consultants are those set of people who have at least 12 years of experience and expertise within the industry whereas Subject Matter Experts are those with at least 15 years of experience behind their back within the same space. The data with the help of two main processes i.e., FGDs (Focused Group Discussions) and IDs (Individual Discussions). This gives us a 3rd party nonbiased primary view of the market scenario making it a more dependable one while collation of the data pointers.
Step 3: Data Bank Validation
Once all the information is collected via primary and secondary sources, we run that information for data validation. At our intelligence centre our research heads track a lot of information related to the market which includes the quarterly reports, the daily stock prices, and other relevant information. Our data bank server gets updated every fortnight and that is how the information which we collected using our primary and secondary information is revalidated in real time.

Step 4: QA/QC Process
After all the data collection and validation our team does a final level of quality check and quality assurance to get rid of any unwanted or undesired mistakes. This might include but not limited to getting rid of the any typos, duplication of numbers or missing of any important information. The people involved in this process include technical content writers, research heads and graphics people. Once this process is completed the title gets uploader on our platform for our clients to read it.
Step 5: Final QC/QA Process:
This is the last process and comes when the client has ordered the study. In this process a final QA/QC is done before the study is emailed to the client. Since we believe in giving our clients a good experience of our research studies, therefore, to make sure that we do not lack at our end in any way humanly possible we do a final round of quality check and then dispatch the study to the client.
Key Segments:
By Raw Material
Wood
Cotton
Flax
Kenaf
Hemp
Others
By Resin
Polypropylene (PP)
Polyethylene (PE)
Polyamide (PA)
Others
By Matrix Type
Inorganic Compound
Natural Polymer
Synthetic Polymer
By Technology
Injection Molding
Compression Molding
Pultrusion
Others
By End-use Industry
Automotive
Electronics
Sporting Goods
Construction
Others
Request for Segment Customization as per your Business Requirement: Segment Customization Request
Regional Coverage:
North America
US
Canada
Mexico
Europe
Eastern Europe
Poland
Romania
Hungary
Turkey
Rest of Eastern Europe
Western Europe
Germany
France
UK
Italy
Spain
Netherlands
Switzerland
Austria
Rest of Western Europe
Asia Pacific
China
India
Japan
South Korea
Vietnam
Singapore
Australia
Rest of Asia Pacific
Middle East & Africa
Middle East
UAE
Egypt
Saudi Arabia
Qatar
Rest of Middle East
Africa
Nigeria
South Africa
Rest of Africa
Latin America
Brazil
Argentina
Colombia
Rest of Latin America
Request for Country Level Research Report: Country Level Customization Request
Available Customization
With the given market data, SNS Insider offers customization as per the company’s specific needs. The following customization options are available for the report:
Detailed Volume Analysis
Criss-Cross segment analysis (e.g. Product X Application)
Competitive Product Benchmarking
Geographic Analysis
Additional countries in any of the regions
Customized Data Representation
Detailed analysis and profiling of additional market players
The Latex Binders Market size was USD 7.6 billion in 2023 and is expected to reach USD 13.3 billion by 2032 and grow at a CAGR of 6.5% over the forecast period of 2024-2032.
The Piperidine Market size was USD 68.30 million in 2023 and is expected to reach USD 114.30 million by 2032 and grow at a CAGR of 5.89% over the forecast period of 2024-2032.
Vapor Deposition Market was valued at USD 30.92 Billion in 2023 and is expected to reach USD 61.03 Billion by 2032, growing at a CAGR of 7.85% from 2024-2032.
The Nematicides Market was valued at USD 1.90 Billion in 2023 and is expected to reach USD 2.77 Billion by 2032, growing at a CAGR of 4.27% from 2024-2032.
The Hydrophilic Coating Market Size was valued at USD 16.59 Billion in 2023 and is expected to reach USD 27.23 Billion by 2032, growing at a CAGR of 5.66% over the forecast period of 2024-2032.
The Waterproofing Membrane Market size was valued at USD 40.0 Billion in 2023 and is expected to reach USD 67.9 Billion by 2032, growing at a CAGR of 6.1% over the forecast period 2024-2032.

Hi! Click one of our member below to chat on Phone
© 2025 All Rights Reserved by SNS Insider Pvt Ltd


