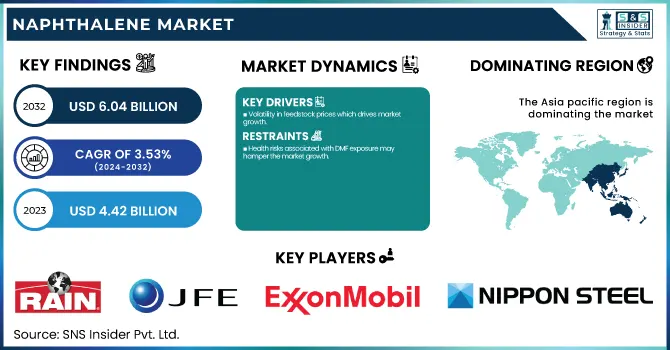
The Naphthalene Market size was USD 4.42 Billion in 2023 and is expected to reach USD 6.04 Billion by 2032 and grow at a CAGR of 3.53 % over the forecast period of 2024-2032. The report provides a comprehensive analysis of production capacity and utilization by country and type, highlighting key manufacturing hubs and efficiency levels. It examines feedstock price trends, regulatory impacts, and environmental metrics, including emissions data and sustainability initiatives. The report also explores innovation and R&D trends in naphthalene-based applications, such as superplasticizers and phthalic anhydride. Additionally, it covers market adoption across industries like construction, textiles, and agrochemicals, offering insights into emerging opportunities and challenges.
To Get more information on Naphthalene Market - Request Free Sample Report
Drivers
Volatility in feedstock prices which drives market growth.
It is extensively used in agrochemicals such as pesticides, insecticides, and fungicides supporting the naphthalene market growth. As the need for food production increases across the globe, farmers are now turning to agrochemicals to increase crop output and prevent them from contracting diseases and pests. Growing agricultural sectors in countries including India, China, and Brazil are seeing increased consumption of naphthalene-based agrochemicals, driven by state support for modern farming methods. Moreover, improvements in pesticide formulations, such as controlled-release and bio-based alternatives are also facilitating further uptake in agricultural applications for naphthalene derivatives.
Restraint
Health risks associated with DMF exposure may hamper the market growth.
One of the most prominent factors affecting the growth of the naphthalene market is the volatility of feedstock prices which have a significant effect on the production economics and market pricing, owing to the fact that coal tar and crude oil are the raw materials for the production of naphthalene. Because they are mostly obtained from coal tar or petroleum-based sources, the pricing of naphthalene lassos is highly volatile owing to supply chain interruptions, geopolitical tensions, and variations in crude oil prices. Rising feedstock costs present a challenge for manufacturers but also motivate innovations in production processes and research towards more cost-efficient refining technologies. Also, price fluctuations regularly result in changes in regional production and trade flows as companies look for a cheaper alternative or invest in higher-value naphthalene derivatives to keep profits intact.
Opportunity
Advancements in high-purity naphthalene for specialty chemicals create an opportunity in the market.
Advancements in high-purity naphthalene are creating significant opportunities in the specialty chemicals market, as industries increasingly require refined raw materials for high-performance applications. Phthalic anhydride, a key intermediate in the manufacture of plasticizers, resins, and dyes, needs high-purity naphthalene as a starting material. It is also critical for high-performance coatings, adhesives, and engineering polymers that need high quality and consistency. The continuous development of purification methods enables manufacturers to offer high-purity grades of naphthalene, which are more customized for use in pharmaceuticals, electronics, and fine chemicals. The increasing usage of high-performance materials in automotive, aerospace, and medical industries fuelling the demand for high-purity naphthalene is a wide lucrative segment of the market.
Challenges
Technological barriers in purification and refining may create a challenge for the market.
Technological barriers can be a major challenge to the naphthalene market especially in industries that require high-purity grades for application in pharmaceuticals, specialty chemicals, and high-performance polymers. Common purification techniques are distillation and crystallization; however, they tend to be ineffective at achieving the ultra-high purities required for higher-end applications. Impurities like sulfur compounds and other polycyclic aromatic hydrocarbons (PAHs) are present in the product, affecting product quality and its use in stringent industries. Furthermore, implementing new refining technologies requires very high capital investments against which small and mid-sized manufacturers cannot compete. Stringent quality standards imposed by regulatory authorities require firms to develop advanced purification technologies, leading to higher operating costs and increasing entry barriers for new players entering this market.
By Source
The coal tar segment held the largest market share around 68% in 2023. It is owing to its high availability from coke production, a byproduct of steel production. Naphthalene derived from coal tar is cheaper than petroleum-based naphthalene and is thus the raw material of choice for construction, textiles, plastics, agrochemicals, and more. Also, substantial worldwide production of naphthalene from coal tar is concentrated in the Asia-Pacific area where the primary production is found in nations like China, India, and Japan, taking advantage of enormous-scale steel generation. That favorable supply situation is exacerbated by a greater yield of naphthalene from coal tar than from petroleum derivatives, which solidifies its position as a market leader. However, even with increasing environmental awareness, the development of purification techniques and emission control measures have facilitated the continued dominance of coal tar-derived naphthalene in the industry.
By Application
Phthalic anhydride manufacturing held the largest market share around 32% in 2023. This is due to its high application rate for the production of plasticizers, unsaturated polyester resins (UPRs), and alkyd resins. One of its intermediates, phthalic anhydride is necessary in the production of flexible polyvinyl chloride, coatings, paints, and adhesives utilized in the construction, automotive, and packaging industries. The surging expansion of infrastructure construction in major economies and industrialization, especially in Asia-Pacific, has largely propelled the consumption of phthalic anhydride products. Also, it uses high-purity naphthalene-derived phthalic anhydride, which is chosen for performance applications requiring higher performance and a greater service life. Despite alternatives and regulatory challenges, phthalic anhydride continues to retain market dominance, backed up by increasing investments in plastics, resins, and polymer industries.
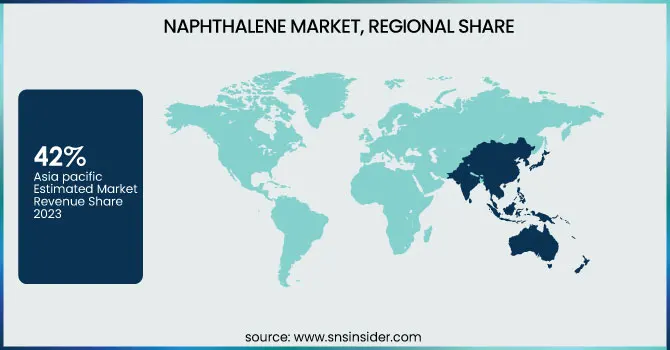
Asia pacific held the largest market share around 42% in 2023. It is owing to the presence of a strong industrial base, rapid urbanization, and high demand from construction, textiles, plastics, and agrochemicals. China, India, and Japan are some of the largest producers of naphthalene from coal tar, supported by the continuous availability of coal tar due to large-scale steel production in the region. Moreover, rapid growth in construction and infrastructure sectors in the region, particularly, China and India will continue to propel the demand for naphthalene-based superplasticizers in concrete admixtures. The growing use of naphthalene in textile, dye, agrochemicals, and resin production contributes to maintaining a leading position in the region. Asia-Pacific is dominating the global naphthalene market and the reasons attributing this are low production costs, easy availability of raw materials, and enrichment in domestic consumption.
North America held a significant market share in 2023. It is owing to the long-standing construction, automotive, and specialty chemicals industries in the region. This is primarily driven by rising demand for naphthalene-based superplasticizers for concrete admixtures which is supported by ongoing infrastructure refurbishment projects in the region both in U.S. and Canada. In addition, the presence of phthalic anhydride manufacturers in the region further contributes to the naphthalene consumption for the production of plasticizers, resins, and coatings. Additionally, the increase in the demand for specialty applications like pharmaceuticals and advanced polymers can also support the growth of the high-purity naphthalene market. Despite being partially displaced by some sustainable products due to environmental regulations, refining and purification technologies continue to evolve, allowing North America to cement its position within the international naphthalene market.
Get Customized Report as per Your Business Requirement - Enquiry Now
Key Players
Rain Carbon Inc. (Calcined Petroleum Coke, Coal Tar Pitch)
JFE Chemical Corporation (Naphthalene, Phthalic Anhydride)
ExxonMobil Corporation (Crude Oil, Petrochemicals)
CARBOTECH (Activated Carbon, Carbon Solutions)
Epsilon Carbon Private Limited (Hard Carbon Black, Coal Tar Pitch)
Koppers Inc. (Carbon Materials, Wood Treatment Chemicals)
Rütgers Group (Aromatic Chemicals, Resins)
Nippon Steel Chemical Co., Ltd. (Naphthalene, Benzene)
Baoshan Iron & Steel Co., Ltd. (Steel Products, Naphthalene)
Haldia Petrochemicals Limited (Polymers, Chemicals)
Daejung Chemicals & Metals Co., Ltd. (Naphthalene, Chemical Reagents)
Himadri Speciality Chemical Ltd. (Advanced Carbon Materials, Naphthalene)
Formosa Petrochemical Corporation (Petrochemical Products, Naphtha)
WUXI HENGLI PETROCHEMICALS CO., LTD. (Petrochemical Products, Naphthalene)
JFE Shoji Trade Corporation (Chemicals, Naphthalene)
Shandong Sanwei Trade Co., Ltd. (Chemical Products, Naphthalene)
RÜTGERS Belgium NV (Chemical Intermediates, Naphthalene)
Aum Chemicals (Naphthalene Balls, Industrial Chemicals)
Sinobioway Group Co., Ltd. (Biochemicals, Naphthalene)
Mangalore Chemicals & Fertilizers Limited (Sulphonated Naphthalene Formaldehyde, Urea)
Recent Development:
In October 2023, BASF collaborated with a prominent construction materials company to innovate next-generation asphalt sealants incorporating recycled naphthalene derivatives. This initiative supports circular economy principles by integrating recycled materials into infrastructure applications.
In November 2022, Sulzer Chemtech revealed its partnership with Dong-Suh Company in Indonesia to supply process engineering expertise and essential equipment. This collaboration focuses on establishing a cutting-edge separation unit at Dong-Suh's Serang facility, enhancing the production of high-purity naphthalene.
| Report Attributes | Details |
|---|---|
| Market Size in 2023 | USD 4.42 Billion |
| Market Size by 2032 | USD 6.04 Billion |
| CAGR | CAGR of 3.53% From 2024 to 2032 |
| Base Year | 2023 |
| Forecast Period | 2024-2032 |
| Historical Data | 2020-2022 |
| Report Scope & Coverage | Market Size, Segments Analysis, Competitive Landscape, Regional Analysis, DROC & SWOT Analysis, Forecast Outlook |
| Key Segments | •By Source (Coal Tar, Petroleum) •By Application (Phthalic Anhydride, Naphthalene Sulfonates, Low-Volatility Solvents, Moth Repellent, Pesticides, Others) |
| Regional Analysis/Coverage | North America (US, Canada, Mexico), Europe (Eastern Europe [Poland, Romania, Hungary, Turkey, Rest of Eastern Europe] Western Europe] Germany, France, UK, Italy, Spain, Netherlands, Switzerland, Austria, Rest of Western Europe]), Asia Pacific (China, India, Japan, South Korea, Vietnam, Singapore, Australia, Rest of Asia Pacific), Middle East & Africa (Middle East [UAE, Egypt, Saudi Arabia, Qatar, Rest of Middle East], Africa [Nigeria, South Africa, Rest of Africa], Latin America (Brazil, Argentina, Colombia, Rest of Latin America) |
| Company Profiles | Rain Carbon Inc., JFE Chemical Corporation, ExxonMobil Corporation, CARBOTECH, Epsilon Carbon Private Limited, Koppers Inc., Rütgers Group, Nippon Steel Chemical Co., Ltd., Baoshan Iron & Steel Co., Ltd., Haldia Petrochemicals Limited, Daejung Chemicals & Metals Co., Ltd., Himadri Speciality Chemical Ltd., Formosa Petrochemical Corporation, WUXI HENGLI PETROCHEMICALS CO., LTD., JFE Shoji Trade Corporation, Shandong Sanwei Trade Co., Ltd., RÜTGERS Belgium NV, Aum Chemicals, Sinobioway Group Co., Ltd., Mangalore Chemicals & Fertilizers Limited. |
Ans: The Naphthalene Market was valued at USD 4.42 Billion in 2023.
Ans: The expected CAGR of the global Naphthalene Market during the forecast period is 3.53%
Ans: The coal tar will grow rapidly in the Naphthalene Market from 2024-2032.
Ans: Volatility in feedstock prices which drives market growth.
Ans: Asia Pacific led the Naphthalene Market in the region with the highest revenue share in 2023.
Table of Contents:
1. Introduction
1.1 Market Definition
1.2 Scope (Inclusion and Exclusions)
1.3 Research Assumptions
2. Executive Summary
2.1 Market Overview
2.2 Regional Synopsis
2.3 Competitive Summary
3. Research Methodology
3.1 Top-Down Approach
3.2 Bottom-up Approach
3.3. Data Validation
3.4 Primary Interviews
4. Market Dynamics Impact Analysis
4.1 Market Driving Factors Analysis
4.1.2 Drivers
4.1.2 Restraints
4.1.3 Opportunities
4.1.4 Challenges
4.2 PESTLE Analysis
4.3 Porter’s Five Forces Model
5. Statistical Insights and Trends Reporting
5.1 Production Capacity and Utilization, by Country, By Type, 2023
5.2 Feedstock Prices, by Country, By Type, 2023
5.3 Regulatory Impact, by Country, By Type 2023.
5.4 Environmental Metrics: Emissions Data, Waste Management Practices, and Sustainability Initiatives, by Region
5.5 Innovation and R&D, Type, 2023
6. Competitive Landscape
6.1 List of Major Companies, By Region
6.2 Market Share Analysis, By Region
6.3 Product Benchmarking
6.3.1 Product specifications and features
6.3.2 Pricing
6.4 Strategic Initiatives
6.4.1 Marketing and promotional activities
6.4.2 Distribution and Supply Chain Strategies
6.4.3 Expansion Plans and New Product Launches
6.4.4 Strategic partnerships and collaborations
6.5 Technological Advancements
6.6 Market Positioning and Branding
7. Naphthalene Market Segmentation, By Source
7.1 Chapter Overview
7.2 Coal Tar
7.2.1 Coal Tar Trends Analysis (2020-2032)
7.2.2 Coal Tar Market Size Estimates and Forecasts to 2032 (USD Billion)
7.3 Petroleum
7.3.1 Petroleum Market Trends Analysis (2020-2032)
7.3.2 Petroleum Market Size Estimates and Forecasts to 2032 (USD Billion)
8. Naphthalene Market Segmentation, by Application
8.1 Chapter Overview
8.2 Phthalic Anhydride
8.2.1 Phthalic Anhydride Market Trends Analysis (2020-2032)
8.2.2 Phthalic Anhydride Market Size Estimates and Forecasts to 2032 (USD Billion)
8.3 Naphthalene Sulfonates
8.3.1 Naphthalene Sulfonates Market Trends Analysis (2020-2032)
8.3.2 Naphthalene Sulfonates Market Size Estimates and Forecasts to 2032 (USD Billion)
8.4 Low-Volatility Solvents
8.4.1 Low-Volatility Solvents Market Trends Analysis (2020-2032)
8.4.2 Low-Volatility Solvents Market Size Estimates and Forecasts to 2032 (USD Billion)
8.5 Moth Repellent
8.5.1 Moth Repellent Market Trends Analysis (2020-2032)
8.5.2 Moth Repellent Market Size Estimates and Forecasts to 2032 (USD Billion)
8.6 Pesticides
8.6.1 Pesticides Market Trends Analysis (2020-2032)
8.6.2 Pesticides Market Size Estimates and Forecasts to 2032 (USD Billion)
8.7 Others
8.7.1 Others Market Trends Analysis (2020-2032)
8.7.2 Others Market Size Estimates and Forecasts to 2032 (USD Billion)
9. Regional Analysis
9.1 Chapter Overview
9.2 North America
9.2.1 Trends Analysis
9.2.2 North America Naphthalene Market Estimates and Forecasts, by Country (2020-2032) (USD Billion)
9.2.3 North America Naphthalene Market Estimates and Forecasts, By Source (2020-2032) (USD Billion)
9.2.4 North America Naphthalene Market Estimates and Forecasts, by Application (2020-2032) (USD Billion)
9.2.5 USA
9.2.5.1 USA Naphthalene Market Estimates and Forecasts, By Source (2020-2032) (USD Billion)
9.2.5.2 USA Naphthalene Market Estimates and Forecasts, by Application (2020-2032) (USD Billion)
9.2.6 Canada
9.2.6.1 Canada Naphthalene Market Estimates and Forecasts, By Source (2020-2032) (USD Billion)
9.2.6.2 Canada Naphthalene Market Estimates and Forecasts, by Application (2020-2032) (USD Billion)
9.2.7 Mexico
9.2.7.1 Mexico Naphthalene Market Estimates and Forecasts, By Source (2020-2032) (USD Billion)
9.2.7.2 Mexico Naphthalene Market Estimates and Forecasts, by Application (2020-2032) (USD Billion)
9.3 Europe
9.3.1 Eastern Europe
9.3.1.1 Trends Analysis
9.3.1.2 Eastern Europe Naphthalene Market Estimates and Forecasts, by Country (2020-2032) (USD Billion)
9.3.1.3 Eastern Europe Naphthalene Market Estimates and Forecasts, By Source (2020-2032) (USD Billion)
9.3.1.4 Eastern Europe Naphthalene Market Estimates and Forecasts, by Application (2020-2032) (USD Billion)
9.3.1.5 Poland
9.3.1.5.1 Poland Naphthalene Market Estimates and Forecasts, By Source (2020-2032) (USD Billion)
9.3.1.5.2 Poland Naphthalene Market Estimates and Forecasts, by Application (2020-2032) (USD Billion)
9.3.1.6 Romania
9.3.1.6.1 Romania Naphthalene Market Estimates and Forecasts, By Source (2020-2032) (USD Billion)
9.3.1.6.2 Romania Naphthalene Market Estimates and Forecasts, by Application (2020-2032) (USD Billion)
9.3.1.7 Hungary
9.3.1.7.1 Hungary Naphthalene Market Estimates and Forecasts, By Source (2020-2032) (USD Billion)
9.3.1.7.2 Hungary Naphthalene Market Estimates and Forecasts, by Application (2020-2032) (USD Billion)
9.3.1.8 Turkey
9.3.1.8.1 Turkey Naphthalene Market Estimates and Forecasts, By Source (2020-2032) (USD Billion)
9.3.1.8.2 Turkey Naphthalene Market Estimates and Forecasts, by Application (2020-2032) (USD Billion)
9.3.1.9 Rest of Eastern Europe
9.3.1.9.1 Rest of Eastern Europe Naphthalene Market Estimates and Forecasts, By Source (2020-2032) (USD Billion)
9.3.1.9.2 Rest of Eastern Europe Naphthalene Market Estimates and Forecasts, by Application (2020-2032) (USD Billion)
9.3.2 Western Europe
9.3.2.1 Trends Analysis
9.3.2.2 Western Europe Naphthalene Market Estimates and Forecasts, by Country (2020-2032) (USD Billion)
9.3.2.3 Western Europe Naphthalene Market Estimates and Forecasts, By Source (2020-2032) (USD Billion)
9.3.2.4 Western Europe Naphthalene Market Estimates and Forecasts, by Application (2020-2032) (USD Billion)
9.3.2.5 Germany
9.3.2.5.1 Germany Naphthalene Market Estimates and Forecasts, By Source (2020-2032) (USD Billion)
9.3.2.5.2 Germany Naphthalene Market Estimates and Forecasts, by Application (2020-2032) (USD Billion)
9.3.2.6 France
9.3.2.6.1 France Naphthalene Market Estimates and Forecasts, By Source (2020-2032) (USD Billion)
9.3.2.6.2 France Naphthalene Market Estimates and Forecasts, by Application (2020-2032) (USD Billion)
9.3.2.7 UK
9.3.2.7.1 UK Naphthalene Market Estimates and Forecasts, By Source (2020-2032) (USD Billion)
9.3.2.7.2 UK Naphthalene Market Estimates and Forecasts, by Application (2020-2032) (USD Billion)
9.3.2.8 Italy
9.3.2.8.1 Italy Naphthalene Market Estimates and Forecasts, By Source (2020-2032) (USD Billion)
9.3.2.8.2 Italy Naphthalene Market Estimates and Forecasts, by Application (2020-2032) (USD Billion)
9.3.2.9 Spain
9.3.2.9.1 Spain Naphthalene Market Estimates and Forecasts, By Source (2020-2032) (USD Billion)
9.3.2.9.2 Spain Naphthalene Market Estimates and Forecasts, by Application (2020-2032) (USD Billion)
9.3.2.10 Netherlands
9.3.2.10.1 Netherlands Naphthalene Market Estimates and Forecasts, By Source (2020-2032) (USD Billion)
9.3.2.10.2 Netherlands Naphthalene Market Estimates and Forecasts, by Application (2020-2032) (USD Billion)
9.3.2.11 Switzerland
9.3.2.11.1 Switzerland Naphthalene Market Estimates and Forecasts, By Source (2020-2032) (USD Billion)
9.3.2.11.2 Switzerland Naphthalene Market Estimates and Forecasts, by Application (2020-2032) (USD Billion)
9.3.2.12 Austria
9.3.2.12.1 Austria Naphthalene Market Estimates and Forecasts, By Source (2020-2032) (USD Billion)
9.3.2.12.2 Austria Naphthalene Market Estimates and Forecasts, by Application (2020-2032) (USD Billion)
9.3.2.13 Rest of Western Europe
9.3.2.13.1 Rest of Western Europe Naphthalene Market Estimates and Forecasts, By Source (2020-2032) (USD Billion)
9.3.2.13.2 Rest of Western Europe Naphthalene Market Estimates and Forecasts, by Application (2020-2032) (USD Billion)
9.4 Asia Pacific
9.4.1 Trends Analysis
9.4.2 Asia Pacific Naphthalene Market Estimates and Forecasts, by Country (2020-2032) (USD Billion)
9.4.3 Asia Pacific Naphthalene Market Estimates and Forecasts, By Source (2020-2032) (USD Billion)
9.4.4 Asia Pacific Naphthalene Market Estimates and Forecasts, by Application (2020-2032) (USD Billion)
9.4.5 China
9.4.5.1 China Naphthalene Market Estimates and Forecasts, By Source (2020-2032) (USD Billion)
9.4.5.2 China Naphthalene Market Estimates and Forecasts, by Application (2020-2032) (USD Billion)
9.4.6 India
9.4.5.1 India Naphthalene Market Estimates and Forecasts, By Source (2020-2032) (USD Billion)
9.4.5.2 India Naphthalene Market Estimates and Forecasts, by Application (2020-2032) (USD Billion)
9.4.5 Japan
9.4.5.1 Japan Naphthalene Market Estimates and Forecasts, By Source (2020-2032) (USD Billion)
9.4.5.2 Japan Naphthalene Market Estimates and Forecasts, by Application (2020-2032) (USD Billion)
9.4.6 South Korea
9.4.6.1 South Korea Naphthalene Market Estimates and Forecasts, By Source (2020-2032) (USD Billion)
9.4.6.2 South Korea Naphthalene Market Estimates and Forecasts, by Application (2020-2032) (USD Billion)
9.4.7 Vietnam
9.4.7.1 Vietnam Naphthalene Market Estimates and Forecasts, By Source (2020-2032) (USD Billion)
9.2.7.2 Vietnam Naphthalene Market Estimates and Forecasts, by Application (2020-2032) (USD Billion)
9.4.8 Singapore
9.4.8.1 Singapore Naphthalene Market Estimates and Forecasts, By Source (2020-2032) (USD Billion)
9.4.8.2 Singapore Naphthalene Market Estimates and Forecasts, by Application (2020-2032) (USD Billion)
9.4.9 Australia
9.4.9.1 Australia Naphthalene Market Estimates and Forecasts, By Source (2020-2032) (USD Billion)
9.4.9.2 Australia Naphthalene Market Estimates and Forecasts, by Application (2020-2032) (USD Billion)
9.4.10 Rest of Asia Pacific
9.4.10.1 Rest of Asia Pacific Naphthalene Market Estimates and Forecasts, By Source (2020-2032) (USD Billion)
9.4.10.2 Rest of Asia Pacific Naphthalene Market Estimates and Forecasts, by Application (2020-2032) (USD Billion)
9.5 Middle East and Africa
9.5.1 Middle East
9.5.1.1 Trends Analysis
9.5.1.2 Middle East Naphthalene Market Estimates and Forecasts, by Country (2020-2032) (USD Billion)
9.5.1.3 Middle East Naphthalene Market Estimates and Forecasts, By Source (2020-2032) (USD Billion)
9.5.1.4 Middle East Naphthalene Market Estimates and Forecasts, by Application (2020-2032) (USD Billion)
9.5.1.5 UAE
9.5.1.5.1 UAE Naphthalene Market Estimates and Forecasts, By Source (2020-2032) (USD Billion)
9.5.1.5.2 UAE Naphthalene Market Estimates and Forecasts, by Application (2020-2032) (USD Billion)
9.5.1.6 Egypt
9.5.1.6.1 Egypt Naphthalene Market Estimates and Forecasts, By Source (2020-2032) (USD Billion)
9.5.1.6.2 Egypt Naphthalene Market Estimates and Forecasts, by Application (2020-2032) (USD Billion)
9.5.1.7 Saudi Arabia
9.5.1.7.1 Saudi Arabia Naphthalene Market Estimates and Forecasts, By Source (2020-2032) (USD Billion)
9.5.1.7.2 Saudi Arabia Naphthalene Market Estimates and Forecasts, by Application (2020-2032) (USD Billion)
9.5.1.8 Qatar
9.5.1.8.1 Qatar Naphthalene Market Estimates and Forecasts, By Source (2020-2032) (USD Billion)
9.5.1.8.2 Qatar Naphthalene Market Estimates and Forecasts, by Application (2020-2032) (USD Billion)
9.5.1.9 Rest of Middle East
9.5.1.9.1 Rest of Middle East Naphthalene Market Estimates and Forecasts, By Source (2020-2032) (USD Billion)
9.5.1.9.2 Rest of Middle East Naphthalene Market Estimates and Forecasts, by Application (2020-2032) (USD Billion)
9.5.2 Africa
9.5.2.1 Trends Analysis
9.5.2.2 Africa Naphthalene Market Estimates and Forecasts, by Country (2020-2032) (USD Billion)
9.5.2.3 Africa Naphthalene Market Estimates and Forecasts, By Source (2020-2032) (USD Billion)
9.5.2.4 Africa Naphthalene Market Estimates and Forecasts, by Application (2020-2032) (USD Billion)
9.5.2.5 South Africa
9.5.2.5.1 South Africa Naphthalene Market Estimates and Forecasts, By Source (2020-2032) (USD Billion)
9.5.2.5.2 South Africa Naphthalene Market Estimates and Forecasts, by Application (2020-2032) (USD Billion)
9.5.2.6 Nigeria
9.5.2.6.1 Nigeria Naphthalene Market Estimates and Forecasts, By Source (2020-2032) (USD Billion)
9.5.2.6.2 Nigeria Naphthalene Market Estimates and Forecasts, by Application (2020-2032) (USD Billion)
9.6 Latin America
9.6.1 Trends Analysis
9.6.2 Latin America Naphthalene Market Estimates and Forecasts, by Country (2020-2032) (USD Billion)
9.6.3 Latin America Naphthalene Market Estimates and Forecasts, By Source (2020-2032) (USD Billion)
9.6.4 Latin America Naphthalene Market Estimates and Forecasts, by Application (2020-2032) (USD Billion)
9.6.5 Brazil
9.6.5.1 Brazil Naphthalene Market Estimates and Forecasts, By Source (2020-2032) (USD Billion)
9.6.5.2 Brazil Naphthalene Market Estimates and Forecasts, by Application (2020-2032) (USD Billion)
9.6.6 Argentina
9.6.6.1 Argentina Naphthalene Market Estimates and Forecasts, By Source (2020-2032) (USD Billion)
9.6.6.2 Argentina Naphthalene Market Estimates and Forecasts, by Application (2020-2032) (USD Billion)
9.6.7 Colombia
9.6.7.1 Colombia Naphthalene Market Estimates and Forecasts, By Source (2020-2032) (USD Billion)
9.6.7.2 Colombia Naphthalene Market Estimates and Forecasts, by Application (2020-2032) (USD Billion)
9.6.8 Rest of Latin America
9.6.8.1 Rest of Latin America Naphthalene Market Estimates and Forecasts, By Source (2020-2032) (USD Billion)
9.6.8.2 Rest of Latin America Naphthalene Market Estimates and Forecasts, by Application (2020-2032) (USD Billion)
10. Company Profiles
10.1 Rain Carbon Inc.
10.1.1 Company Overview
10.1.2 Financial
10.1.3 Product / Services Offered
10.1.4 SWOT Analysis
10.2 JFE Chemical Corporation
10.2.1 Company Overview
10.2.2 Financial
10.2.3 Product/ Services Offered
10.2.4 SWOT Analysis
10.3 ExxonMobil Corporation
10.3.1 Company Overview
10.3.2 Financial
10.3.3 Product/ Services Offered
10.3.4 SWOT Analysis
10.4 Epsilon Carbon Private Limited
10.4.1 Company Overview
10.4.2 Financial
10.4.3 Product/ Services Offered
10.4.4 SWOT Analysis
10.5 Koppers Inc.
10.5.1 Company Overview
10.5.2 Financial
10.5.3 Product/ Services Offered
10.5.4 SWOT Analysis
10.6 Nippon Steel Chemical Co., Ltd.
10.6.1 Company Overview
10.6.2 Financial
10.6.3 Product/ Services Offered
10.6.4 SWOT Analysis
10.7 Baoshan Iron & Steel Co., Ltd.
10.7.1 Company Overview
10.7.2 Financial
10.7.3 Product/ Services Offered
10.7.4 SWOT Analysis
10.8 Aum Chemicals
10.8.1 Company Overview
10.8.2 Financial
10.8.3 Product/ Services Offered
10.8.4 SWOT Analysis
10.9 JFE Shoji Trade Corporation
10.9.1 Company Overview
10.9.2 Financial
10.9.3 Product/ Services Offered
10.9.4 SWOT Analysis
10.10 Mangalore Chemicals & Fertilizers Limited
10.10.1 Company Overview
10.10.2 Financial
10.10.3 Product/ Services Offered
10.10.4 SWOT Analysis
11. Use Cases and Best Practices
12. Conclusion
An accurate research report requires proper strategizing as well as implementation. There are multiple factors involved in the completion of good and accurate research report and selecting the best methodology to compete the research is the toughest part. Since the research reports we provide play a crucial role in any company’s decision-making process, therefore we at SNS Insider always believe that we should choose the best method which gives us results closer to reality. This allows us to reach at a stage wherein we can provide our clients best and accurate investment to output ratio.
Each report that we prepare takes a timeframe of 350-400 business hours for production. Starting from the selection of titles through a couple of in-depth brain storming session to the final QC process before uploading our titles on our website we dedicate around 350 working hours. The titles are selected based on their current market cap and the foreseen CAGR and growth.
The 5 steps process:
Step 1: Secondary Research:
Secondary Research or Desk Research is as the name suggests is a research process wherein, we collect data through the readily available information. In this process we use various paid and unpaid databases which our team has access to and gather data through the same. This includes examining of listed companies’ annual reports, Journals, SEC filling etc. Apart from this our team has access to various associations across the globe across different industries. Lastly, we have exchange relationships with various university as well as individual libraries.

Step 2: Primary Research
When we talk about primary research, it is a type of study in which the researchers collect relevant data samples directly, rather than relying on previously collected data. This type of research is focused on gaining content specific facts that can be sued to solve specific problems. Since the collected data is fresh and first hand therefore it makes the study more accurate and genuine.
We at SNS Insider have divided Primary Research into 2 parts.
Part 1 wherein we interview the KOLs of major players as well as the upcoming ones across various geographic regions. This allows us to have their view over the market scenario and acts as an important tool to come closer to the accurate market numbers. As many as 45 paid and unpaid primary interviews are taken from both the demand and supply side of the industry to make sure we land at an accurate judgement and analysis of the market.
This step involves the triangulation of data wherein our team analyses the interview transcripts, online survey responses and observation of on filed participants. The below mentioned chart should give a better understanding of the part 1 of the primary interview.

Part 2: In this part of primary research the data collected via secondary research and the part 1 of the primary research is validated with the interviews from individual consultants and subject matter experts.
Consultants are those set of people who have at least 12 years of experience and expertise within the industry whereas Subject Matter Experts are those with at least 15 years of experience behind their back within the same space. The data with the help of two main processes i.e., FGDs (Focused Group Discussions) and IDs (Individual Discussions). This gives us a 3rd party nonbiased primary view of the market scenario making it a more dependable one while collation of the data pointers.
Step 3: Data Bank Validation
Once all the information is collected via primary and secondary sources, we run that information for data validation. At our intelligence centre our research heads track a lot of information related to the market which includes the quarterly reports, the daily stock prices, and other relevant information. Our data bank server gets updated every fortnight and that is how the information which we collected using our primary and secondary information is revalidated in real time.

Step 4: QA/QC Process
After all the data collection and validation our team does a final level of quality check and quality assurance to get rid of any unwanted or undesired mistakes. This might include but not limited to getting rid of the any typos, duplication of numbers or missing of any important information. The people involved in this process include technical content writers, research heads and graphics people. Once this process is completed the title gets uploader on our platform for our clients to read it.
Step 5: Final QC/QA Process:
This is the last process and comes when the client has ordered the study. In this process a final QA/QC is done before the study is emailed to the client. Since we believe in giving our clients a good experience of our research studies, therefore, to make sure that we do not lack at our end in any way humanly possible we do a final round of quality check and then dispatch the study to the client.
Key Segments:
By Source
Coal Tar
Petroleum
By Application
Phthalic Anhydride
Naphthalene Sulfonates
Low-Volatility Solvents
Moth Repellent
Pesticides
Others
Request for Segment Customization as per your Business Requirement: Segment Customization Request
Regional Coverage:
North America
US
Canada
Mexico
Europe
Eastern Europe
Poland
Romania
Hungary
Turkey
Rest of Eastern Europe
Western Europe
Germany
France
UK
Italy
Spain
Netherlands
Switzerland
Austria
Rest of Western Europe
Asia Pacific
China
India
Japan
South Korea
Vietnam
Singapore
Australia
Rest of Asia Pacific
Middle East & Africa
Middle East
UAE
Egypt
Saudi Arabia
Qatar
Rest of Middle East
Africa
Nigeria
South Africa
Rest of Africa
Latin America
Brazil
Argentina
Colombia
Rest of Latin America
Request for Country Level Research Report: Country Level Customization Request
Available Customization
With the given market data, SNS Insider offers customization as per the company’s specific needs. The following customization options are available for the report:
Detailed Volume Analysis
Criss-Cross segment analysis (e.g. Product X Application)
Competitive Product Benchmarking
Geographic Analysis
Additional countries in any of the regions
Customized Data Representation
Detailed analysis and profiling of additional market players
Green Ammonia Market Size was valued at USD 0.3 billion in 2023 and is expected to reach USD 41.4 billion by 2032, at a CAGR of 72.9% from 2024-2032.
The Flavors & Fragrances Market Size was valued at USD 30.5 billion in 2023, and is expected to reach USD 49.3 billion by 2032, and grow at a CAGR of 5.5% over the forecast period 2024-2032.
Photocatalytic Coatings Market was valued at USD 0.91 Billion in 2023 and is expected to reach USD 2.05 Billion by 2032, at a CAGR of 9.53% from 2024-2032.
The Crop Protection Chemicals Market Size was valued at USD 64.57 Billion in 2023 and is expected to reach USD 102.31 Billion by 2032, growing at a CAGR of 5.30% over the forecast period of 2024-2032.
The Greenhouse Film Market Size was valued at USD 6.76 Billion in 2023 and is expected to reach USD 16.55 Billion by 2032, growing at a CAGR of 10.47% over the forecast period of 2024-2032.
The Emollients Market size was valued at USD 1.70 Billion in 2023. It is expected to grow to USD 2.61 Billion by 2032 & grow at a CAGR of 4.9% by 2024-2032.

Hi! Click one of our member below to chat on Phone
© 2025 All Rights Reserved by SNS Insider Pvt Ltd


