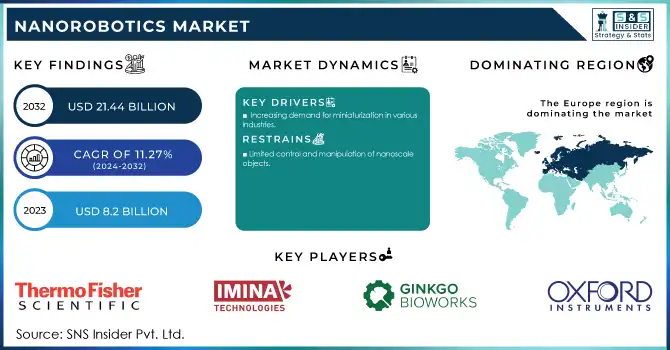
The Nanorobotics Market size was valued at USD 7.87 billion in 2023 and expected to reach to USD 21.53 billion by 2032 and grow at a CAGR of 11.27 % over the forecast period of 2024-2032. The growing adoption of Nano robots in the medical industry for targeted drug delivery as well as the demand for minimally invasive medical treatments. Adoption and usage data can vary from region to region with regions currently savvy in scientific and technological art around nanorobotics (with notable presence from major tech innovators) continuing to make headway with new product development and solidifying investor interest. Moreover, regulatory and safety data are prominent by region for market expansion in addition to user experience and feedback which are actively influencing the future of nanorobotics technologies.
Drivers:
Increasing Demand for Precision Medicine through Nanorobotics
The rising demand for precision medicine is a significant driver for the Nanorobotics Market. Nano robots allow for highly targeted drug delivery and personalized treatments improving the efficacy of therapy reducing side effects. They are also key for early disease detection and precision diagnostics that is revolutionizing healthcare. Among numerous data-driven changes, one area of exploration in recent years has been nanorobotics, which, thanks to the advances in nanotechnology, is particularly experiencing efforts in medical applications to provide more efficient and less invasive treatments. This trend is set to continue, with increasing need for personalized care. In related developments, Zhou and colleagues have designed nanobots measuring just 295 nanometers, smaller than most viruses, to address aneurysm-related strokes.
Restraints:
Regulatory and safety challenges in the nanorobotics market encompass toxicity, ethical concerns, and approval hurdles.
The integration of nanotechnology in healthcare raises significant concerns regarding long-term safety, potential toxicity, and the regulatory hurdles that delay market entry. Health risks, such as accumulation of Nano robots in tissues or unintended bio interactions, will have to be tested extensively based on which clinical evaluation will be performed. Strict regulations are necessary to make sure these technologies pass safety tests, but long approval procedures hinder the pace of implementation. All these factors, along with the challenge of standardizing Nano robot designs and the need to create effective monitoring systems, make regulation even more complex. Issues of this nature, along with public perception issues relating to Nano robot safety and privacy issues, pose an underlying barrier to the advancement of nanorobotics as a mainstream practice within health care.
Opportunities:
Magnetosome-Based Nanorobotics in Industry Automation
Magnetosomes, which are components of magneto tactic bacteria responsive to magnetic fields, have significant potential for enhancing industry automation. Prokaryotic pseudo-organelles finely engineer 15-20 magnetite crystals of ~50 nm, which can enhance manufacturing efficiency and accuracy in precision tasks. Nanotechnology based on magnetic particles (magnetosome) of MM2 is likely to lead to rapid and economic development of industries. Magnetosome-driven smart industrial automation Nan robots can drive these innovations to help reduce the cost of production cycles and develop novel solutions for different manufacturing processes.
Challenges:
Integration Challenges for Nanorobotics in Current Systems and Technologies
Integrating Nano robots with existing technologies and infrastructure, particularly in industries like healthcare and manufacturing, is a significant hurdle to overcome. Process automation can be greatly improved by Applications of next generation, nanorobotics in areas requiring traditional system design and nanorobotics technologies actuation, localization, and system integration These challenges slow down the application of Nano robots in real-world implementations. Furthermore, this complexity is also intensified by the challenge of smooth coordination between micro/nanoscale robots and large-scale systems simultaneously. These integration difficulties need to be overcome to unlock the full potential of Nano robots for biomedical and industrial applications.
By Type
In 2023, the Nano manipulators segment dominated the Nanorobotics Market, capturing around 44% of the market share. These devices, used for the precise manipulation and handling of individual atoms and molecules, are driving significant progress in sectors like healthcare, manufacturing, and electronics. Their ability to perform high-precision tasks at the Nano-scale has led to innovations in areas such as drug delivery systems, microsurgery, and materials science. As demand for precision across various industries continues to rise, the Nano manipulators segment is expected to maintain its leadership, supporting further market growth.
The Bio-Nanorobotics segment is growing rapidly, particularly in healthcare, where bio-Nano robots enable targeted drug delivery, precision diagnostics, and microsurgery, addressing complex medical challenges and paving the way for future medical advancements.
By Application
In 2023, the Nano medicine segment emerged as the dominant force in the Nanorobotics Market, holding around 55% of the market share. Nano robots show unique potential of their own, which can be exploited by scientists to help medicine, covering a completely new area of Nano medicine. In this segment in oncology, it is especially significant as Nano robots are used to target cancer cells with precision and in personalized medicine where treatments are based on individual patients. The development of Nano medicine is galloping the demand for less invasive and effective service in the healthcare system, prompting the global Nano medicine market growth. As nanotech and biotech progress, the segment’s footprint is likely to grow.
The Biomedical segment is anticipated to be the fastest-growing segment from 2024 to 2032. The rise in this segment is of Nano robots in medical applications; medical applications include drug delivery, disease diagnostics, microsurgery, personalized treatments, and cancer treatment and gene therapy are some of the key areas attracting Nano robot technology.
Nanorobotics Market Regional Analysis
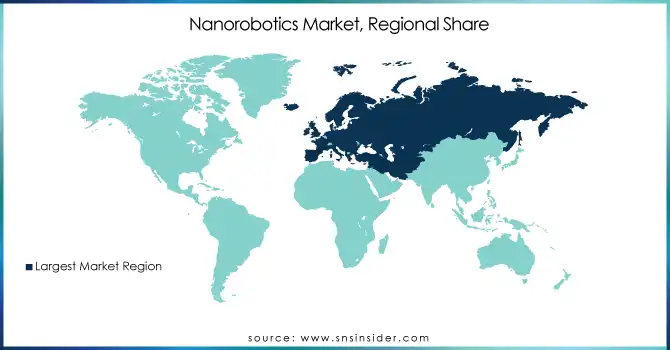
In 2023, North America held the largest share of the Nanorobotics Market, accounting for approximately 40% of the revenue. The region is at the forefront of nanorobotics development, driven by advancements in healthcare, biomedical applications, and manufacturing industries. The U.S., in particular, leads in nanotechnology research and innovation, with a strong emphasis on precision medicine, drug delivery systems, and microsurgery using Nano robots. Key companies such as Medtronic, Intuitive Surgical, and Boston Scientific are actively involved in integrating Nano robots into medical applications, driving regional growth. Research institutions and collaborations between academia and industry further contribute to the region's dominance. North America's robust healthcare infrastructure, high investments in R&D, and growing adoption of nanotechnology in various sectors are key factors propelling its leadership in the global nanorobotics market.
Asia Pacific is the fastest-growing region in the Nanorobotics Market, with significant growth expected during the forecast period from 2024 to 2032. Growing health care and biotechnology investments and nanotechnology advances are propelling rapid development in the region. Countries such as China, Japan, South Korea, and India are advancing in the field of nanorobotics, especially in its applications like drug delivery, disease diagnostics, precision medicine, etc. The growth of biotech startups, research institutions, and government backed initiatives. In particular, China has been making substantial investments in nanorobotics research and development, indicating its emergence as a dominant force in the field. South Korea and Japan have made significant advancements in the production of nanomaterials and Nano robots respectively, whereas India is undertaking the efforts in integrating the nanorobotics into medicinal applications. The region’s growing healthcare needs, strong manufacturing capabilities, and increasing research activities make Asia Pacific a hotbed for nanorobotics development and adoption.
Need any customization research on Nanorobotics Market - Enquiry Now
Some of the Major Players in Nanorobotics Market Along With Their Product:
Thermo Fisher Scientific Inc. [USA] (Products: Electron Microscopes, Mass Spectrometers)
Ginkgo Bioworks [USA] (Products: Synthetic Biology, Cell Programming)
Bruker Corporation [USA] (Products: Atomic Force Microscopes, Mass Spectrometers)
JEOL Ltd. [Japan] (Products: Electron Microscopes, Scanning Probe Microscopes)
Agilent Technologies [USA] (Products: Spectroscopy Instruments, Chromatography Systems)
Oxford Instruments plc [UK] (Products: Nanoparticles, Scanning Probe Microscopes)
Zymergen Inc. [USA] (Products: Bio-manufacturing, Biotechnology Platforms)
Bio-Rad Laboratories, Inc. [USA] (Products: PCR Instruments, Electrophoresis Equipment)
Nanosurf AG [Switzerland] (Products: Atomic Force Microscopes, Scanning Probe Microscopes)
Klocke Nanotechnik GmbH [Germany] (Products: Nanopositioning Systems, Metrology Instruments)
Toronto Nano Instrumentation [Canada] (Products: AFM and STM Systems, Nanoindentation Tools)
Park Systems Corp. [South Korea] (Products: Atomic Force Microscopes, Scanning Probe Microscopes)
WITec Wissenschaftliche Instrumente und Technologie GmbH [Germany] (Products: Raman Microscopes, AFM Systems)
Nanonics Imaging Ltd. [Israel] (Products: Nanoscopy Systems, High-Resolution Imaging Systems)
A.P.E. Research Srl [Italy] (Products: Raman Spectrometers, Optical Systems)
Nanobots Therapeutics [USA] (Products: Medical Nanorobots for Drug Delivery, Targeted Therapies)
Nanovery [France] (Products: Biometric Sensors, Health Monitoring Devices)
List of companies that supply raw materials and components for the nanorobotics market:
Nanosys
NanoComposix
Evident Scientific
Altair Nanotechnologies
LTS (Laser Technology Systems)
Thermo Fisher Scientific
Sigma-Aldrich (Merck)
IBM
NT-MDT
Nanofilm Technology
October 28, 2024: JEOL Ltd, the Japanese company provide the world best electron microscope and analytical instruments, develop The JEM-Z200MF Magnetic Field-Free Electron Microscope.
December 11, 2024: Oxford Instruments NanoScience installed three ProteoxMX dilution refrigerators at the NQCC at Harwell Campus These systems will help NQCC’s research team design superconducting circuit-based quantum computing hardware architectures.
Report Attributes | Details |
Market Size in 2023 | USD 7.87 Billion |
Market Size by 2032 | USD 21.53 Billion |
CAGR | CAGR of 11.83 % From 2024 to 2032 |
Base Year | 2023 |
Forecast Period | 2024-2032 |
Historical Data | 2020-2022 |
Report Scope & Coverage | Market Size, Segments Analysis, Competitive Landscape, Regional Analysis, DROC & SWOT Analysis, Forecast Outlook |
Key Segments | • By Type (Nanomanipulators, Bacteria-Based Bio-Nanorobotics, Magnetically Guided Nanobots, and Others) • By Application (Biomedical, Nanomedicine, Mechanical, Others) |
Regional Analysis/Coverage | North America (US, Canada, Mexico), Europe (Eastern Europe [Poland, Romania, Hungary, Turkey, Rest of Eastern Europe] Western Europe] Germany, France, UK, Italy, Spain, Netherlands, Switzerland, Austria, Rest of Western Europe]), Asia Pacific (China, India, Japan, South Korea, Vietnam, Singapore, Australia, Rest of Asia Pacific), Middle East & Africa (Middle East [UAE, Egypt, Saudi Arabia, Qatar, Rest of Middle East], Africa [Nigeria, South Africa, Rest of Africa], Latin America (Brazil, Argentina, Colombia, Rest of Latin America) |
Company Profiles | Thermo Fisher Scientific Inc. (USA), Ginkgo Bioworks (USA), Bruker Corporation (USA), JEOL Ltd. (Japan), Agilent Technologies (USA), Oxford Instruments plc (UK), Zymergen Inc. (USA), Bio-Rad Laboratories, Inc. (USA), Nanosurf AG (Switzerland), Klocke Nanotechnik GmbH (Germany), Toronto Nano Instrumentation (Canada), Park Systems Corp. (South Korea), WITec Wissenschaftliche Instrumente und Technologie GmbH (Germany), Nanonics Imaging Ltd. (Israel), A.P.E. Research Srl (Italy), Nanobots Therapeutics (USA), and Nanovery (France). |
Ans: The Nanorobotics Market is to grow at a CAGR of 11.83% over the forecast period 2024-2032.
Ans. The Nanorobotics Market size was valued at USD 7.87 Billion in 2023.
Ans: Nano manipulators segment is dominating in By Type in Nanorobotics market
Ans: Nanorobotics is mostly utilized in the biomedical and healthcare sectors for applications like drug delivery, diagnostics, and medical treatments.
Ans: North America is the dominating region in the nanorobotics market.
Table of Content
1. Introduction
1.1 Market Definition
1.2 Scope (Inclusion and Exclusions)
1.3 Research Assumptions
2. Executive Summary
2.1 Market Overview
2.2 Regional Synopsis
2.3 Competitive Summary
3. Research Methodology
3.1 Top-Down Approach
3.2 Bottom-up Approach
3.3. Data Validation
3.4 Primary Interviews
4. Market Dynamics Impact Analysis
4.1 Market Driving Factors Analysis
4.1.2 Drivers
4.1.2 Restraints
4.1.3 Opportunities
4.1.4 Challenges
4.2 PESTLE Analysis
4.3 Porter’s Five Forces Model
5. Statistical Insights and Trends Reporting
5.1 Adoption and Usage Data by Region
5.2 Technological & Product Data, by Region
5.3 Regulatory & Safety Data, by Region
5.4 User Experience & Feedback Data
6. Competitive Landscape
6.1 List of Major Companies, By Region
6.2 Market Share Analysis, By Region
6.3 Product Benchmarking
6.3.1 Product specifications and features
6.3.2 Pricing
6.4 Strategic Initiatives
6.4.1 Marketing and promotional activities
6.4.2 Distribution and supply chain strategies
6.4.3 Expansion plans and new product launches
6.4.4 Strategic partnerships and collaborations
6.5 Technological Advancements
6.6 Market Positioning and Branding
7. Nanorobotics Market Segmentation, by Type
7.1 Chapter Overview
7.2 Nano manipulators
7.2.1 Nano manipulators Market Trends Analysis (2020-2032)
7.2.2 Nano manipulators Market Size Estimates and Forecasts to 2032 (USD Billion)
7.3 Bacteria-Based
7.3.1 Bacteria-Based Market Trends Analysis (2020-2032)
7.3.2 Bacteria-Based Market Size Estimates and Forecasts to 2032 (USD Billion)
7.4 Bio-Nanorobotics
7.4.1 Bio-Nanorobotics Market Trends Analysis (2020-2032)
7.4.2 Bio-Nanorobotics Market Size Estimates and Forecasts to 2032 (USD Billion)
7.5 Magnetically Guided Nanobots
7.5.1 Magnetically Guided Nanobots Market Trends Analysis (2020-2032)
7.5.2 Magnetically Guided Nanobots Market Size Estimates and Forecasts to 2032 (USD Billion)
7.6 Others
7.6.1 Others Market Trends Analysis (2020-2032)
7.6.2 Others Market Size Estimates and Forecasts to 2032 (USD Billion)
8. Nanorobotics Market Segmentation, by Application
8.1 Chapter Overview
8.2 Biomedical
8.2.1 Biomedical Market Trends Analysis (2020-2032)
8.2.2 Biomedical Market Size Estimates and Forecasts to 2032 (USD Billion)
8.3Nanomedicine
8.3.1Nanomedicine Market Trends Analysis (2020-2032)
8.3.2 Nano medicine Market Size Estimates and Forecasts to 2032 (USD Billion)
8.4Mechanical
8.4.1MechanicalMarket Trends Analysis (2020-2032)
8.4.2Mechanical Market Size Estimates and Forecasts to 2032 (USD Billion)
8.5Others
8.5.1Others Market Trends Analysis (2020-2032)
8.5.2Others Market Size Estimates and Forecasts to 2032 (USD Billion)
9. Regional Analysis
9.1 Chapter Overview
9.2 North America
9.2.1 Trends Analysis
9.2.2 North America Nanorobotics Market Estimates and Forecasts, by Country (2020-2032) (USD Billion)
9.2.3 North America Nanorobotics Market Estimates and Forecasts, by Type (2020-2032) (USD Billion)
9.2.4 North America Nanorobotics Market Estimates and Forecasts, by Application (2020-2032) (USD Billion)
9.2.5 USA
9.2.5.1 USA Nanorobotics Market Estimates and Forecasts, by Type (2020-2032) (USD Billion)
9.2.5.2 USA Nanorobotics Market Estimates and Forecasts, by Application (2020-2032) (USD Billion)
9.2.6 Canada
9.2.6.1 Canada Nanorobotics Market Estimates and Forecasts, by Type (2020-2032) (USD Billion)
9.2.6.2 Canada Nanorobotics Market Estimates and Forecasts, by Application (2020-2032) (USD Billion)
9.2.7 Mexico
9.2.7.1 Mexico Nanorobotics Market Estimates and Forecasts, by Type (2020-2032) (USD Billion)
9.2.7.2 Mexico Nanorobotics Market Estimates and Forecasts, by Application (2020-2032) (USD Billion)
9.3 Europe
9.3.1 Eastern Europe
9.3.1.1 Trends Analysis
9.3.1.2 Eastern Europe Nanorobotics Market Estimates and Forecasts, by Country (2020-2032) (USD Billion)
9.3.1.3 Eastern Europe Nanorobotics Market Estimates and Forecasts, by Type (2020-2032) (USD Billion)
9.3.1.4 Eastern Europe Nanorobotics Market Estimates and Forecasts, by Application (2020-2032) (USD Billion)
9.3.1.5 Poland
9.3.1.5.1 Poland Nanorobotics Market Estimates and Forecasts, by Type (2020-2032) (USD Billion)
9.3.1.5.2 Poland Nanorobotics Market Estimates and Forecasts, by Application (2020-2032) (USD Billion)
9.3.1.6 Romania
9.3.1.6.1 Romania Nanorobotics Market Estimates and Forecasts, by Type (2020-2032) (USD Billion)
9.3.1.6.2 Romania Nanorobotics Market Estimates and Forecasts, by Application (2020-2032) (USD Billion)
9.3.1.7 Hungary
9.3.1.7.1 Hungary Nanorobotics Market Estimates and Forecasts, by Type (2020-2032) (USD Billion)
9.3.1.7.2 Hungary Nanorobotics Market Estimates and Forecasts, by Application (2020-2032) (USD Billion)
9.3.1.8 Turkey
9.3.1.8.1 Turkey Nanorobotics Market Estimates and Forecasts, by Type (2020-2032) (USD Billion)
9.3.1.8.2 Turkey Nanorobotics Market Estimates and Forecasts, by Application (2020-2032) (USD Billion)
9.3.1.9 Rest of Eastern Europe
9.3.1.9.1 Rest of Eastern Europe Nanorobotics Market Estimates and Forecasts, by Type (2020-2032) (USD Billion)
9.3.1.9.2 Rest of Eastern Europe Nanorobotics Market Estimates and Forecasts, by Application (2020-2032) (USD Billion)
9.3.2 Western Europe
9.3.2.1 Trends Analysis
9.3.2.2 Western Europe Nanorobotics Market Estimates and Forecasts, by Country (2020-2032) (USD Billion)
9.3.2.3 Western Europe Nanorobotics Market Estimates and Forecasts, by Type (2020-2032) (USD Billion)
9.3.2.4 Western Europe Nanorobotics Market Estimates and Forecasts, by Application (2020-2032) (USD Billion)
9.3.2.5 Germany
9.3.2.5.1 Germany Nanorobotics Market Estimates and Forecasts, by Type (2020-2032) (USD Billion)
9.3.2.5.2 Germany Nanorobotics Market Estimates and Forecasts, by Application (2020-2032) (USD Billion)
9.3.2.6 France
9.3.2.6.1 France Nanorobotics Market Estimates and Forecasts, by Type (2020-2032) (USD Billion)
9.3.2.6.2 France Nanorobotics Market Estimates and Forecasts, by Application (2020-2032) (USD Billion)
9.3.2.7 UK
9.3.2.7.1 UK Nanorobotics Market Estimates and Forecasts, by Type (2020-2032) (USD Billion)
9.3.2.7.2 UK Nanorobotics Market Estimates and Forecasts, by Application (2020-2032) (USD Billion)
9.3.2.8 Italy
9.3.2.8.1 Italy Nanorobotics Market Estimates and Forecasts, by Type (2020-2032) (USD Billion)
9.3.2.8.2 Italy Nanorobotics Market Estimates and Forecasts, by Application (2020-2032) (USD Billion)
9.3.2.9 Spain
9.3.2.9.1 Spain Nanorobotics Market Estimates and Forecasts, by Type (2020-2032) (USD Billion)
9.3.2.9.2 Spain Nanorobotics Market Estimates and Forecasts, by Application (2020-2032) (USD Billion)
9.3.2.10 Netherlands
9.3.2.10.1 Netherlands Nanorobotics Market Estimates and Forecasts, by Type (2020-2032) (USD Billion)
9.3.2.10.2 Netherlands Nanorobotics Market Estimates and Forecasts, by Application (2020-2032) (USD Billion)
9.3.2.11 Switzerland
9.3.2.11.1 Switzerland Nanorobotics Market Estimates and Forecasts, by Type (2020-2032) (USD Billion)
9.3.2.11.2 Switzerland Nanorobotics Market Estimates and Forecasts, by Application (2020-2032) (USD Billion)
9.3.2.12 Austria
9.3.2.12.1 Austria Nanorobotics Market Estimates and Forecasts, by Type (2020-2032) (USD Billion)
9.3.2.12.2 Austria Nanorobotics Market Estimates and Forecasts, by Application (2020-2032) (USD Billion)
9.3.2.13 Rest of Western Europe
9.3.2.13.1 Rest of Western Europe Nanorobotics Market Estimates and Forecasts, by Type (2020-2032) (USD Billion)
9.3.2.13.2 Rest of Western Europe Nanorobotics Market Estimates and Forecasts, by Application (2020-2032) (USD Billion)
9.4 Asia Pacific
9.4.1 Trends Analysis
9.4.2 Asia Pacific Nanorobotics Market Estimates and Forecasts, by Country (2020-2032) (USD Billion)
9.4.3 Asia Pacific Nanorobotics Market Estimates and Forecasts, by Type (2020-2032) (USD Billion)
9.4.4 Asia Pacific Nanorobotics Market Estimates and Forecasts, by Application (2020-2032) (USD Billion)
9.4.5 China
9.4.5.1 China Nanorobotics Market Estimates and Forecasts, by Type (2020-2032) (USD Billion)
9.4.5.2 China Nanorobotics Market Estimates and Forecasts, by Application (2020-2032) (USD Billion)
9.4.6 India
9.4.5.1 India Nanorobotics Market Estimates and Forecasts, by Type (2020-2032) (USD Billion)
9.4.5.2 India Nanorobotics Market Estimates and Forecasts, by Application (2020-2032) (USD Billion)
9.4.5 Japan
9.4.5.1 Japan Nanorobotics Market Estimates and Forecasts, by Type (2020-2032) (USD Billion)
9.4.5.2 Japan Nanorobotics Market Estimates and Forecasts, by Application (2020-2032) (USD Billion)
9.4.6 South Korea
9.4.6.1 South Korea Nanorobotics Market Estimates and Forecasts, by Type (2020-2032) (USD Billion)
9.4.6.2 South Korea Nanorobotics Market Estimates and Forecasts, by Application (2020-2032) (USD Billion)
9.4.7 Vietnam
9.4.7.1 Vietnam Nanorobotics Market Estimates and Forecasts, by Type (2020-2032) (USD Billion)
9.2.7.2 Vietnam Nanorobotics Market Estimates and Forecasts, by Application (2020-2032) (USD Billion)
9.4.8 Singapore
9.4.8.1 Singapore Nanorobotics Market Estimates and Forecasts, by Type (2020-2032) (USD Billion)
9.4.8.2 Singapore Nanorobotics Market Estimates and Forecasts, by Application (2020-2032) (USD Billion)
9.4.9 Australia
9.4.9.1 Australia Nanorobotics Market Estimates and Forecasts, by Type (2020-2032) (USD Billion)
9.4.9.2 Australia Nanorobotics Market Estimates and Forecasts, by Application (2020-2032) (USD Billion)
9.4.10 Rest of Asia Pacific
9.4.10.1 Rest of Asia Pacific Nanorobotics Market Estimates and Forecasts, by Type (2020-2032) (USD Billion)
9.4.10.2 Rest of Asia Pacific Nanorobotics Market Estimates and Forecasts, by Application (2020-2032) (USD Billion)
9.5 Middle East and Africa
9.5.1 Middle East
9.5.1.1 Trends Analysis
9.5.1.2 Middle East Nanorobotics Market Estimates and Forecasts, by Country (2020-2032) (USD Billion)
9.5.1.3 Middle East Nanorobotics Market Estimates and Forecasts, by Type (2020-2032) (USD Billion)
9.5.1.4 Middle East Nanorobotics Market Estimates and Forecasts, by Application (2020-2032) (USD Billion)
9.5.1.5 UAE
9.5.1.5.1 UAE Nanorobotics Market Estimates and Forecasts, by Type (2020-2032) (USD Billion)
9.5.1.5.2 UAE Nanorobotics Market Estimates and Forecasts, by Application (2020-2032) (USD Billion)
9.5.1.6 Egypt
9.5.1.6.1 Egypt Nanorobotics Market Estimates and Forecasts, by Type (2020-2032) (USD Billion)
9.5.1.6.2 Egypt Nanorobotics Market Estimates and Forecasts, by Application (2020-2032) (USD Billion)
9.5.1.7 Saudi Arabia
9.5.1.7.1 Saudi Arabia Nanorobotics Market Estimates and Forecasts, by Type (2020-2032) (USD Billion)
9.5.1.7.2 Saudi Arabia Nanorobotics Market Estimates and Forecasts, by Application (2020-2032) (USD Billion)
9.5.1.8 Qatar
9.5.1.8.1 Qatar Nanorobotics Market Estimates and Forecasts, by Type (2020-2032) (USD Billion)
9.5.1.8.2 Qatar Nanorobotics Market Estimates and Forecasts, by Application (2020-2032) (USD Billion)
9.5.1.9 Rest of Middle East
9.5.1.9.1 Rest of Middle East Nanorobotics Market Estimates and Forecasts, by Type (2020-2032) (USD Billion)
9.5.1.9.2 Rest of Middle East Nanorobotics Market Estimates and Forecasts, by Application (2020-2032) (USD Billion)
9.5.2 Africa
9.5.2.1 Trends Analysis
9.5.2.2 Africa Nanorobotics Market Estimates and Forecasts, by Country (2020-2032) (USD Billion)
9.5.2.3 Africa Nanorobotics Market Estimates and Forecasts, by Type (2020-2032) (USD Billion)
9.5.2.4 Africa Nanorobotics Market Estimates and Forecasts, by Application (2020-2032) (USD Billion)
9.5.2.5 South Africa
9.5.2.5.1 South Africa Nanorobotics Market Estimates and Forecasts, by Type (2020-2032) (USD Billion)
9.5.2.5.2 South Africa Nanorobotics Market Estimates and Forecasts, by Application (2020-2032) (USD Billion)
9.5.2.6 Nigeria
9.5.2.6.1 Nigeria Nanorobotics Market Estimates and Forecasts, by Type (2020-2032) (USD Billion)
9.5.2.6.2 Nigeria Nanorobotics Market Estimates and Forecasts, by Application (2020-2032) (USD Billion)
9.5.2.7 Rest of Africa
9.5.2.7.1 Rest of Africa Nanorobotics Market Estimates and Forecasts, by Type (2020-2032) (USD Billion)
9.5.2.7.2 Rest of Africa Nanorobotics Market Estimates and Forecasts, by Application (2020-2032) (USD Billion)
9.6 Latin America
9.6.1 Trends Analysis
9.6.2 Latin America Nanorobotics Market Estimates and Forecasts, by Country (2020-2032) (USD Billion)
9.6.3 Latin America Nanorobotics Market Estimates and Forecasts, by Type (2020-2032) (USD Billion)
9.6.4 Latin America Nanorobotics Market Estimates and Forecasts, by Application (2020-2032) (USD Billion)
9.6.5 Brazil
9.6.5.1 Brazil Nanorobotics Market Estimates and Forecasts, by Type (2020-2032) (USD Billion)
9.6.5.2 Brazil Nanorobotics Market Estimates and Forecasts, by Application (2020-2032) (USD Billion)
9.6.6 Argentina
9.6.6.1 Argentina Nanorobotics Market Estimates and Forecasts, by Type (2020-2032) (USD Billion)
9.6.6.2 Argentina Nanorobotics Market Estimates and Forecasts, by Application (2020-2032) (USD Billion)
9.6.7 Colombia
9.6.7.1 Colombia Nanorobotics Market Estimates and Forecasts, by Type (2020-2032) (USD Billion)
9.6.7.2 Colombia Nanorobotics Market Estimates and Forecasts, by Application (2020-2032) (USD Billion)
9.6.8 Rest of Latin America
9.6.8.1 Rest of Latin America Nanorobotics Market Estimates and Forecasts, by Type (2020-2032) (USD Billion)
9.6.8.2 Rest of Latin America Nanorobotics Market Estimates and Forecasts, by Application (2020-2032) (USD Billion)
10. Company Profiles
10.1 Thermo Fisher Scientific Inc.
10.1.1 Company Overview
10.1.2 Financial
10.1.3 Products/ Services Offered
10.1.4 SWOT Analysis
10.2 , Ginkgo Bioworks
10.2.1 Company Overview
10.2.2 Financial
10.2.3 Products/ Services Offered
10.2.4 SWOT Analysis
10.3 Bruker Corporation
10.3.1 Company Overview
10.3.2 Financial
10.3.3 Products/ Services Offered
10.3.4 SWOT Analysis
10.4 JEOL Ltd.
10.4.1 Company Overview
10.4.2 Financial
10.4.3 Products/ Services Offered
10.4.4 SWOT Analysis
10.5 Agilent Technologies
10.5.1 Company Overview
10.5.2 Financial
10.5.3 Products/ Services Offered
10.5.4 SWOT Analysis
10.6 Oxford Instruments plc
10.6.1 Company Overview
10.6.2 Financial
10.6.3 Products/ Services Offered
10.6.4 SWOT Analysis
10.7 Zymergen Inc.
10.7.1 Company Overview
10.7.2 Financial
10.7.3 Products/ Services Offered
10.7.4 SWOT Analysis
10.8 Bio-Rad Laboratories, Inc.
10.8.1 Company Overview
10.8.2 Financial
10.8.3 Products/ Services Offered
10.8.4 SWOT Analysis
10.9 Nanosurf AG
10.9.1 Company Overview
10.9.2 Financial
10.9.3 Products/ Services Offered
10.9.4 SWOT Analysis
10.10 Klocke Nanotechnik GmbH
10.10.1 Company Overview
10.10.2 Financial
10.10.3 Products/ Services Offered
10.10.4 SWOT Analysis
11. Use Cases and Best Practices
12. Conclusion
An accurate research report requires proper strategizing as well as implementation. There are multiple factors involved in the completion of good and accurate research report and selecting the best methodology to compete the research is the toughest part. Since the research reports we provide play a crucial role in any company’s decision-making process, therefore we at SNS Insider always believe that we should choose the best method which gives us results closer to reality. This allows us to reach at a stage wherein we can provide our clients best and accurate investment to output ratio.
Each report that we prepare takes a timeframe of 350-400 business hours for production. Starting from the selection of titles through a couple of in-depth brain storming session to the final QC process before uploading our titles on our website we dedicate around 350 working hours. The titles are selected based on their current market cap and the foreseen CAGR and growth.
The 5 steps process:
Step 1: Secondary Research:
Secondary Research or Desk Research is as the name suggests is a research process wherein, we collect data through the readily available information. In this process we use various paid and unpaid databases which our team has access to and gather data through the same. This includes examining of listed companies’ annual reports, Journals, SEC filling etc. Apart from this our team has access to various associations across the globe across different industries. Lastly, we have exchange relationships with various university as well as individual libraries.
Step 2: Primary Research
When we talk about primary research, it is a type of study in which the researchers collect relevant data samples directly, rather than relying on previously collected data. This type of research is focused on gaining content specific facts that can be sued to solve specific problems. Since the collected data is fresh and first hand therefore it makes the study more accurate and genuine.
We at SNS Insider have divided Primary Research into 2 parts.
Part 1 wherein we interview the KOLs of major players as well as the upcoming ones across various geographic regions. This allows us to have their view over the market scenario and acts as an important tool to come closer to the accurate market numbers. As many as 45 paid and unpaid primary interviews are taken from both the demand and supply side of the industry to make sure we land at an accurate judgement and analysis of the market.
This step involves the triangulation of data wherein our team analyses the interview transcripts, online survey responses and observation of on filed participants. The below mentioned chart should give a better understanding of the part 1 of the primary interview.
Part 2: In this part of primary research the data collected via secondary research and the part 1 of the primary research is validated with the interviews from individual consultants and subject matter experts.
Consultants are those set of people who have at least 12 years of experience and expertise within the industry whereas Subject Matter Experts are those with at least 15 years of experience behind their back within the same space. The data with the help of two main processes i.e., FGDs (Focused Group Discussions) and IDs (Individual Discussions). This gives us a 3rd party nonbiased primary view of the market scenario making it a more dependable one while collation of the data pointers.
Step 3: Data Bank Validation
Once all the information is collected via primary and secondary sources, we run that information for data validation. At our intelligence centre our research heads track a lot of information related to the market which includes the quarterly reports, the daily stock prices, and other relevant information. Our data bank server gets updated every fortnight and that is how the information which we collected using our primary and secondary information is revalidated in real time.
Step 4: QA/QC Process
After all the data collection and validation our team does a final level of quality check and quality assurance to get rid of any unwanted or undesired mistakes. This might include but not limited to getting rid of the any typos, duplication of numbers or missing of any important information. The people involved in this process include technical content writers, research heads and graphics people. Once this process is completed the title gets uploader on our platform for our clients to read it.
Step 5: Final QC/QA Process:
This is the last process and comes when the client has ordered the study. In this process a final QA/QC is done before the study is emailed to the client. Since we believe in giving our clients a good experience of our research studies, therefore, to make sure that we do not lack at our end in any way humanly possible we do a final round of quality check and then dispatch the study to the client.
Key Segments:
By Type
Nano manipulators
Bacteria-Based
Bio-Nanorobotics
Magnetically Guided Nanobots
Others
By Application
Biomedical
Nano medicine
Mechanical
Others
Request for Segment Customization as per your Business Requirement: Segment Customization Request
Regional Coverage:
North America
US
Canada
Mexico
Europe
Eastern Europe
Poland
Romania
Hungary
Turkey
Rest of Eastern Europe
Western Europe
Germany
France
UK
Italy
Spain
Netherlands
Switzerland
Austria
Rest of Western Europe
Asia Pacific
China
India
Japan
South Korea
Vietnam
Singapore
Australia
Rest of Asia Pacific
Middle East & Africa
Middle East
UAE
Egypt
Saudi Arabia
Qatar
Rest of Middle East
Africa
Nigeria
South Africa
Rest of Africa
Latin America
Brazil
Argentina
Colombia
Rest of Latin America
Request for Country Level Research Report: Country Level Customization Request
Available Customization
With the given market data, SNS Insider offers customization as per the company’s specific needs. The following customization options are available for the report:
Detailed Volume Analysis
Criss-Cross segment analysis (e.g. Product X Application)
Competitive Product Benchmarking
Geographic Analysis
Additional countries in any of the regions
Customized Data Representation
Detailed analysis and profiling of additional market players
The Amplifiers Market Size was valued at USD 29.75 billion in 2023 and is expected to grow at a CAGR of 7.2%, reaching USD 55.62 billion by 2032.
The Instrument Cluster Market size was valued at USD 10.9 billion in 2023 and is expected to grow to USD 15.8 billion by 2032 and grow at a CAGR Of 4.2 % over the forecast period of 2024-2032.
The Solid State Battery Market size is expected to be valued at USD 83.20 Million in 2023. It is estimated to reach USD 1953.07 Million by 2032 with a growing CAGR of 42% over the forecast period 2024-2032.
The Commercial Display Market Size was USD 52.13 Billion in 2023 and is expected to reach USD 93.16 Billion by 2032 & grow at a CAGR of 6.70% by 2024-2032.
The Speed Sensor Market Size was valued at USD 8.68 Billion in 2023 and is expected to grow at a CAGR of 4.35% to reach USD 12.73 Billion by 2032.
The Arbitrary Waveform Generator Market Size was valued at USD 444.98 Million in 2023 and is expected to grow at a CAGR of 8.79% During 2024-2032.
Hi! Click one of our member below to chat on Phone