Nanochemicals Market Report Scope & Overview:
Get More Information on Nanochemicals Market - Request Sample Report
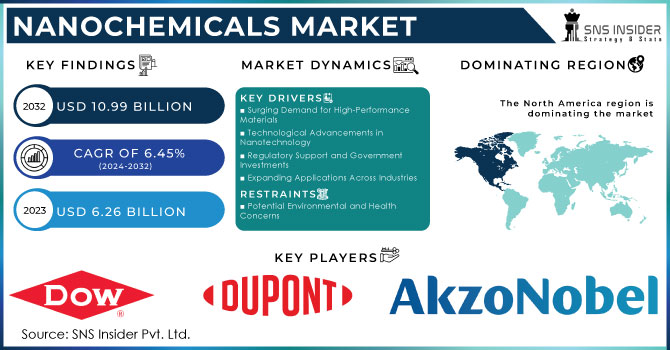
The Nanochemicals Market was worth USD 6.26 billion in 2023 and is expected to grow to USD 10.99 billion by 2032, with a CAGR of 6.45% % in the forecast period 2024-2032.
The nanochemicals market is growing rapidly, driven primarily by developments in the field of nanotechnology and an increasing application base across industries. A rise in demand for better-performance materials is one of the major factors helping in growth. Enhanced properties of nanochemicals, basically for strength, conductivity, catalytic efficiency, and other such factors, have become instrumental in changing the face of important industries such as electronics, healthcare, and energy.
Nanochemicals provide the electronics industry with important material bases that act as the frameworks necessary for the creation of smaller and more efficient parts such as transistors and memory devices. A good example is quantum dots, one form of nanochemicals. They improve brightness and color accuracy on a lot of display devices—from TVs to smartphones. Take, for instance, Samsung's announcement in November 2023 that quantum dot technology would be used in its new range of premium TVs, so it could build on its QD-OLED displays for more vivid colors and better brightness than was achieved with earlier OLED displays. The nanomaterials in health care will ensure targeted therapy that reduces side effects and enhances the treatment outcome, while in diagnostic tools, they will enhance their sensitivity and increase their accuracy for nanoparticle-based drug delivery systems.
The nanochemicals industry noticed a positive effect on the energy sector, nanochemicals, particularly innovations concerning solar panels and energy storage solutions. An increased energy density within the batteries, due to nanomaterials such as graphene, enhances their recharging ability. Accordingly, these developments lead toward sustainable energy technologies.
Furthermore, regulatory support and funding for research and development are other factors that drive market growth. Research in nanotechnology is being funded by many governments and private investors as a driver of innovation and solver of global problems. For example, the linkages between universities, research centers, and industries allow innovating in the synthesis of nanomaterials and their application.
MARKET DYNAMICS
KEY DRIVERS:
Surging Demand for High-Performance Materials
Technological Advancements in Nanotechnology
Regulatory Support and Government Investments
Expanding Applications Across Industries
The Nanochemicals Market is gaining great momentum due to its increasing applications across various industries. Distinct properties at the nanoscale make nanochemicals useful in industries ranging from electronics and healthcare to energy and environmental technologies. In the field of electronics, nanochemicals improve device performance by creating smaller components that increase energy efficiency. In healthcare, nanochemicals revolutionize drug delivery systems by providing targeted therapies that reduce side effects. Moreover, nanochemicals play a central role in the development of sustainable energies through innovations related to solar cells and energy storage. This broad spectrum of applications underlines their role in steering and serving the evolution of technology and related industry needs.
RESTRAIN:
Potential Environmental and Health Concerns
OPPORTUNITY:
Rising Demand for Miniaturization and Efficiency
Development of Biocompatible Nanomaterials
KEY MARKET SEGMENTS
By Type
In 2023, the nanochemicals market was dominated by electronic chemicals, capturing 20.4% of the revenue generated. These are materials of different types and are highly important during the production process in any type of electronic component or device. This segment includes materials for semiconductor fabrication, printed circuit boards, and displays. Electronic chemicals, hence, become very important to ensure reliability, efficiency, and miniaturization in electronic products. The attention in this segment are photoresists, etchants, cleaning agents, and dopants—all being the big contributors to the semiconductor manufacturing process. The dominance of Electronic Chemicals in the Nanochemicals Market underlines the strong demand for sophisticated electronic devices on one side and the continuous evolution of semiconductor technology towards smaller, faster, and energy-efficient components on the other.
By Application
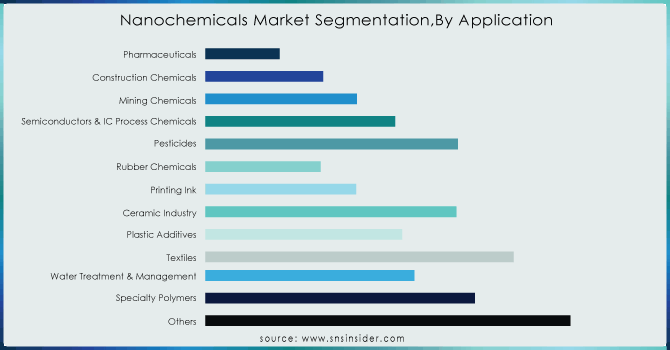
In 2023, the pharmaceuticals segment dominated the nanochemicals market, with a revenue share of 15.9%. There are some key drivers for this application. Nanochemicals are quite critical in pharmaceutical applications, as they help in developing drug delivery systems, formulation, and improving the in-vivo therapeutic efficacy of drugs. Nanotechnology makes it possible to develop nanoparticles and nanostructures for enhancing drug stability and improving their solubility, targeting their delivery to cell types or tissues. Applications include nano-sized carriers of drugs such as liposomes, nanocrystals, and polymer nanoparticles able to improve the functions of conventional and biotechnological drugs. On the other hand, nanochemicals could offer the possibility to enable personalized treatments and new therapies, hence pushing0020innovation in the pharmaceutical industry. This domination of Pharmaceuticals in the Nanochemicals Market explains its vital contribution toward better therapy and drug delivery systems for the benefit of improving healthcare outcome.
Need any customization research on Nanochemicals Market - Enquiry Now
REGIONAL ANALYSIS
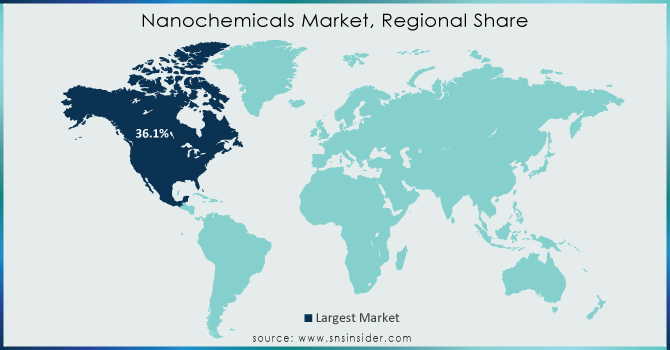
The Nanochemicals Market in North America accounted for the highest market share of about 36.1% in 2023. It is characterized by heavy investments in R&D, well-developed technological infrastructure, and the presence of major players in the marketplace. At present, North America leads in nanotechnology in innovation and commercialization, particularly on domain areas such as electronics, healthcare, and energy. The region is also providing an enabling environment for safe and effective use of nanochemicals across industries with a more forward-looking and proactive regime. A more crucial characteristic is strategic collaboration between academicians, research organizations, and stakeholders from the industry that underpins continuance in technological advancement for nanotechnology applications. The dominance of the nanochemicals market by North America is an indication of lead in technological innovation and growth of the market in this vital sector.
Key players
Some of the major players in the Nanochemicals Market are BASF SE, Dow Chemical Company, AkzoNobel N.V., DuPont, Evonik Industries AG, PPG Industries Inc., Huntsman Corporation, Wacker Chemie AG, Arkema Group, Cabot Corporation, Eastman Chemical Company, Clariant AG, Merck Group, Kemira Oyj, Elementis plc, Solvay S.A., Nanophase Technologies Corporation, Nanoco Group plc, Nanosys, Inc., NanoMaterials Ltd. and other players.
RECENT DEVELOPMENTS
February 2023: Researchers at Chalmers University of Technology have created new methods to discover nano-scale drug molecules in cells.
January 2023: Zydex Industries develops Nanotechnology solutions for long-lasting roads.
October 2022: Coval Technologies announced that it had produced its first batch ever of nanotechnology coatings from its production facility in Singapore.
September 2022: Vikas Ecotech signed an MoU with Aurapha Private Ltd. for starting a new plant using Nano Calcium Carbonate inward conjugated polymer matrix for corrosion protection, together with a process for the preparation.
Report Attributes | Details |
---|---|
Market Size in 2023 | US$ 6.26 billion |
Market Size by 2032 | US$ 10.99 Billion |
CAGR | CAGR of 6.45% From 2024 to 2032 |
Base Year | 2023 |
Forecast Period | 2024-2031 |
Historical Data | 2020-2022 |
Report Scope & Coverage | Market Size, Segments Analysis, Competitive Landscape, Regional Analysis, DROC & SWOT Analysis, Forecast Outlook |
Key Segments | •By Type (Metal Finishing Chemicals, Electronic Chemicals, Cleaners, Industrial & Specialty Gases, Engineering Plastics, Moulding Powder, Bio-chemicals, Rubber Chemicals, Wet Chemicals) •By Application (Pharmaceuticals, Construction Chemicals, Mining Chemicals, Semiconductors & IC Process Chemicals, Pesticides, Rubber Chemicals, Printing Ink, Ceramic Industry, Plastic Additives, Textiles, Water Treatment & Management, Specialty Polymers, Others) |
Regional Analysis/Coverage | North America (US, Canada, Mexico), Europe (Eastern Europe [Poland, Romania, Hungary, Turkey, Rest of Eastern Europe] Western Europe [Germany, France, UK, Italy, Spain, Netherlands, Switzerland, Austria, Rest of Western Europe]), Asia Pacific (China, India, Japan, South Korea, Vietnam, Singapore, Australia, Rest of Asia Pacific), Middle East & Africa (Middle East [UAE, Egypt, Saudi Arabia, Qatar, Rest of Middle East], Africa [Nigeria, South Africa, Rest of Africa], Latin America (Brazil, Argentina, Colombia, Rest of Latin America) |
Company Profiles | BASF SE, Dow Chemical Company, AkzoNobel N.V., DuPont, Evonik Industries AG, PPG Industries Inc., Huntsman Corporation, Wacker Chemie AG, Arkema Group, Cabot Corporation, Eastman Chemical Company, Clariant AG, Merck Group, Kemira Oyj, Elementis plc, Solvay S.A., Nanophase Technologies Corporation, Nanoco Group plc, Nanosys, Inc., NanoMaterials Ltd. |
Key Drivers | •Surging Demand for High-Performance Materials •Technological Advancements in Nanotechnology •Regulatory Support and Government Investments •Expanding Applications Across Industries |
Restraints | •Potential Environmental and Health Concerns |
The North American region dominated the Nanochemicals Market holding the largest market share during the forecast period.
Potential environmental and health concerns hamper the growth of the market.
Rising demand for miniaturization and efficiency and development of biocompatible nanomaterials are some of the opportunities in the Nanochemicals market
Nanochemicals Market size was USD 6.26 billion in 2023 and is expected to reach USD 10.99 billion by 2032.
The Nanochemicals Market is expected to grow at a CAGR of 6.45%.
Table of Contents
1. Introduction
1.1 Market Definition
1.2 Scope
1.3 Research Assumptions
2. Industry Flowchart
3. Research Methodology
4. Market Dynamics
4.1 Drivers
4.2 Restraints
4.3 Opportunities
4.4 Challenges
5. Porter’s 5 Forces Model
6. Pest Analysis
7. Nanochemicals Market Segmentation, By Product Type
7.1 Introduction
7.2 Metal Finishing Chemicals
7.3 Electronic Chemicals
7.4 Cleaners
7.5 Industrial & Specialty Gases
7.6 Engineering Plastics
7.7 Moulding Powder
7.8 Bio-chemicals
7.9 Rubber Chemicals
7.10 Wet Chemicals
7.11 Others
8. Nanochemicals Market Segmentation, By Application
8.1 Introduction
8.2 Pharmaceuticals
8.3 Construction Chemicals
8.4 Mining Chemicals
8.5 Semiconductors & IC Process Chemicals
8.6 Pesticides
8.7 Rubber Chemicals
8.8 Printing Ink
8.9 Ceramic Industry
8.10 Plastic Additives
8.11 Textiles
8.12 Water Treatment & Management
8.13 Specialty Polymers
8.14 Others
9. Regional Analysis
9.1 Introduction
9.2 North America
9.2.1 Trend Analysis
9.2.2 North America Nanochemicals Market by Country
9.2.3 North America Nanochemicals Market By Product Type
9.2.4 North America Nanochemicals Market By Application
9.2.5 USA
9.2.5.1 USA Nanochemicals Market By Product Type
9.2.5.2 USA Nanochemicals Market By Application
9.2.6 Canada
9.2.6.1 Canada Nanochemicals Market By Product Type
9.2.6.2 Canada Nanochemicals Market By Application
9.2.7 Mexico
9.2.7.1 Mexico Nanochemicals Market By Product Type
9.2.7.2 Mexico Nanochemicals Market By Application
9.3 Europe
9.3.1 Trend Analysis
9.3.2 Eastern Europe
9.3.2.1 Eastern Europe Nanochemicals Market by Country
9.3.2.2 Eastern Europe Nanochemicals Market By Product Type
9.3.2.3 Eastern Europe Nanochemicals Market By Application
9.3.2.4 Poland
9.3.2.4.1 Poland Nanochemicals Market By Product Type
9.3.2.4.2 Poland Nanochemicals Market By Application
9.3.2.5 Romania
9.3.2.5.1 Romania Nanochemicals Market By Product Type
9.3.2.5.2 Romania Nanochemicals Market By Application
9.3.2.6 Hungary
9.3.2.6.1 Hungary Nanochemicals Market By Product Type
9.3.2.6.2 Hungary Nanochemicals Market By Application
9.3.2.7 Turkey
9.3.2.7.1 Turkey Nanochemicals Market By Product Type
9.3.2.7.2 Turkey Nanochemicals Market By Application
9.3.2.8 Rest of Eastern Europe
9.3.2.8.1 Rest of Eastern Europe Nanochemicals Market By Product Type
9.3.2.8.2 Rest of Eastern Europe Nanochemicals Market By Application
9.3.3 Western Europe
9.3.3.1 Western Europe Nanochemicals Market by Country
9.3.3.2 Western Europe Nanochemicals Market By Product Type
9.3.3.3 Western Europe Nanochemicals Market By Application
9.3.3.4 Germany
9.3.3.4.1 Germany Nanochemicals Market By Product Type
9.3.3.4.2 Germany Nanochemicals Market By Application
9.3.3.5 France
9.3.3.5.1 France Nanochemicals Market By Product Type
9.3.3.5.2 France Nanochemicals Market By Application
9.3.3.6 UK
9.3.3.6.1 UK Nanochemicals Market By Product Type
9.3.3.6.2 UK Nanochemicals Market By Application
9.3.3.7 Italy
9.3.3.7.1 Italy Nanochemicals Market By Product Type
9.3.3.7.2 Italy Nanochemicals Market By Application
9.3.3.8 Spain
9.3.3.8.1 Spain Nanochemicals Market By Product Type
9.3.3.8.2 Spain Nanochemicals Market By Application
9.3.3.9 Netherlands
9.3.3.9.1 Netherlands Nanochemicals Market By Product Type
9.3.3.9.2 Netherlands Nanochemicals Market By Application
9.3.3.10 Switzerland
9.3.3.10.1 Switzerland Nanochemicals Market By Product Type
9.3.3.10.2 Switzerland Nanochemicals Market By Application
9.3.3.11 Austria
9.3.3.11.1 Austria Nanochemicals Market By Product Type
9.3.3.11.2 Austria Nanochemicals Market By Application
9.3.3.12 Rest of Western Europe
9.3.3.12.1 Rest of Western Europe Nanochemicals Market By Product Type
9.3.2.12.2 Rest of Western Europe Nanochemicals Market By Application
9.4 Asia-Pacific
9.4.1 Trend Analysis
9.4.2 Asia Pacific Nanochemicals Market by Country
9.4.3 Asia Pacific Nanochemicals Market By Product Type
9.4.4 Asia Pacific Nanochemicals Market By Application
9.4.5 China
9.4.5.1 China Nanochemicals Market By Product Type
9.4.5.2 China Nanochemicals Market By Application
9.4.6 India
9.4.6.1 India Nanochemicals Market By Product Type
9.4.6.2 India Nanochemicals Market By Application
9.4.7 Japan
9.4.7.1 Japan Nanochemicals Market By Product Type
9.4.7.2 Japan Nanochemicals Market By Application
9.4.8 South Korea
9.4.8.1 South Korea Nanochemicals Market By Product Type
9.4.8.2 South Korea Nanochemicals Market By Application
9.4.9 Vietnam
9.4.9.1 Vietnam Nanochemicals Market By Product Type
9.4.9.2 Vietnam Nanochemicals Market By Application
9.4.10 Singapore
9.4.10.1 Singapore Nanochemicals Market By Product Type
9.4.10.2 Singapore Nanochemicals Market By Application
9.4.11 Australia
9.4.11.1 Australia Nanochemicals Market By Product Type
9.4.11.2 Australia Nanochemicals Market By Application
9.4.12 Rest of Asia-Pacific
9.4.12.1 Rest of Asia-Pacific Nanochemicals Market By Product Type
9.4.12.2 Rest of Asia-Pacific Nanochemicals Market By Application
9.5 Middle East & Africa
9.5.1 Trend Analysis
9.5.2 Middle East
9.5.2.1 Middle East Nanochemicals Market by Country
9.5.2.2 Middle East Nanochemicals Market By Product Type
9.5.2.3 Middle East Nanochemicals Market By Application
9.5.2.4 UAE
9.5.2.4.1 UAE Nanochemicals Market By Product Type
9.5.2.4.2 UAE Nanochemicals Market By Application
9.5.2.5 Egypt
9.5.2.5.1 Egypt Nanochemicals Market By Product Type
9.5.2.5.2 Egypt Nanochemicals Market By Application
9.5.2.6 Saudi Arabia
9.5.2.6.1 Saudi Arabia Nanochemicals Market By Product Type
9.5.2.6.2 Saudi Arabia Nanochemicals Market By Application
9.5.2.7 Qatar
9.5.2.7.1 Qatar Nanochemicals Market By Product Type
9.5.2.7.2 Qatar Nanochemicals Market By Application
9.5.2.8 Rest of Middle East
9.5.2.8.1 Rest of Middle East Nanochemicals Market By Product Type
9.5.2.8.2 Rest of Middle East Nanochemicals Market By Application
9.5.3 Africa
9.5.3.1 Africa Nanochemicals Market by Country
9.5.3.2 Africa Nanochemicals Market By Product Type
9.5.3.3 Africa Nanochemicals Market By Application
9.5.2.4 Nigeria
9.5.2.4.1 Nigeria Nanochemicals Market By Product Type
9.5.2.4.2 Nigeria Nanochemicals Market By Application
9.5.2.5 South Africa
9.5.2.5.1 South Africa Nanochemicals Market By Product Type
9.5.2.5.2 South Africa Nanochemicals Market By Application
9.5.2.6 Rest of Africa
9.5.2.6.1 Rest of Africa Nanochemicals Market By Product Type
9.5.2.6.2 Rest of Africa Nanochemicals Market By Application
9.6 Latin America
9.6.1 Trend Analysis
9.6.2 Latin America Nanochemicals Market by Country
9.6.3 Latin America Nanochemicals Market By Product Type
9.6.4 Latin America Nanochemicals Market By Application
9.6.5 Brazil
9.6.5.1 Brazil Nanochemicals Market By Product Type
9.6.5.2 Brazil Nanochemicals Market By Application
9.6.6 Argentina
9.6.6.1 Argentina Nanochemicals Market By Product Type
9.6.6.2 Argentina Nanochemicals Market By Application
9.6.7 Colombia
9.6.7.1 Colombia Nanochemicals Market By Product Type
9.6.7.2 Colombia Nanochemicals Market By Application
9.6.8 Rest of Latin America
9.6.8.1 Rest of Latin America Nanochemicals Market By Product Type
9.6.8.2 Rest of Latin America Nanochemicals Market By Application
10. Company Profiles
10.1 BASF SE
10.1.1 Company Overview
10.1.2 Financial
10.1.3 Products/ Services Offered
10.1.4 The SNS View
10.2 Dow Chemical Company
10.2.1 Company Overview
10.2.2 Financial
10.2.3 Products/ Services Offered
10.2.4 The SNS View
10.3 AkzoNobel N.V.
10.3.1 Company Overview
10.3.2 Financial
10.3.3 Products/ Services Offered
10.3.4 The SNS View
10.4 DuPont
10.4.1 Company Overview
10.4.2 Financial
10.4.3 Products/ Services Offered
10.4.4 The SNS View
10.5 Evonik Industries AG
10.5.1 Company Overview
10.5.2 Financial
10.5.3 Products/ Services Offered
10.5.4 The SNS View
10.6 PPG Industries Inc.
10.6.1 Company Overview
10.6.2 Financial
10.6.3 Products/ Services Offered
10.6.4 The SNS View
10.7 Huntsman Corporation
10.7.1 Company Overview
10.7.2 Financial
10.7.3 Products/ Services Offered
10.7.4 The SNS View
10.8 Wacker Chemie AG
10.8.1 Company Overview
10.8.2 Financial
10.8.3 Products/ Services Offered
10.8.4 The SNS View
10.9 Arkema Group
10.9.1 Company Overview
10.9.2 Financial
10.9.3 Products/ Services Offered
10.9.4 The SNS View
10.10 Cabot Corporation
10.10.1 Company Overview
10.10.2 Financial
10.10.3 Products/ Services Offered
10.10.4 The SNS View
10.11 Eastman Chemical Company
10.11.1 Company Overview
10.11.2 Financial
10.11.3 Products/ Services Offered
10.11.4 The SNS View
10.12 Clariant AG
10.12.1 Company Overview
10.12.2 Financial
10.12.3 Products/ Services Offered
10.12.4 The SNS View
10.13 Merck Group
10.13.1 Company Overview
10.13.2 Financial
10.13.3 Products/ Services Offered
10.13.4 The SNS View
10.14 Kemira Oyj
10.14.1 Company Overview
10.14.2 Financial
10.14.3 Products/ Services Offered
10.14.4 The SNS View
10.15 Elementis plc
10.15.1 Company Overview
10.15.2 Financial
10.15.3 Products/ Services Offered
10.15.4 The SNS View
10.16 Solvay S.A.
10.16.1 Company Overview
10.16.2 Financial
10.16.3 Products/ Services Offered
10.16.4 The SNS View
10.17 Nanophase Technologies Corporation
10.17.1 Company Overview
10.17.2 Financial
10.17.3 Products/ Services Offered
10.17.4 The SNS View
10.18 Nanoco Group plc
10.18.1 Company Overview
10.18.2 Financial
10.18.3 Products/ Services Offered
10.18.4 The SNS View
10.19 Nanosys, Inc.
10.19.1 Company Overview
10.19.2 Financial
10.19.3 Products/ Services Offered
10.19.4 The SNS View
10.20 NanoMaterials Ltd.
10.20.1 Company Overview
10.20.2 Financial
10.20.3 Products/ Services Offered
10.20.4 The SNS View
11. Competitive Landscape
11.1 Competitive Benchmarking
11.2 Market Share Analysis
11.3 Recent Developments
11.3.1 Industry News
11.3.2 Company News
11.3.3 Mergers & Acquisitions
12. USE Cases and Best Practices
13. Conclusion
An accurate research report requires proper strategizing as well as implementation. There are multiple factors involved in the completion of good and accurate research report and selecting the best methodology to compete the research is the toughest part. Since the research reports we provide play a crucial role in any company’s decision-making process, therefore we at SNS Insider always believe that we should choose the best method which gives us results closer to reality. This allows us to reach at a stage wherein we can provide our clients best and accurate investment to output ratio.
Each report that we prepare takes a timeframe of 350-400 business hours for production. Starting from the selection of titles through a couple of in-depth brain storming session to the final QC process before uploading our titles on our website we dedicate around 350 working hours. The titles are selected based on their current market cap and the foreseen CAGR and growth.
The 5 steps process:
Step 1: Secondary Research:
Secondary Research or Desk Research is as the name suggests is a research process wherein, we collect data through the readily available information. In this process we use various paid and unpaid databases which our team has access to and gather data through the same. This includes examining of listed companies’ annual reports, Journals, SEC filling etc. Apart from this our team has access to various associations across the globe across different industries. Lastly, we have exchange relationships with various university as well as individual libraries.
Step 2: Primary Research
When we talk about primary research, it is a type of study in which the researchers collect relevant data samples directly, rather than relying on previously collected data. This type of research is focused on gaining content specific facts that can be sued to solve specific problems. Since the collected data is fresh and first hand therefore it makes the study more accurate and genuine.
We at SNS Insider have divided Primary Research into 2 parts.
Part 1 wherein we interview the KOLs of major players as well as the upcoming ones across various geographic regions. This allows us to have their view over the market scenario and acts as an important tool to come closer to the accurate market numbers. As many as 45 paid and unpaid primary interviews are taken from both the demand and supply side of the industry to make sure we land at an accurate judgement and analysis of the market.
This step involves the triangulation of data wherein our team analyses the interview transcripts, online survey responses and observation of on filed participants. The below mentioned chart should give a better understanding of the part 1 of the primary interview.
Part 2: In this part of primary research the data collected via secondary research and the part 1 of the primary research is validated with the interviews from individual consultants and subject matter experts.
Consultants are those set of people who have at least 12 years of experience and expertise within the industry whereas Subject Matter Experts are those with at least 15 years of experience behind their back within the same space. The data with the help of two main processes i.e., FGDs (Focused Group Discussions) and IDs (Individual Discussions). This gives us a 3rd party nonbiased primary view of the market scenario making it a more dependable one while collation of the data pointers.
Step 3: Data Bank Validation
Once all the information is collected via primary and secondary sources, we run that information for data validation. At our intelligence centre our research heads track a lot of information related to the market which includes the quarterly reports, the daily stock prices, and other relevant information. Our data bank server gets updated every fortnight and that is how the information which we collected using our primary and secondary information is revalidated in real time.
Step 4: QA/QC Process
After all the data collection and validation our team does a final level of quality check and quality assurance to get rid of any unwanted or undesired mistakes. This might include but not limited to getting rid of the any typos, duplication of numbers or missing of any important information. The people involved in this process include technical content writers, research heads and graphics people. Once this process is completed the title gets uploader on our platform for our clients to read it.
Step 5: Final QC/QA Process:
This is the last process and comes when the client has ordered the study. In this process a final QA/QC is done before the study is emailed to the client. Since we believe in giving our clients a good experience of our research studies, therefore, to make sure that we do not lack at our end in any way humanly possible we do a final round of quality check and then dispatch the study to the client.
Key Segments:
By Product Type
Metal Finishing Chemicals
Electronic Chemicals
Cleaners
Industrial & Specialty Gases
Engineering Plastics
Moulding Powder
Bio-chemicals
Rubber Chemicals
Wet Chemicals
Others
By Application
Pharmaceuticals
Construction Chemicals
Mining Chemicals
Semiconductors & IC Process Chemicals
Pesticides
Rubber Chemicals
Printing Ink
Ceramic Industry
Plastic Additives
Textiles
Water Treatment & Management
Specialty Polymers
Others
Request for Segment Customization as per your Business Requirement: Segment Customization Request
Regional Coverage:
Regional Coverage
North America
US
Canada
Mexico
Europe
Eastern Europe
Poland
Romania
Hungary
Turkey
Rest of Eastern Europe
Western Europe
Germany
France
UK
Italy
Spain
Netherlands
Switzerland
Austria
Rest of Western Europe
Asia Pacific
China
India
Japan
South Korea
Vietnam
Singapore
Australia
Rest of Asia Pacific
Middle East & Africa
Middle East
UAE
Egypt
Saudi Arabia
Qatar
Rest of Middle East
Africa
Nigeria
South Africa
Rest of Africa
Latin America
Brazil
Argentina
Colombia
Rest of Latin America
Request for Country Level Research Report: Country Level Customization Request
Available Customization
With the given market data, SNS Insider offers customization as per the company’s specific needs. The following customization options are available for the report:
Product Analysis
Criss-Cross segment analysis (e.g. Product X Application)
Product Matrix which gives a detailed comparison of product portfolio of each company
Geographic Analysis
Additional countries in any of the regions
Company Information
Detailed analysis and profiling of additional market players (Up to five)
Explore the Green Solvents Market, focusing on eco-friendly solutions for paints, coatings, and chemicals. Learn about key trends in sustainable manufacturing, bio-based solvents, and the growing demand for green alternatives in industries like automotive
Explore the Hydroxyethyl Cellulose (HEC) Market, covering its applications in personal care, paints, and pharmaceuticals. Learn about rising demand for HEC as a thickening and stabilizing agent and its growth in eco-friendly formulations for diverse indus
Explore the Argan Oil Market, focusing on its use in cosmetics, personal care, and food industries. Learn about key trends, rising demand for natural ingredients, and how argan oil's skin, hair, and health benefits are driving its growth in the global mar
The Biosurfactants Market size was USD 4.50 billion in 2023 and is expected to Reach USD 11.38 billion by 2031 and grow at a CAGR of 12.3% over the forecast period of 2024-2031.
The Water Treatment Chemicals Market Size was valued at USD 46.7 billion in 2023, and is expected to reach USD 94.2 billion by 2032, and grow at a CAGR of 8.1% over the forecast period 2024-2032.
The Frankincense Oil Market Size was valued at USD 253.0 Million in 2023 and is expected to reach USD 479.3 Million by 2032 and grow at a CAGR of 7.4% over the forecast period 2024-2032.
Hi! Click one of our member below to chat on Phone