image

Multiple Sclerosis Market Size & Trends:

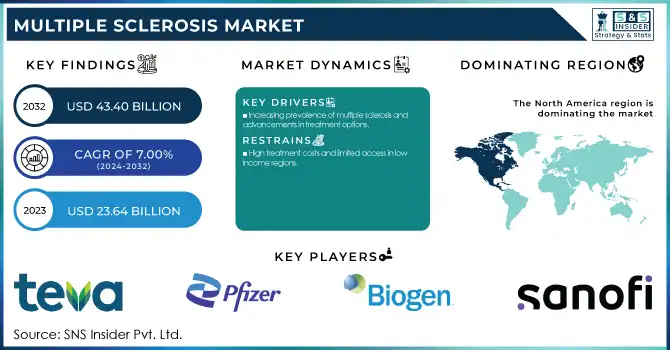
The Multiple Sclerosis Market size was valued at USD 23.64 billion in 2023 and is projected to reach USD 43.40 billion by 2032 and grow at a CAGR of 7.00% over the forecast period of 2024-2032.

This report shows the rising incidence and prevalence of MS, as well as different prescription trends across regions, which are influenced by the changing treatment landscape. The study also looks into healthcare spending on MS treatments, including government, commercial, private, and out-of-pocket expenditures by region. It analyzes current market trends in MS research and drug development, highlighting innovations in therapeutic approaches. The report also elaborates on patient demographics, highlighting the influence of age, gender, and regional factors on disease progression and treatment adherence trends, thus providing a comprehensive view of the market's dynamics.

Multiple Sclerosis Market Revenue Analysis

Get More Information on Multiple Sclerosis Market - Request Free Sample Report

Multiple Sclerosis Market Dynamics

Drivers

  • Increasing prevalence of multiple sclerosis and advancements in treatment options.

One of the primary growth drivers for the MS treatment market is the increasing incidence of multiple sclerosis (MS) globally. With the aging population and greater awareness of the disorder, the need for proper therapeutic management has also increased. Moreover, innovations in drug formulation are further enhancing market growth through the development of newer therapies, such as oral and injectable treatments. The development of targeted therapies such as ocrelizumab (Ocrevus) and the availability of biologics are enhancing treatment outcomes, driving demand from both healthcare providers and patients. Increased investment in research and development by pharmaceutical companies is also a key driver, aiming to address the unmet needs in MS management and improve patient quality of life. With increased awareness of MS as a major health challenge, the government is showing greater support, thus boosting the market growth.

Restraints

  • High treatment costs and limited access in low-income regions.

A primary limitation of MS therapies is that they are relatively expensive, particularly biologics, making access difficult for many patients, especially in poorer parts of the world. Cost can be a big barrier for patients with long-term treatment for many people, particularly in the undeveloped world. Another issue is the side effects and complexities of certain drugs, which could discourage a patient from taking their prescribed treatments. Further regulatory issues and delays in the approval of new treatments also challenge the companies to launch innovative therapies across the globe. It may hold back overall market growth.

Opportunities

  • Expanding market in emerging economies and advancements in personalized medicine.

The MS treatment market offers several opportunities, especially in emerging economies where the healthcare infrastructure is rapidly improving. As countries like India, China, and Brazil continue to enhance their healthcare systems, the demand for MS treatments is expected to rise significantly. Moreover, the development of personalized medicine tailored to individual genetic profiles offers significant potential. Tailored treatments will have more effectiveness and fewer side effects, and thus can lead to increased adherence and patient satisfaction. This new trend toward precision medicine can become a promising avenue for the pharmaceutical industry in expanding its products and entering new markets.

Challenges

  • Drug Side Effects, Complexity of Diagnosis, and Treatment Adherence.

Some of the major challenges in the MS treatment market are side effects that accompany most MS drugs, especially biologics, which lead to adverse reactions and poor patient adherence to the prescribed treatment regimen. The complexity of diagnosing MS, whose symptoms often overlap with other neurological disorders, may also delay treatment and hinder timely intervention. In addition, though new treatments have significantly improved the prognosis of many patients, treatment compliance is still a major challenge, as some therapies require frequent monitoring, injections, or infusions. These issues can complicate the management of MS, affecting long-term treatment success and overall market growth.

Multiple Sclerosis Market Segmentation Insights

By Drug Class

In 2023, the immunosuppressants segment held the largest market share of 63.9%. This can be attributed to the widespread use of immunosuppressive drugs in various medical conditions such as autoimmune diseases, organ transplantations, and cancer treatments. These drugs play a crucial role in preventing organ rejection and managing conditions that involve excessive immune response, thus leading to their high market share. Owing to the continued rising prevalence of such health disorders, the market for immunosuppressants is likely to be dominated once again by its immunosuppressants segment.

The immunostimulants segment is expected to grow the fastest throughout the forecast period. Growing demand for boosting immunity in the body in cases where immunity is weakened, along with increasing awareness of their role in not only preventing infections but also their overall well-being, is directly helping in this growth. Second, growing interest in preventive healthcare and new therapy related to immunostimulation will help drive the growth of this segment.

By Route of Administration

The injectable segment dominated the route of administration category in 2023 with a share of 54.5%. This is mainly because injectables provide a more direct and faster method of delivering medications as compared to oral forms. In particular, patients requiring immediate relief are favored with the drug administered through an injectable. The injectables also find their major use through drugs that cannot be taken orally. This method also gives more accurate dosing and high bioavailability of some drugs. This makes it the first choice in many therapeutic areas.

The oral administration segment will grow the fastest rate. This will be driven by the convenience, ease of use, and cost-effectiveness offered by oral medications, making them very attractive for long-term treatments. Increased biologics and complex molecules' formulations are further being developed for oral usage, further creating a growth prospect in this segment.

By Distribution Channel

The hospital pharmacies segment led the distribution channel category in 2023, with a share of 47.5%. Hospital pharmacies are one of the biggest shares of pharmaceutical sales, as most treatments are administered in hospitals and clinics to patients suffering from acute or complex conditions. Hospital pharmacies also handle the distribution of specialty drugs, such as injectables and immunosuppressants, which are prescribed more frequently in clinical settings. The trust and convenience associated with hospital pharmacies make them the most preferred in the market.

The retail pharmacies segment will also be expected to grow at the fastest pace of all distribution channels. Such growth is also triggered by growing numbers of people turning to over-the-counter medication, as well as the extension of retail pharmacies and their more significant offerings in the pharmaceutical segment. In addition, the rapid spread of electronic prescriptions and more affordable healthcare services for chronic illnesses is likely to help the retail pharmacy segment soar even higher.

Multiple Sclerosis Market Regional Analysis

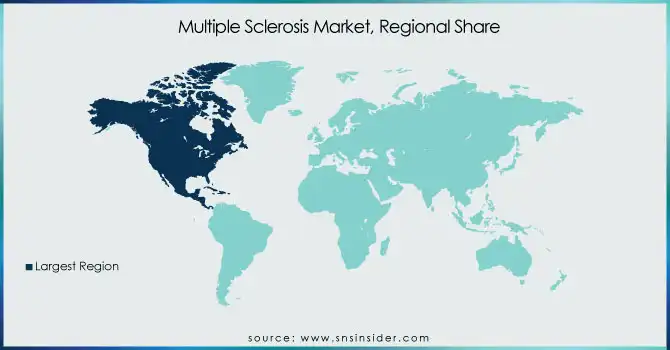
In 2023, North America dominated the market, mainly attributed to its more advanced healthcare infrastructure, high rate of adoption of innovative therapies, and the continuously increasing prevalence of chronic diseases, which require the treatment of treatments such as immunosuppressants and injectable medications. The presence of major pharmaceutical companies and robust healthcare policies has further contributed to the region's market leadership.

Europe closely followed, as there was a high demand for immunosuppressive and immunostimulatory drugs in countries having aging populations such as Germany and the UK. The health systems in Europe have been evolving; hence, people are accessing highly advanced treatments more than ever before.

The Asia-Pacific region is expected to be the fastest-growing region throughout the forecast period, with growing healthcare expenditure, improvement in health infrastructure, and enormous and swelling populations. Prescription demand is rising steeply in countries such as China and India injectable as well as oral drugs, driven by increased awareness about healthcare and healthcare amenities. This region also witnesses a spree in the sale of pharmaceutical products through e-commerce sites.

Multiple-Sclerosis-Market-Regional-Share

Need any customization research on Multiple Sclerosis Market - Enquiry Now

Multiple Sclerosis Market Key Players

  • Teva Pharmaceutical Industries Ltd. - Copaxone, Austedo

  • Pfizer Inc. - Braftovi, Mylotarg

  • Biogen - Tecfidera, Avonex, Tysabri

  • Bayer AG - Betaseron, Cladribine

  • Sanofi - Aubagio, Lemtrada

  • F. Hoffmann-La Roche Ltd. - Ocrevus, Rituxan

  • Johnson & Johnson Services, Inc. - Gilenya

  • Merck & Co., Inc. - Rebif, Mavenclad

  • Takeda Pharmaceutical Company Limited - Entyvio

  • Horizon Therapeutics plc - Krystexxa

Recent Developments:

  • In Nov 2024, the National Multiple Sclerosis Society has awarded USD 1 million to researchers at Case Western Reserve University to explore a new approach for treating Multiple Sclerosis. This funding highlights ongoing efforts to advance treatment options and enhance the understanding of the disease.

  • In July 2024, the Medicines and Healthcare Products Regulatory Agency approved a new formulation of ocrelizumab (Ocrevus 920mg solution for injection) for the treatment of relapsing forms of multiple sclerosis and primary progressive multiple sclerosis in adults. This approval marks a significant development in the treatment options for multiple sclerosis.

Multiple Sclerosis Market Report Scope:

Report Attributes Details

Market Size in 2023

USD 23.64 billion   

Market Size by 2032

USD 43.40 billion 

CAGR

CAGR of 7% From 2024 to 2032

Base Year

2023

Forecast Period

2024-2032

Historical Data

2020-2022

Report Scope & Coverage

Market Size, Segments Analysis, Competitive  Landscape, Regional Analysis, DROC & SWOT Analysis, Forecast Outlook

Key Segments

• By Drug Class [Immunosuppressants, Immunostimulants]
• By Route of Administration [Oral, Injectable, Others]
• By Distribution Channel [Hospital Pharmacies, Retail Pharmacies, E-Commerce]

Regional Analysis/Coverage

North America (US, Canada, Mexico), Europe (Eastern Europe [Poland, Romania, Hungary, Turkey, Rest of Eastern Europe] Western Europe] Germany, France, UK, Italy, Spain, Netherlands, Switzerland, Austria, Rest of Western Europe]), Asia Pacific (China, India, Japan, South Korea, Vietnam, Singapore, Australia, Rest of Asia Pacific), Middle East & Africa (Middle East [UAE, Egypt, Saudi Arabia, Qatar, Rest of Middle East], Africa [Nigeria, South Africa, Rest of Africa], Latin America (Brazil, Argentina, Colombia, Rest of Latin America)

Company Profiles

Teva Pharmaceutical Industries Ltd., Pfizer Inc., Biogen, Bayer AG, Sanofi, F. Hoffmann-La Roche Ltd., Johnson & Johnson Services, Inc., Merck & Co., Inc., Takeda Pharmaceutical Company Limited, Horizon Therapeutics plc.

Frequently Asked Questions

Ans: The Multiple Sclerosis (MS) market is projected to grow at a CAGR of 7% during the forecast period.

Ans: By 2032, the Multiple Sclerosis (MS) market is expected to reach USD 43.40 billion, up from USD 23.64 billion in 2023.

Ans: Increasing Prevalence of Multiple Sclerosis and Advancements in Treatment Options.

Ans: A primary limitation of MS therapies is that they are relatively expensive, particularly biologics, making access difficult for many patients, especially in poorer parts of the world.

Ans: North America is the dominant region in the Multiple Sclerosis (MS) market.

Table Of Contents:

1. Introduction

1.1 Market Definition

1.2 Scope (Inclusion and Exclusions)

1.3 Research & Academic Institutes Assumptions

2. Executive Summary

2.1 Market Overview

2.2 Regional Synopsis

2.3 Competitive Summary

3. Research & Academic Institutes Methodology

3.1 Top-Down Approach

3.2 Bottom-up Approach

3.3. Data Validation

3.4 Primary Interviews

4. Market Dynamics Impact Analysis

4.1 Market Driving Factors Analysis

4.1.1 Drivers

4.1.2 Restraints

4.1.3 Opportunities

4.1.4 Challenges

4.2 PESTLE Analysis

4.3 Porter’s Five Forces Model

5. Statistical Insights and Trends Reporting

5.1 Incidence and Prevalence (2023)

5.2 Prescription Trends (2023), by Region

5.3 Healthcare Spending on Multiple Sclerosis, by Region (Government, Commercial, Private, Out-of-Pocket), 2023

5.4 Trends in MS Research & Drug Development

5.5 Patient Demographics and Treatment Adherence Trends

6. Competitive Landscape

6.1 List of Major Companies, By Region

6.2 Market Share Analysis, By Region

6.3 Product Benchmarking

6.3.1 Product specifications and features

6.3.2 Pricing

6.4 Strategic Initiatives

6.4.1 Marketing and Promotional Activities

6.4.2 Distribution and Supply Chain Strategies

6.4.3 Expansion plans and new Product launches

6.4.4 Strategic partnerships and collaborations

6.5 Technological Advancements

6.6 Market Positioning and Branding

7. Multiple Sclerosis (MS) Market Segmentation, by Drug Class
7.1 Chapter Overview

7.2 Immunosuppressants

7.2.1 Immunosuppressants Market Trends Analysis (2020-2032)

7.2.2 Immunosuppressants Market Size Estimates and Forecasts to 2032 (USD Billion)

7.3 Immunostimulants

7.3.1 Immunostimulants Market Trends Analysis (2020-2032)

7.3.2 Immunostimulants Market Size Estimates and Forecasts to 2032 (USD Billion)

8. Multiple Sclerosis (MS) Market Segmentation, by Route of Administration     

   8.1 Chapter Overview

   8.2 Oral

              8.2.1 Oral Market Trends Analysis (2020-2032)

8.2.2 Oral Market Size Estimates and Forecasts to 2032 (USD Billion)

    8.3 Injectable

              8.3.1 Injectable Market Trends Analysis (2020-2032)

              8.3.2 Injectable Market Size Estimates and Forecasts to 2032 (USD Billion)

   8.4 Others

              8.4.1 Others Market Trends Analysis (2020-2032)

              8.4.2 Others Market Size Estimates and Forecasts to 2032 (USD Billion)

9. Multiple Sclerosis (MS) Market Segmentation, by Distribution Channel

9.1 Chapter Overview

      9.2 Hospital Pharmacies

             9.2.1 Hospital Pharmacies Market Trends Analysis (2020-2032)

9.2.2 Hospital Pharmacies Market Size Estimates and Forecasts to 2032 (USD Billion)

      9.3 Retail Pharmacies

             9.3.1 Retail Pharmacies Market Trends Analysis (2020-2032)

             9.3.2 Retail Pharmacies Market Size Estimates and Forecasts to 2032 (USD Billion)

      9.4 E-Commerce

             9.4.1 E-Commerce Market Trends Analysis (2020-2032)

             9.4.2 E-Commerce Market Size Estimates and Forecasts to 2032 (USD Billion)

10. Regional Analysis

10.1 Chapter Overview

10.2 North America

10.2.1 Trends Analysis

10.2.2 North America Multiple Sclerosis (MS) Market Estimates and Forecasts, by Country (2020-2032) (USD Billion)

10.2.3 North America Multiple Sclerosis (MS) Market Estimates and Forecasts, by Drug Class (2020-2032) (USD Billion)  

10.2.4 North America Multiple Sclerosis (MS) Market Estimates and Forecasts, by Route of Administration (2020-2032) (USD Billion)

10.2.5 North America Multiple Sclerosis (MS) Market Estimates and Forecasts, by Distribution Channel (2020-2032) (USD Billion)

10.2.6 USA

10.2.6.1 USA Multiple Sclerosis (MS) Market Estimates and Forecasts, by Drug Class (2020-2032) (USD Billion)

10.2.6.2 USA Multiple Sclerosis (MS) Market Estimates and Forecasts, by Route of Administration (2020-2032) (USD Billion)

10.2.6.3 USA Multiple Sclerosis (MS) Market Estimates and Forecasts, by Distribution Channel (2020-2032) (USD Billion)

10.2.7 Canada

10.2.7.1 Canada Multiple Sclerosis (MS) Market Estimates and Forecasts, by Drug Class (2020-2032) (USD Billion)

10.2.7.2 Canada Multiple Sclerosis (MS) Market Estimates and Forecasts, by Route of Administration (2020-2032) (USD Billion)

10.2.7.3 Canada Multiple Sclerosis (MS) Market Estimates and Forecasts, by Distribution Channel (2020-2032) (USD Billion)

10.2.8 Mexico

10.2.8.1 Mexico Multiple Sclerosis (MS) Market Estimates and Forecasts, by Drug Class (2020-2032) (USD Billion)

10.2.8.2 Mexico Multiple Sclerosis (MS) Market Estimates and Forecasts, by Route of Administration (2020-2032) (USD Billion)

10.2.8.3 Mexico Multiple Sclerosis (MS) Market Estimates and Forecasts, by Distribution Channel (2020-2032) (USD Billion)

10.3 Europe

10.3.1 Eastern Europe

10.3.1.1 Trends Analysis

10.3.1.2 Eastern Europe Multiple Sclerosis (MS) Market Estimates and Forecasts, by Country (2020-2032) (USD Billion)

10.3.1.3 Eastern Europe Multiple Sclerosis (MS) Market Estimates and Forecasts, by Drug Class (2020-2032) (USD Billion)  

10.3.1.4 Eastern Europe Multiple Sclerosis (MS) Market Estimates and Forecasts, by Route of Administration (2020-2032) (USD Billion)

10.3.1.5 Eastern Europe Multiple Sclerosis (MS) Market Estimates and Forecasts, by Distribution Channel (2020-2032) (USD Billion)

10.3.1.6 Poland

10.3.1.6.1 Poland Multiple Sclerosis (MS) Market Estimates and Forecasts, by Drug Class (2020-2032) (USD Billion)

10.3.1.6.2 Poland Multiple Sclerosis (MS) Market Estimates and Forecasts, by Route of Administration (2020-2032) (USD Billion)

10.3.1.6.3 Poland Multiple Sclerosis (MS) Market Estimates and Forecasts, by Distribution Channel (2020-2032) (USD Billion)

10.3.1.7 Romania

10.3.1.7.1 Romania Multiple Sclerosis (MS) Market Estimates and Forecasts, by Drug Class (2020-2032) (USD Billion)

10.3.1.7.2 Romania Multiple Sclerosis (MS) Market Estimates and Forecasts, by Route of Administration (2020-2032) (USD Billion)

10.3.1.7.3 Romania Multiple Sclerosis (MS) Market Estimates and Forecasts, by Distribution Channel (2020-2032) (USD Billion)

10.3.1.8 Hungary

10.3.1.8.1 Hungary Multiple Sclerosis (MS) Market Estimates and Forecasts, by Drug Class (2020-2032) (USD Billion)

10.3.1.8.2 Hungary Multiple Sclerosis (MS) Market Estimates and Forecasts, by Route of Administration (2020-2032) (USD Billion)

10.3.1.8.3 Hungary Multiple Sclerosis (MS) Market Estimates and Forecasts, by Distribution Channel (2020-2032) (USD Billion)

10.3.1.9 turkey

10.3.1.9.1 Turkey Multiple Sclerosis (MS) Market Estimates and Forecasts, by Drug Class (2020-2032) (USD Billion)

10.3.1.9.2 Turkey Multiple Sclerosis (MS) Market Estimates and Forecasts, by Route of Administration (2020-2032) (USD Billion)

10.3.1.9.3 Turkey Multiple Sclerosis (MS) Market Estimates and Forecasts, by Distribution Channel (2020-2032) (USD Billion)

10.3.1.10 Rest of Eastern Europe

10.3.1.10.1 Rest of Eastern Europe Multiple Sclerosis (MS) Market Estimates and Forecasts, by Drug Class (2020-2032) (USD Billion)

10.3.1.10.2 Rest of Eastern Europe Multiple Sclerosis (MS) Market Estimates and Forecasts, by Route of Administration (2020-2032) (USD Billion)

10.3.1.10.3 Rest of Eastern Europe Multiple Sclerosis (MS) Market Estimates and Forecasts, by Distribution Channel (2020-2032) (USD Billion)

10.3.2 Western Europe

10.3.2.1 Trends Analysis

10.3.2.2 Western Europe Multiple Sclerosis (MS) Market Estimates and Forecasts, by Country (2020-2032) (USD Billion)

10.3.2.3 Western Europe Multiple Sclerosis (MS) Market Estimates and Forecasts, by Drug Class (2020-2032) (USD Billion)  

10.3.2.4 Western Europe Multiple Sclerosis (MS) Market Estimates and Forecasts, by Route of Administration (2020-2032) (USD Billion)

10.3.2.5 Western Europe Multiple Sclerosis (MS) Market Estimates and Forecasts, by Distribution Channel (2020-2032) (USD Billion)

10.3.2.6 Germany

10.3.2.6.1 Germany Multiple Sclerosis (MS) Market Estimates and Forecasts, by Drug Class (2020-2032) (USD Billion)

10.3.2.6.2 Germany Multiple Sclerosis (MS) Market Estimates and Forecasts, by Route of Administration (2020-2032) (USD Billion)

10.3.2.6.3 Germany Multiple Sclerosis (MS) Market Estimates and Forecasts, by Distribution Channel (2020-2032) (USD Billion)

10.3.2.7 France

10.3.2.7.1 France Multiple Sclerosis (MS) Market Estimates and Forecasts, by Drug Class (2020-2032) (USD Billion)

10.3.2.7.2 France Multiple Sclerosis (MS) Market Estimates and Forecasts, by Route of Administration (2020-2032) (USD Billion)

10.3.2.7.3 France Multiple Sclerosis (MS) Market Estimates and Forecasts, by Distribution Channel (2020-2032) (USD Billion)

10.3.2.8 UK

10.3.2.8.1 UK Multiple Sclerosis (MS) Market Estimates and Forecasts, by Drug Class (2020-2032) (USD Billion)

10.3.2.8.2 UK Multiple Sclerosis (MS) Market Estimates and Forecasts, by Route of Administration (2020-2032) (USD Billion)

10.3.2.8.3 UK Multiple Sclerosis (MS) Market Estimates and Forecasts, by Distribution Channel (2020-2032) (USD Billion)

10.3.2.9 Italy

10.3.2.9.1 Italy Multiple Sclerosis (MS) Market Estimates and Forecasts, by Drug Class (2020-2032) (USD Billion)

10.3.2.9.2 Italy Multiple Sclerosis (MS) Market Estimates and Forecasts, by Route of Administration (2020-2032) (USD Billion)

10.3.2.9.3 Italy Multiple Sclerosis (MS) Market Estimates and Forecasts, by Distribution Channel (2020-2032) (USD Billion)

10.3.2.10 Spain

10.3.2.10.1 Spain Multiple Sclerosis (MS) Market Estimates and Forecasts, by Drug Class (2020-2032) (USD Billion)

10.3.2.10.2 Spain Multiple Sclerosis (MS) Market Estimates and Forecasts, by Route of Administration (2020-2032) (USD Billion)

10.3.2.10.3 Spain Multiple Sclerosis (MS) Market Estimates and Forecasts, by Distribution Channel (2020-2032) (USD Billion)

10.3.2.11 Netherlands

10.3.2.11.1 Netherlands Multiple Sclerosis (MS) Market Estimates and Forecasts, by Drug Class (2020-2032) (USD Billion)

10.3.2.11.2 Netherlands Multiple Sclerosis (MS) Market Estimates and Forecasts, by Route of Administration (2020-2032) (USD Billion)

10.3.2.11.3 Netherlands Multiple Sclerosis (MS) Market Estimates and Forecasts, by Distribution Channel (2020-2032) (USD Billion)

10.3.2.12 Switzerland

10.3.2.12.1 Switzerland Multiple Sclerosis (MS) Market Estimates and Forecasts, by Drug Class (2020-2032) (USD Billion)

10.3.2.12.2 Switzerland Multiple Sclerosis (MS) Market Estimates and Forecasts, by Route of Administration (2020-2032) (USD Billion)

10.3.2.12.3 Switzerland Multiple Sclerosis (MS) Market Estimates and Forecasts, by Distribution Channel (2020-2032) (USD Billion)

10.3.2.13 Austria

10.3.2.13.1 Austria Multiple Sclerosis (MS) Market Estimates and Forecasts, by Drug Class (2020-2032) (USD Billion)

10.3.2.13.2 Austria Multiple Sclerosis (MS) Market Estimates and Forecasts, by Route of Administration (2020-2032) (USD Billion)

10.3.2.13.3 Austria Multiple Sclerosis (MS) Market Estimates and Forecasts, by Distribution Channel (2020-2032) (USD Billion)

10.3.2.14 Rest of Western Europe

10.3.2.14.1 Rest of Western Europe Multiple Sclerosis (MS) Market Estimates and Forecasts, by Drug Class (2020-2032) (USD Billion)

10.3.2.14.2 Rest of Western Europe Multiple Sclerosis (MS) Market Estimates and Forecasts, by Route of Administration (2020-2032) (USD Billion)

10.3.2.14.3 Rest of Western Europe Multiple Sclerosis (MS) Market Estimates and Forecasts, by Distribution Channel (2020-2032) (USD Billion)

10.4 Asia Pacific

10.4.1 Trends Analysis

10.4.2 Asia Pacific Multiple Sclerosis (MS) Market Estimates and Forecasts, by Country (2020-2032) (USD Billion)

10.4.3 Asia Pacific Multiple Sclerosis (MS) Market Estimates and Forecasts, by Drug Class (2020-2032) (USD Billion)  

10.4.4 Asia Pacific Multiple Sclerosis (MS) Market Estimates and Forecasts, by Route of Administration (2020-2032) (USD Billion)

10.4.5 Asia Pacific Multiple Sclerosis (MS) Market Estimates and Forecasts, by Distribution Channel (2020-2032) (USD Billion)

10.4.6 China

10.4.6.1 China Multiple Sclerosis (MS) Market Estimates and Forecasts, by Drug Class (2020-2032) (USD Billion)

10.4.6.2 China Multiple Sclerosis (MS) Market Estimates and Forecasts, by Route of Administration (2020-2032) (USD Billion)

10.4.6.3 China Multiple Sclerosis (MS) Market Estimates and Forecasts, by Distribution Channel (2020-2032) (USD Billion)

10.4.7 India

10.4.7.1 India Multiple Sclerosis (MS) Market Estimates and Forecasts, by Drug Class (2020-2032) (USD Billion)

10.4.7.2 India Multiple Sclerosis (MS) Market Estimates and Forecasts, by Route of Administration (2020-2032) (USD Billion)

10.4.7.3 India Multiple Sclerosis (MS) Market Estimates and Forecasts, by Distribution Channel (2020-2032) (USD Billion)

10.4.8 Japan

10.4.8.1 Japan Multiple Sclerosis (MS) Market Estimates and Forecasts, by Drug Class (2020-2032) (USD Billion)

10.4.8.2 Japan Multiple Sclerosis (MS) Market Estimates and Forecasts, by Route of Administration (2020-2032) (USD Billion)

10.4.8.3 Japan Multiple Sclerosis (MS) Market Estimates and Forecasts, by Distribution Channel (2020-2032) (USD Billion)

10.4.9 South Korea

10.4.9.1 South Korea Multiple Sclerosis (MS) Market Estimates and Forecasts, by Drug Class (2020-2032) (USD Billion)

10.4.9.2 South Korea Multiple Sclerosis (MS) Market Estimates and Forecasts, by Route of Administration (2020-2032) (USD Billion)

10.4.9.3 South Korea Multiple Sclerosis (MS) Market Estimates and Forecasts, by Distribution Channel (2020-2032) (USD Billion)

10.4.10 Vietnam

10.4.10.1 Vietnam Multiple Sclerosis (MS) Market Estimates and Forecasts, by Drug Class (2020-2032) (USD Billion)

10.4.10.2 Vietnam Multiple Sclerosis (MS) Market Estimates and Forecasts, by Route of Administration (2020-2032) (USD Billion)

10.4.10.3 Vietnam Multiple Sclerosis (MS) Market Estimates and Forecasts, by Distribution Channel (2020-2032) (USD Billion)

10.4.11 Singapore

10.4.11.1 Singapore Multiple Sclerosis (MS) Market Estimates and Forecasts, by Drug Class (2020-2032) (USD Billion)

10.4.11.2 Singapore Multiple Sclerosis (MS) Market Estimates and Forecasts, by Route of Administration (2020-2032) (USD Billion)

10.4.11.3 Singapore Multiple Sclerosis (MS) Market Estimates and Forecasts, by Distribution Channel (2020-2032) (USD Billion)

10.4.12 Australia

10.4.12.1 Australia Multiple Sclerosis (MS) Market Estimates and Forecasts, by Drug Class (2020-2032) (USD Billion)

10.4.12.2 Australia Multiple Sclerosis (MS) Market Estimates and Forecasts, by Route of Administration (2020-2032) (USD Billion)

10.4.12.3 Australia Multiple Sclerosis (MS) Market Estimates and Forecasts, by Distribution Channel (2020-2032) (USD Billion)

10.4.13 Rest of Asia Pacific

10.4.13.1 Rest of Asia Pacific Multiple Sclerosis (MS) Market Estimates and Forecasts, by Drug Class (2020-2032) (USD Billion)

10.4.13.2 Rest of Asia Pacific Multiple Sclerosis (MS) Market Estimates and Forecasts, by Route of Administration (2020-2032) (USD Billion)

10.4.13.3 Rest of Asia Pacific Multiple Sclerosis (MS) Market Estimates and Forecasts, by Distribution Channel (2020-2032) (USD Billion)

10.5 Middle East and Africa

10.5.1 Middle East

10.5.1.1 Trends Analysis

10.5.1.2 Middle East Multiple Sclerosis (MS) Market Estimates and Forecasts, by Country (2020-2032) (USD Billion)

10.5.1.3 Middle East Multiple Sclerosis (MS) Market Estimates and Forecasts, by Drug Class (2020-2032) (USD Billion)  

10.5.1.4 Middle East Multiple Sclerosis (MS) Market Estimates and Forecasts, by Route of Administration (2020-2032) (USD Billion)

10.5.1.5 Middle East Multiple Sclerosis (MS) Market Estimates and Forecasts, by Distribution Channel (2020-2032) (USD Billion)

10.5.1.6 UAE

10.5.1.6.1 UAE Multiple Sclerosis (MS) Market Estimates and Forecasts, by Drug Class (2020-2032) (USD Billion)

10.5.1.6.2 UAE Multiple Sclerosis (MS) Market Estimates and Forecasts, by Route of Administration (2020-2032) (USD Billion)

10.5.1.6.3 UAE Multiple Sclerosis (MS) Market Estimates and Forecasts, by Distribution Channel (2020-2032) (USD Billion)

10.5.1.7 Egypt

10.5.1.7.1 Egypt Multiple Sclerosis (MS) Market Estimates and Forecasts, by Drug Class (2020-2032) (USD Billion)

10.5.1.7.2 Egypt Multiple Sclerosis (MS) Market Estimates and Forecasts, by Route of Administration (2020-2032) (USD Billion)

10.5.1.7.3 Egypt Multiple Sclerosis (MS) Market Estimates and Forecasts, by Distribution Channel (2020-2032) (USD Billion)

10.5.1.8 Saudi Arabia

10.5.1.8.1 Saudi Arabia Multiple Sclerosis (MS) Market Estimates and Forecasts, by Drug Class (2020-2032) (USD Billion)

10.5.1.8.2 Saudi Arabia Multiple Sclerosis (MS) Market Estimates and Forecasts, by Route of Administration (2020-2032) (USD Billion)

10.5.1.8.3 Saudi Arabia Multiple Sclerosis (MS) Market Estimates and Forecasts, by Distribution Channel (2020-2032) (USD Billion)

10.5.1.9 Qatar

10.5.1.9.1 Qatar Multiple Sclerosis (MS) Market Estimates and Forecasts, by Drug Class (2020-2032) (USD Billion)

10.5.1.9.2 Qatar Multiple Sclerosis (MS) Market Estimates and Forecasts, by Route of Administration (2020-2032) (USD Billion)

10.5.1.9.3 Qatar Multiple Sclerosis (MS) Market Estimates and Forecasts, by Distribution Channel (2020-2032) (USD Billion)

10.5.1.10 Rest of Middle East

10.5.1.10.1 Rest of Middle East Multiple Sclerosis (MS) Market Estimates and Forecasts, by Drug Class (2020-2032) (USD Billion)

10.5.1.10.2 Rest of Middle East Multiple Sclerosis (MS) Market Estimates and Forecasts, by Route of Administration (2020-2032) (USD Billion)

10.5.1.10.3 Rest of Middle East Multiple Sclerosis (MS) Market Estimates and Forecasts, by Distribution Channel (2020-2032) (USD Billion)

10.5.2 Africa

10.5.2.1 Trends Analysis

10.5.2.2 Africa Multiple Sclerosis (MS) Market Estimates and Forecasts, by Country (2020-2032) (USD Billion)

10.5.2.3 Africa Multiple Sclerosis (MS) Market Estimates and Forecasts, by Drug Class (2020-2032) (USD Billion)  

10.5.2.4 Africa Multiple Sclerosis (MS) Market Estimates and Forecasts, by Route of Administration (2020-2032) (USD Billion)

10.5.2.5 Africa Multiple Sclerosis (MS) Market Estimates and Forecasts, by Distribution Channel (2020-2032) (USD Billion)

10.5.2.6 South Africa

10.5.2.6.1 South Africa Multiple Sclerosis (MS) Market Estimates and Forecasts, by Drug Class (2020-2032) (USD Billion)

10.5.2.6.2 South Africa Multiple Sclerosis (MS) Market Estimates and Forecasts, by Route of Administration (2020-2032) (USD Billion)

10.5.2.6.3 South Africa Multiple Sclerosis (MS) Market Estimates and Forecasts, by Distribution Channel (2020-2032) (USD Billion)

10.5.2.7 Nigeria

10.5.2.7.1 Nigeria Multiple Sclerosis (MS) Market Estimates and Forecasts, by Drug Class (2020-2032) (USD Billion)

10.5.2.7.2 Nigeria Multiple Sclerosis (MS) Market Estimates and Forecasts, by Route of Administration (2020-2032) (USD Billion)

10.5.2.7.3 Nigeria Multiple Sclerosis (MS) Market Estimates and Forecasts, by Distribution Channel (2020-2032) (USD Billion)

10.5.2.8 Rest of Africa

10.5.2.8.1 Rest of Africa Multiple Sclerosis (MS) Market Estimates and Forecasts, by Drug Class (2020-2032) (USD Billion)

10.5.2.8.2 Rest of Africa Multiple Sclerosis (MS) Market Estimates and Forecasts, by Route of Administration (2020-2032) (USD Billion)

10.5.2.8.3 Rest of Africa Multiple Sclerosis (MS) Market Estimates and Forecasts, by Distribution Channel (2020-2032) (USD Billion)

10.6 Latin America

10.6.1 Trends Analysis

10.6.2 Latin America Multiple Sclerosis (MS) Market Estimates and Forecasts, by Country (2020-2032) (USD Billion)

10.6.3 Latin America Multiple Sclerosis (MS) Market Estimates and Forecasts, by Drug Class (2020-2032) (USD Billion)  

10.6.4 Latin America Multiple Sclerosis (MS) Market Estimates and Forecasts, by Route of Administration (2020-2032) (USD Billion)

10.6.5 Latin America Multiple Sclerosis (MS) Market Estimates and Forecasts, by Distribution Channel (2020-2032) (USD Billion)

10.6.6 Brazil

10.6.6.1 Brazil Multiple Sclerosis (MS) Market Estimates and Forecasts, by Drug Class (2020-2032) (USD Billion)

10.6.6.2 Brazil Multiple Sclerosis (MS) Market Estimates and Forecasts, by Route of Administration (2020-2032) (USD Billion)

10.6.6.3 Brazil Multiple Sclerosis (MS) Market Estimates and Forecasts, by Distribution Channel (2020-2032) (USD Billion)

10.6.7 Argentina

10.6.7.1 Argentina Multiple Sclerosis (MS) Market Estimates and Forecasts, by Drug Class (2020-2032) (USD Billion)

10.6.7.2 Argentina Multiple Sclerosis (MS) Market Estimates and Forecasts, by Route of Administration (2020-2032) (USD Billion)

10.6.7.3 Argentina Multiple Sclerosis (MS) Market Estimates and Forecasts, by Distribution Channel (2020-2032) (USD Billion)

10.6.8 Colombia

10.6.8.1 Colombia Multiple Sclerosis (MS) Market Estimates and Forecasts, by Drug Class (2020-2032) (USD Billion)

10.6.8.2 Colombia Multiple Sclerosis (MS) Market Estimates and Forecasts, by Route of Administration (2020-2032) (USD Billion)

10.6.8.3 Colombia Multiple Sclerosis (MS) Market Estimates and Forecasts, by Distribution Channel (2020-2032) (USD Billion)

10.6.9 Rest of Latin America

10.6.9.1 Rest of Latin America Multiple Sclerosis (MS) Market Estimates and Forecasts, by Drug Class (2020-2032) (USD Billion)

10.6.9.2 Rest of Latin America Multiple Sclerosis (MS) Market Estimates and Forecasts, by Route of Administration (2020-2032) (USD Billion)

10.6.9.3 Rest of Latin America Multiple Sclerosis (MS) Market Estimates and Forecasts, by Distribution Channel (2020-2032) (USD Billion)

11. Company Profiles

11.1 Teva Pharmaceutical Industries Ltd.

11.1.1 Company Overview

11.1.2 Financial

11.1.3 Product / Services Offered

11.1.4 SWOT Analysis

11.2 Pfizer Inc.

11.2.1 Company Overview

11.2.2 Financial

11.2.3 Product / Services Offered

11.2.4 SWOT Analysis

11.3 Biogen

11.3.1 Company Overview

11.3.2 Financial

11.3.3 Product / Services Offered

11.3.4 SWOT Analysis

11.4 Bayer AG

11.4.1 Company Overview

11.4.2 Financial

11.4.3 Product / Services Offered

11.4.4 SWOT Analysis

11.5 Sanofi

11.5.1 Company Overview

11.5.2 Financial

11.5.3 Product / Services Offered

11.5.4 SWOT Analysis

11.6 F. Hoffmann-La Roche Ltd.

             11.6.1 Company Overview

11.6.2 Financial

11.6.3 Product / Services Offered

11.6.4 SWOT Analysis

11.7 Johnson & Johnson Services, Inc.

11.7.1 Company Overview

11.7.2 Financial

11.7.3 Product / Services Offered

11.7.4 SWOT Analysis

11.8 Merck & Co., Inc.

11.8.1 Company Overview

11.8.2 Financial

11.8.3 Product / Services Offered

11.8.4 SWOT Analysis

11.9 Takeda Pharmaceutical Company Limited

11.9.1 Company Overview

11.9.2 Financial

11.9.3 Product / Services Offered

11.9.4 SWOT Analysis

11.10 Horizon Therapeutics plc

11.10.1 Company Overview

11.10.2 Financial

11.10.3 Product / Services Offered

11.10.4 SWOT Analysis

12. Use Cases and Best Practices

13. Conclusion

An accurate research report requires proper strategizing as well as implementation. There are multiple factors involved in the completion of good and accurate research report and selecting the best methodology to compete the research is the toughest part. Since the research reports we provide play a crucial role in any company’s decision-making process, therefore we at SNS Insider always believe that we should choose the best method which gives us results closer to reality. This allows us to reach at a stage wherein we can provide our clients best and accurate investment to output ratio.

Each report that we prepare takes a timeframe of 350-400 business hours for production. Starting from the selection of titles through a couple of in-depth brain storming session to the final QC process before uploading our titles on our website we dedicate around 350 working hours. The titles are selected based on their current market cap and the foreseen CAGR and growth.


The 5 steps process:

Step 1: Secondary Research:

Secondary Research or Desk Research is as the name suggests is a research process wherein, we collect data through the readily available information. In this process we use various paid and unpaid databases which our team has access to and gather data through the same. This includes examining of listed companies’ annual reports, Journals, SEC filling etc. Apart from this our team has access to various associations across the globe across different industries. Lastly, we have exchange relationships with various university as well as individual libraries.

Secondary Research

Step 2: Primary Research

When we talk about primary research, it is a type of study in which the researchers collect relevant data samples directly, rather than relying on previously collected data.  This type of research is focused on gaining content specific facts that can be sued to solve specific problems. Since the collected data is fresh and first hand therefore it makes the study more accurate and genuine.

We at SNS Insider have divided Primary Research into 2 parts.

Part 1 wherein we interview the KOLs of major players as well as the upcoming ones across various geographic regions. This allows us to have their view over the market scenario and acts as an important tool to come closer to the accurate market numbers. As many as 45 paid and unpaid primary interviews are taken from both the demand and supply side of the industry to make sure we land at an accurate judgement and analysis of the market.

This step involves the triangulation of data wherein our team analyses the interview transcripts, online survey responses and observation of on filed participants. The below mentioned chart should give a better understanding of the part 1 of the primary interview.

Primary Research

Part 2: In this part of primary research the data collected via secondary research and the part 1 of the primary research is validated with the interviews from individual consultants and subject matter experts.

Consultants are those set of people who have at least 12 years of experience and expertise within the industry whereas Subject Matter Experts are those with at least 15 years of experience behind their back within the same space. The data with the help of two main processes i.e., FGDs (Focused Group Discussions) and IDs (Individual Discussions). This gives us a 3rd party nonbiased primary view of the market scenario making it a more dependable one while collation of the data pointers.

Step 3: Data Bank Validation

Once all the information is collected via primary and secondary sources, we run that information for data validation. At our intelligence centre our research heads track a lot of information related to the market which includes the quarterly reports, the daily stock prices, and other relevant information. Our data bank server gets updated every fortnight and that is how the information which we collected using our primary and secondary information is revalidated in real time.

Data Bank Validation

Step 4: QA/QC Process

After all the data collection and validation our team does a final level of quality check and quality assurance to get rid of any unwanted or undesired mistakes. This might include but not limited to getting rid of the any typos, duplication of numbers or missing of any important information. The people involved in this process include technical content writers, research heads and graphics people. Once this process is completed the title gets uploader on our platform for our clients to read it.

Step 5: Final QC/QA Process:

This is the last process and comes when the client has ordered the study. In this process a final QA/QC is done before the study is emailed to the client. Since we believe in giving our clients a good experience of our research studies, therefore, to make sure that we do not lack at our end in any way humanly possible we do a final round of quality check and then dispatch the study to the client.

Key Market Segments:

By Drug Class

  • Immunosuppressants

  • Immunostimulants

By Route of Administration

  • Oral

  • Injectable

  • Others

By Distribution Channel

  • Hospital Pharmacies

  • Retail Pharmacies

  • E-Commerce

Request for Segment Customization as per your Business Requirement: Segment Customization Request

Regional Coverage:

North America

  • US

  • Canada

  • Mexico

Europe

  • Eastern Europe

    • Poland

    • Romania

    • Hungary

    • Turkey

    • Rest of Eastern Europe

  • Western Europe

    • Germany

    • France

    • UK

    • Italy

    • Spain

    • Netherlands

    • Switzerland

    • Austria

    • Rest of Western Europe

Asia Pacific

  • China

  • India

  • Japan

  • South Korea

  • Vietnam

  • Singapore

  • Australia

  • Rest of Asia Pacific

Middle East & Africa

  • Middle East

    • UAE

    • Egypt

    • Saudi Arabia

    • Qatar

    • Rest of Middle East

  • Africa

    • Nigeria

    • South Africa

    • Rest of Africa

Latin America

  • Brazil

  • Argentina

  • Colombia

  • Rest of Latin America

Request for Country Level Research Report: Country Level Customization Request

Available Customization

With the given market data, SNS Insider offers customization as per the company’s specific needs. The following customization options are available for the report:

  • Detailed Volume Analysis

  • Criss-Cross segment analysis (e.g. Product X Application)

  • Competitive Product Benchmarking

  • Geographic Analysis

  • Additional countries in any of the regions

  • Customized Data Representation

  • Detailed analysis and profiling of additional market players


  •            5000 (33% Discount)


  •            8950 (40% Discount)


  •            3050 (23% Discount)

Start a Conversation

Hi! Click one of our member below to chat on Phone