image

Multi-Touch Screen Market Report Scope and Overview:
Multi-touch Screen Market,Revenue Analysis

Get More Information on Multi-touch Screen Market - Request Sample Report

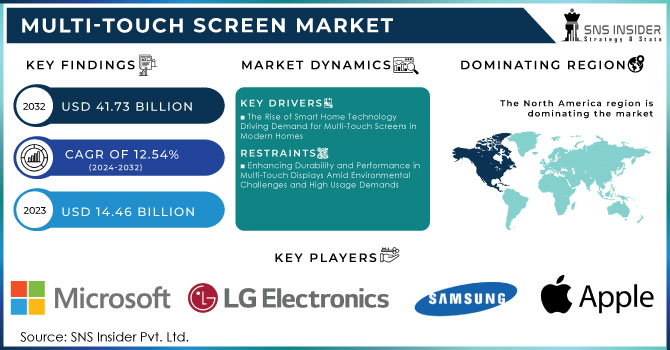
The Multi-touch Screen Market Size was valued at USD 14.46 Billion in 2023 and is expected to reach USD 41.73 Billion by 2032 and grow at a CAGR of 12.54% over the forecast period 2024-2032.

The multi-touch screen market is experiencing significant growth driven primarily by the increasing demand for interactive and user-friendly interfaces across various applications. As the number of smartphones, tablets, and other handheld devices entering the market is rising, so is the demand for advanced touch technology that allows users to navigate through the device conveniently and enhances user experience. As of 2024, nearly 4.88 billion are using smartphones across the world, or about 60.42% of the population, while since a few users may have more than one smartphone, the actual total number of active smartphones employed is about 7.21 billion​. This explains the extensive penetration of smartphones and their coming into the daily activities of different regions. In 2023, approximately 128.5 million tablets were shipped globally, with over 36.8 million units shipped in the last quarter alone. Throughout the year, Apple shipped around 48.5 million iPads. More so, the implementation of multi-touch screens is already applied in such places as retail, healthcare, and education, wherein sectors use digital signs, patient monitoring systems, and learning to boost cooperation and inclusion. The screens allow for the collaboration of several users in the same space; this will be extremely useful where teamwork has to be indispensable within an environment.

Technological improvements, such as multi-touch being sensitive enough to detect higher sensitivity, responding faster than its current speed, and developing durability, actually make the multi-touch screens more exciting. Features such as gesture recognition and haptic feedback innovate further. The growing demand for smart and intelligent devices at home and in offices automatically leads to the need for touch-friendly interfaces, thus promoting intuitive control and interaction. Thus, sustained long-term growth in the market from the various applications offered and enhanced functionalities of these screens would accordingly be likely to be propelled by further developments by the manufacturers of more versatile and affordable multi-touch solutions.

Multi-Touch Screen Market Dynamics

KEY DRIVERS:  

  • The Rise of Smart Home Technology Driving Demand for Multi-Touch Screens in Modern Homes

Smart home technology remains one of the dominant factors forcing multi-touch screens into growth. The higher the percentage of households embracing smart devices, the more the demand for easy and interactive interfaces. Multi-touch panels are central hubs whereby users operate various applications such as lighting, security systems, and entertainment devices. For instance, smart home hubs developed by companies such as Google and Amazon come with multi-touch screens, making it easy for customers to operate several devices from one location. The centralization provides a visual and tactile interface that enhances user experience because one can easily find their way within the various components of home automation systems. The availability of smart homes, for which multi-touch screens are always a necessary part would raise the demand for these touch screens to a greater extent. Evolution in-home technology is not only convenient and efficient but has paved the way for more complex interactions between a user and a smart device, further fueling the multi-touch screen market.

  • Digitization Across Sectors Boosting Demand for Multi-Touch Screens in Customer Engagement and Efficiency

Another strong impulse driver is the increasing attention toward the digitization of all sectors. More businesses are now investing in technologies that enhance their levels of engagement with customers and also increase the operational efficiency of businesses. Multi-touch screens are accompanied by the entire gamut of customer-facing environments, from restaurants and retail stores to restaurants, for which they create an interactive experience. Using kiosks with multi-touch screens, for example, enables customers to order, browse, and customize their selections at their convenience. In that regard, such systems have been placed by retailers like McDonald's and Starbucks, to simplify the process of taking orders, to reduce the waiting period for orders, and to make the entire process of serving the customers as efficient and easy as possible. Now, this is being borrowed and replicated in other industries like automotive and hospitality through interactive displays that will enable maximum customer experience. In the wake of organizations trying to design more engaging and efficient interaction, the need for multi-touch screen technology may skyrocket

RESTRAIN:

  • Enhancing Durability and Performance in Multi-Touch Displays Amid Environmental Challenges and High Usage Demands

Technology-related constraints are still one of the major constraints in the market for multi-touch displays because they perform worse than best under most conditions. To illustrate, in the case of extreme exposure to direct sunlight or temperature, the multi-touch screen response and accuracy degrade. In outdoor kiosks related to ticketing or information, especially those continuously seen on most theme park entrances, glare and weather conditions impose extreme limitations that affect the user experience. Another risk is the damage and durability of screens. Highly trafficked locations, including shopping malls and public transportation stations, can rub against screens with their parts causing scratches and cracking, as well as undue wear and tear on screens. For instance, touchscreen information kiosks in subway stations show signs of wear due to scratching, effectively reducing functionality and frustrating users. This requirement forces companies to search for more sustainable solutions that can accommodate a lot of usage while maintaining performance, making it difficult for manufacturers to improve its longevity without compromising the touch sensitivity.

Multi-Touch Screen Market Segmentation Overview

BY TECHNOLOGY

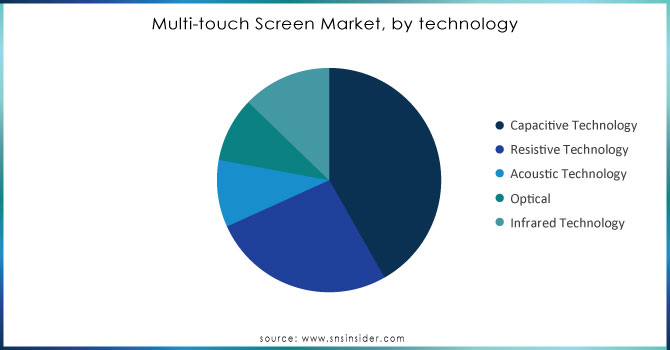
Capacitive technology dominated the market with the highest share of 41.7% of the multi-touch screen market in 2023 due to its added advantage of superior touch sensitivity and accuracy besides its wide acceptability in consumer electronic devices, especially smartphones and tablets. Capacitive touchscreens detect the changes in electrical charge when any conducting object, such as a human finger, touches the screen. This technology features an extremely fast and fluid experience for the user, which plays well in mainstay devices such as iPhones, Samsung Galaxy phones, and other leaders in their markets. Capacitive screens are also durable because they work through a protective glass layer, further maximizing their virtues in this highly sought-after smartphone and tablet marketplace, and that is one of the reasons for their current market superiority.

The optical segment is expected to be the fastest-growing segment from 2024 to 2032, with the increasing adoption of special applications that require larger screen sizes. Interactive kiosks and industrial displays are huge prospects for optical touchscreens. Optical technology uses infrared sensors to detect touch and will even work as a multi-touch module in rugged environments or with non-conductive objects like gloves or styluses. It is perfectly designed for large displays that are gaining popularity in retail, healthcare, and education fields. That's the reason it is appealing to the market mainly due to the scalability, flexibility, and low maintenance of the optical touch screens, which are some factors driving its rapid growth during this period.
Multi-touch-Screen-Market-by-technology

Need Any Customization Research On Multi-Touch Screen Market - Inquiry Now

BY PRODUCT

The smartphone dominated the market share of 54.5% in 2023, driven by huge and constant demand from advanced touch technology. Since smartphones are a part of daily life used during communication, entertainment, and work activities, the focus of their manufacturers is that such multitouch screens must be highly responsive, durable, and support multi-touch gestures. The major players are Apple, Samsung, and Xiaomi. This segment has mostly innovated with more touch sensitivity, display quality, and durability. Replacing itself is extremely high, and constant up-gradation has helped this segment remain dominant through the year 2023. In addition to this, 5G-enabled smartphones have caused a sea change in demand for high-performance touchscreens, further ensuring market leadership for smartphones.

Tablets are expected to grow the fastest from 2024 to 2032 because it's being offered to so many industries and spaces like education, business, and healthcare. The demand for big, interactive touchscreens increased through remote work and e-learning, so people took off on using tablets as excellent versatile tools for presentations, online education, and professional applications like graphic design, and video conferencing. Growth in digital learning platforms and the usage of tablets by educational institutes for interactive experiences have been particularly strong drivers. In industrial and healthcare settings, tablets are increasingly gaining popularity where larger screens and multi-touch capabilities offer greater utility than those available on smartphones, thereby gaining rapidly in this segment.

BY END USE

The retail segment dominated the largest share of 28.4% in 2023 and is expected to grow at a high CAGR from 2024 to 2032 in the multi-touch screen market. This dominance can be attributed majorly to the increased adoption of interactive displays and kiosks across retail places due to an enhancement in the customer experience and effectiveness. Multi-touch screens are becoming popular among retailers for more interactive and engaging digital signage, self-service kiosks, and point-of-sale systems that allow customers to browse, order, and transact on their own. Examples of big retailers that continue to modernize using touchscreens include McDonald's, Walmart, and Zara. Growth in multi-touch technology is expected to be a high growth factor in the retail segment as increases in touch technologies and more digital transformation strategies. Brick-and-mortar stores are leveraging multi-touch screens as they are also trying to expand themselves more competitively with e-commerce operations. Interactive mirrors, self-checkout systems, and touchscreen-based product recommendations were becoming the new features of the modern retail landscape.

Multi-Touch Screen Market Regional Analysis

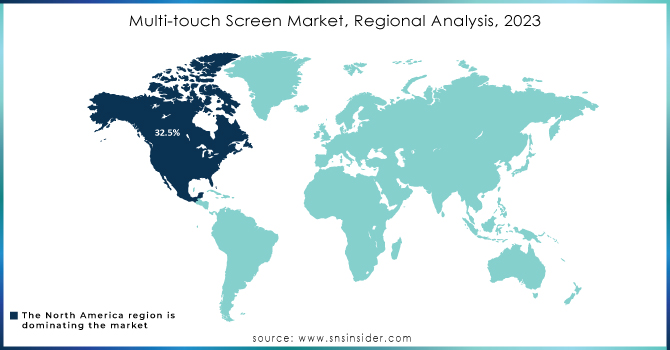
In 2023, North America dominated the market, accounting for 32.5% of the total share, due to its more developed technological infrastructure and high demand from consumers for touch interaction devices. The earlier adoption of multi-touch technology by all industries can also be partly accounted for the regional share. Multi-touch screens are now being widely adopted in the retail, healthcare, and education sectors for the better facilitation of user interaction and operational efficiency. For example, in the United States alone, firms like Apple and Microsoft have massively exploited multi-touch technology in consumer electronics such as smartphones, tablets, and laptops. Furthermore, interactive multi-touch kiosks are often used in the North American retail industry to engage customers, which nowadays can be seen, for example, in stores like Target and Walmart with self-checkout services and digital displays.

Asia Pacific region is expected to showcase a high growth rate during the forecast period of 2024-2032. The factors contributing to the growth of this region are rapid industrialization, increased investments in smart city projects, and robust growth in electronics manufacturing. Countries like China, Japan, and South Korea mainly manufacture electronic devices and, as a result, fuel the demand for multi-touch technology by natural order. The retail sector in Asia Pacific too is undergoing a great transformation. For example, China and other countries are using multi-touch screens in e-commerce-integrated physical stores. For example, Alibaba's "New Retail" strategy is a combination of online and offline shopping where the company uses the sales staff equipped with interactive touchscreens for a personalized experience. The digitalization that is witnessing growth in the region plus the rising need for smart devices on the part of consumers makes Asia Pacific ready for a faster growth curve of the multi-touch screen market.
Multi-touch-Screen-Market-Regional-Analysis-2023

Key Players in Multi-Touch Screen Market

Some of the major players in the Multi-touch Screen Market are:

  • 3M (MicroTouch System, Multi-Touch Chassis Display)

  • Apple Inc. (iPhone, iPad)

  • Samsung Electronics (Galaxy S Series, Galaxy Tab)

  • LG Electronics (LG V Series, LG Gram Touch)

  • Microsoft Corporation (Surface Pro, Surface Book)

  • Sony Corporation (Xperia Series, Sony Bravia Touchscreen TV)

  • Atmel Corporation (maXTouch Controllers, XSense Touch Sensors)

  • Cypress Semiconductor Corporation (TrueTouch Controllers, CapSense Solutions)

  • Fujitsu Limited (Lifebook Series, Stylistic Tablets)

  • Sharp Corporation (Aquos Board, Sharp Touch Monitors)

  • Hewlett-Packard (HP) (HP Elite x2, HP Spectre x360)

  • Dell Technologies (XPS Series, Latitude Touchscreen)

  • Lenovo Group (ThinkPad Series, Yoga Series)

  • AsusTek Computer Inc. (ZenBook Series, VivoBook Series)

  • Synaptics Incorporated (ClearPad Touch Controllers, TouchPad Series)

  • Panasonic Corporation (Toughbook Series, Toughpad Series)

  • Toshiba Corporation (Toshiba Satellite Series, Dynabook)

  • Planar Systems (Helium Series Monitors, UltraRes Touch Displays)

  • Wintek Corporation (On-cell Touch Solutions, GFF Touchscreen)

  • BOE Technology Group Co. Ltd. (Flexible OLED Displays, BOE Touch Panel)

Some of the Raw Material Suppliers for Multi-touch Screen Companies:

  • Corning Inc.

  • Asahi Glass Co., Ltd. (AGC)

  • Schott AG

  • Nitto Denko Corporation

  • Saint-Gobain

  • SABIC

  • DuPont

  • Eastman Chemical Company

  • Toray Industries

  • 3M (Materials Division)

RECENT TRENDS

  • In October 2024, Infineon Technologies launched the Automotive PSoC Multitouch GEN8XL (IAAT818X), a next-generation touch controller designed for OLED and micro-LED displays up to 24 inches. This new controller offers enhanced performance and frame rates to meet the demands of modern applications.

  • In October 2024, AAEON unveiled two new Panel PCs: the ACP-2106, featuring a 10-inch WXGA screen, and the ACP-2076, equipped with a 7-inch WSVGA Projected Capacitive Multi-Touch screen

  • In December 2023, Vecow, a leading embedded solution provider, introduced its latest product, the MTA-1010W Multi-Touch Computer. This versatile device is designed for a range of applications, including vending machines, smart buildings, and AIoT/Industry 4.0 solutions.

Multi-touch Screen Market Report Scope:

Report Attributes Details
Market Size in 2023 USD 14.46 Billion 
Market Size by 2032 USD  41.73 Billion 
CAGR CAGR of 12.54% From 2024 to 2032
Base Year 2023
Forecast Period 2024-2032
Historical Data 2020-2022
Report Scope & Coverage Market Size, Segments Analysis, Competitive  Landscape, Regional Analysis, DROC & SWOT Analysis, Forecast Outlook
Key Segments • By Technology (Capacitive Technology, Resistive Technology, Acoustic Technology, Optical, Infrared Technology),
• By Product (Smartphones, Tablets, Laptops, Televisions),
• By End Use (Retail, Government, Enterprise, Industrial, Commercial)
Regional Analysis/Coverage North America (US, Canada, Mexico), Europe (Eastern Europe [Poland, Romania, Hungary, Turkey, Rest of Eastern Europe] Western Europe] Germany, France, UK, Italy, Spain, Netherlands, Switzerland, Austria, Rest of Western Europe]), Asia Pacific (China, India, Japan, South Korea, Vietnam, Singapore, Australia, Rest of Asia Pacific), Middle East & Africa (Middle East [UAE, Egypt, Saudi Arabia, Qatar, Rest of Middle East], Africa [Nigeria, South Africa, Rest of Africa], Latin America (Brazil, Argentina, Colombia, Rest of Latin America)
Company Profiles 3M, Apple Inc., Samsung Electronics, LG Electronics, Microsoft Corporation, Sony Corporation, Atmel Corporation, Cypress Semiconductor Corporation, Fujitsu Limited, Sharp Corporation, Hewlett-Packard (HP), Dell Technologies, Lenovo Group, AsusTek Computer Inc., Synaptics Incorporated, Panasonic Corporation, Toshiba Corporation, Planar Systems, Wintek Corporation, BOE Technology Group Co. Ltd
Key Drivers • The Rise of Smart Home Technology Driving Demand for Multi-Touch Screens in Modern Homes
• Digitization Across Sectors Boosting Demand for Multi-Touch Screens in Customer Engagement and Efficiency
RESTRAINTS • Enhancing Durability and Performance in Multi-Touch Displays Amid Environmental Challenges and High Usage Demands

Frequently Asked Questions

Ans: The Multi-touch Screen Market is expected to grow at a CAGR of 12.54% during 2024-2032.

Ans: Multi-touch Screen Market size was USD 14.46 billion in 2023 and is expected to Reach USD 41.73 billion by 2032.

Ans: The major growth factor of the multi-touch screen market is the increasing demand for interactive and user-friendly interfaces across various applications, including consumer electronics, retail, and healthcare.

Ans: The Retail segment dominated the Multi-touch Screen Market in 2023.

Ans: NORTH AMERICA dominated the Multi-touch Screen Market in 2023.

Table of Content

1. Introduction

1.1 Market Definition

1.2 Scope (Inclusion and Exclusions)

1.3 Research Assumptions

2. Executive Summary

2.1 Market Overview

2.2 Regional Synopsis

2.3 Competitive Summary

3. Research Methodology

3.1 Top-Down Approach

3.2 Bottom-up Approach

3.3. Data Validation

3.4 Primary Interviews

4. Market Dynamics Impact Analysis

4.1 Market Driving Factors Analysis

4.1.1 Drivers

4.1.2 Restraints

4.1.3 Opportunities

4.1.4 Challenges

4.2 PESTLE Analysis

4.3 Porter’s Five Forces Model

5. Statistical Insights and Trends Reporting

      5.1 Multi-touch Screen Technology Adoption Rates, by Region, (2020-2023)

      5.2 Multi-touch Screen Consumer Engagement Metrics, by Region, (2020-2023)

      5.3 Multi-touch Screen Product Features Analysis

      5.4 Multi-touch Screen Competitive Landscape

6. Competitive Landscape

6.1 List of Major Companies, By Region

6.2 Market Share Analysis, By Region

6.3 Product Benchmarking

6.3.1 Product specifications and features

6.3.2 Pricing

6.4 Strategic Initiatives

6.4.1 Marketing and promotional activities

6.4.2 Distribution and Supply Chain Strategies

6.4.3 Expansion plans and new product launches

6.4.4 Strategic partnerships and collaborations

6.5 Technological Advancements

6.6 Market Positioning and Branding

7. Multi-touch Screen Market Segmentation, By Technology

7.1 Chapter Overview

7.2 Capacitive Technology

7.2.1 Capacitive Technology Market Trends Analysis (2020-2032)

7.2.2 Capacitive Technology Market Size Estimates and Forecasts to 2032 (USD Million)

     7.3 Resistive Technology

7.3.1 Resistive Technology Market Trends Analysis (2020-2032)

7.3.2 Resistive Technology Market Size Estimates and Forecasts to 2032 (USD Million)

    7.4 Acoustic Technology

7.4.1 Acoustic Technology Market Trends Analysis (2020-2032)

7.4.2 Acoustic Technology Market Size Estimates and Forecasts to 2032 (USD Million)

   7.5 Optical Technology

7.5.1 Optical Technology Market Trends Analysis (2020-2032)

7.5.2 Optical Technology Market Size Estimates and Forecasts to 2032 (USD Million)

   7.6 Infrared Technology

7.6.1 Infrared Technology Market Trends Analysis (2020-2032)

7.6.2 Infrared Technology Market Size Estimates and Forecasts to 2032 (USD Million)

 8. Multi-touch Screen Market Segmentation, By Product

       8.1 Chapter Overview

8.2 Smartphones

8.2.1 Smartphones Market Trends Analysis (2020-2032)

8.2.2 Smartphones Market Size Estimates and Forecasts to 2032 (USD     Billion)

8.3 Tablets

8.3.1 Tablets Market Trends Analysis (2020-2032)

8.3.2 Tablets Market Size Estimates and Forecasts to 2032 (USD Billion)

8.4 Laptops

8.4.1 Laptops Market Trends Analysis (2020-2032)

8.4.2 Laptops Market Size Estimates and Forecasts to 2032 (USD Billion)

8.5 Televisions

8.5.1 Televisions Market Trends Analysis (2020-2032)

8.5.2 Televisions Market Size Estimates and Forecasts to 2032 (USD Billion)

9. Multi-touch Screen Market Segmentation, By End Use

9.1 Chapter Overview

9.2 Retail

9.2.1 Retail Market Trends Analysis (2020-2032)

9.2.2 Retail Market Size Estimates and Forecasts to 2032 (USD Billion)

9.3 Government

9.3.1 Government Market Trends Analysis (2020-2032)

9.3.2 Government Market Size Estimates and Forecasts to 2032 (USD Billion)

9.4 Enterprise

9.4.1 Enterprise Market Trends Analysis (2020-2032)

9.4.2 Enterprise Market Size Estimates and Forecasts to 2032 (USD Billion)

9.5 Industrial

9.5.1 Industrial Market Trends Analysis (2020-2032)

9.5.2 Industrial Market Size Estimates and Forecasts to 2032 (USD Billion)

9.6 Commercial

9.6.1 Commercial Market Trends Analysis (2020-2032)

9.6.2 Commercial Market Size Estimates and Forecasts to 2032 (USD Billion)

10. Regional Analysis

10.1 Chapter Overview

10.2 North America

10.2.1 Trends Analysis

10.2.2 North America Multi-touch Screen Market Estimates and Forecasts, by Country (2020-2032) (USD Billion)

10.2.3 North America Multi-touch Screen Market Estimates and Forecasts, By Technology (2020-2032) (USD Billion)  

10.2.4 North America Multi-touch Screen Market Estimates and Forecasts, By Product (2020-2032) (USD Billion)

10.2.5 North America Multi-touch Screen Market Estimates and Forecasts, By End Use (2020-2032) (USD Billion)

10.2.6 USA

10.2.6.1 USA Multi-touch Screen Market Estimates and Forecasts, By Technology (2020-2032) (USD Billion)

10.2.6.2 USA Multi-touch Screen Market Estimates and Forecasts, By Product (2020-2032) (USD Billion)

10.2.6.3 USA Multi-touch Screen Market Estimates and Forecasts, By End Use (2020-2032) (USD Billion)

10.2.7 Canada

10.2.7.1 Canada Multi-touch Screen Market Estimates and Forecasts, By Technology (2020-2032) (USD Billion)

10.2.7.2 Canada Multi-touch Screen Market Estimates and Forecasts, By Product (2020-2032) (USD Billion)

10.2.7.3 Canada Multi-touch Screen Market Estimates and Forecasts, By End Use (2020-2032) (USD Billion)

10.2.8 Mexico

10.2.8.1 Mexico Multi-touch Screen Market Estimates and Forecasts, By Technology (2020-2032) (USD Billion)

10.2.8.2 Mexico Multi-touch Screen Market Estimates and Forecasts, By Product (2020-2032) (USD Billion)

10.2.8.3 Mexico Multi-touch Screen Market Estimates and Forecasts, By End Use (2020-2032) (USD Billion)

10.3 Europe

10.3.1 Eastern Europe

10.3.1.1 Trends Analysis

10.3.1.2 Eastern Europe Multi-touch Screen Market Estimates and Forecasts, by Country (2020-2032) (USD Billion)

10.3.1.3 Eastern Europe Multi-touch Screen Market Estimates and Forecasts, By Technology (2020-2032) (USD Billion)  

10.3.1.4 Eastern Europe Multi-touch Screen Market Estimates And Forecasts, By Product (2020-2032) (USD Billion)

10.3.1.5 Eastern Europe Multi-touch Screen Market Estimates And Forecasts, By End Use (2020-2032) (USD Billion)

10.3.1.6 Poland

10.3.1.6.1 Poland Multi-touch Screen Market Estimates And Forecasts, By Technology (2020-2032) (USD Billion)

10.3.1.6.2 Poland Multi-touch Screen Market Estimates And Forecasts, By Product (2020-2032) (USD Billion)

10.3.1.6.3 Poland Multi-touch Screen Market Estimates And Forecasts, By End Use (2020-2032) (USD Billion)

10.3.1.7 Romania

10.3.1.7.1 Romania Multi-touch Screen Market Estimates And Forecasts, By Technology (2020-2032) (USD Billion)

10.3.1.7.2 Romania Multi-touch Screen Market Estimates And Forecasts, By Product (2020-2032) (USD Billion)

10.3.1.7.3 Romania Multi-touch Screen Market Estimates And Forecasts, By End Use (2020-2032) (USD Billion)

10.3.1.8 Hungary

10.3.1.8.1 Hungary Multi-touch Screen Market Estimates And Forecasts, By Technology (2020-2032) (USD Billion)

10.3.1.8.2 Hungary Multi-touch Screen Market Estimates And Forecasts, By Product (2020-2032) (USD Billion)

10.3.1.8.3 Hungary Multi-touch Screen Market Estimates And Forecasts, By End Use (2020-2032) (USD Billion)

10.3.1.9 Turkey

10.3.1.9.1 Turkey Multi-touch Screen Market Estimates And Forecasts, By Technology (2020-2032) (USD Billion)

10.3.1.9.2 Turkey Multi-touch Screen Market Estimates And Forecasts, By Product (2020-2032) (USD Billion)

10.3.1.9.3 Turkey Multi-touch Screen Market Estimates And Forecasts, By End Use (2020-2032) (USD Billion)

10.3.1.10 Rest Of Eastern Europe

10.3.1.10.1 Rest Of Eastern Europe Multi-touch Screen Market Estimates And Forecasts, By Technology (2020-2032) (USD Billion)

10.3.1.10.2 Rest Of Eastern Europe Multi-touch Screen Market Estimates And Forecasts, By Product (2020-2032) (USD Billion)

10.3.1.10.3 Rest Of Eastern Europe Multi-touch Screen Market Estimates And Forecasts, By End Use (2020-2032) (USD Billion)

10.3.2 Western Europe

10.3.2.1 Trends Analysis

10.3.2.2 Western Europe Multi-touch Screen Market Estimates And Forecasts, By Country (2020-2032) (USD Billion)

10.3.2.3 Western Europe Multi-touch Screen Market Estimates And Forecasts, By Technology (2020-2032) (USD Billion)  

10.3.2.4 Western Europe Multi-touch Screen Market Estimates And Forecasts, By Product (2020-2032) (USD Billion)

10.3.2.5 Western Europe Multi-touch Screen Market Estimates And Forecasts, By End Use (2020-2032) (USD Billion)

10.3.2.6 Germany

10.3.2.6.1 Germany Multi-touch Screen Market Estimates And Forecasts, By Technology (2020-2032) (USD Billion)

10.3.2.6.2 Germany Multi-touch Screen Market Estimates And Forecasts, By Product (2020-2032) (USD Billion)

10.3.2.6.3 Germany Multi-touch Screen Market Estimates And Forecasts, By End Use (2020-2032) (USD Billion)

10.3.2.7 France

10.3.2.7.1 France Multi-touch Screen Market Estimates And Forecasts, By Technology (2020-2032) (USD Billion)

10.3.2.7.2 France Multi-touch Screen Market Estimates And Forecasts, By Product (2020-2032) (USD Billion)

10.3.2.7.3 France Multi-touch Screen Market Estimates And Forecasts, By End Use (2020-2032) (USD Billion)

10.3.2.8 UK

10.3.2.8.1 UK Multi-touch Screen Market Estimates And Forecasts, By Technology (2020-2032) (USD Billion)

10.3.2.8.2 UK Multi-touch Screen Market Estimates And Forecasts, By Product (2020-2032) (USD Billion)

10.3.2.8.3 UK Multi-touch Screen Market Estimates And Forecasts, By End Use (2020-2032) (USD Billion)

10.3.2.9 Italy

10.3.2.9.1 Italy Multi-touch Screen Market Estimates And Forecasts, By Technology (2020-2032) (USD Billion)

10.3.2.9.2 Italy Multi-touch Screen Market Estimates And Forecasts, By Product (2020-2032) (USD Billion)

10.3.2.9.3 Italy Multi-touch Screen Market Estimates And Forecasts, By End Use (2020-2032) (USD Billion)

10.3.2.10 Spain

10.3.2.10.1 Spain Multi-touch Screen Market Estimates And Forecasts, By Technology (2020-2032) (USD Billion)

10.3.2.10.2 Spain Multi-touch Screen Market Estimates And Forecasts, By Product (2020-2032) (USD Billion)

10.3.2.10.3 Spain Multi-touch Screen Market Estimates And Forecasts, By End Use (2020-2032) (USD Billion)

10.3.2.11 Netherlands

10.3.2.11.1 Netherlands Multi-touch Screen Market Estimates And Forecasts, By Technology (2020-2032) (USD Billion)

10.3.2.11.2 Netherlands Multi-touch Screen Market Estimates And Forecasts, By Product (2020-2032) (USD Billion)

10.3.2.11.3 Netherlands Multi-touch Screen Market Estimates And Forecasts, By End Use (2020-2032) (USD Billion)

10.3.2.12 Switzerland

10.3.2.12.1 Switzerland Multi-touch Screen Market Estimates And Forecasts, By Technology (2020-2032) (USD Billion)

10.3.2.12.2 Switzerland Multi-touch Screen Market Estimates And Forecasts, By Product (2020-2032) (USD Billion)

10.3.2.12.3 Switzerland Multi-touch Screen Market Estimates And Forecasts, By End Use (2020-2032) (USD Billion)

10.3.2.13 Austria

10.3.2.13.1 Austria Multi-touch Screen Market Estimates And Forecasts, By Technology (2020-2032) (USD Billion)

10.3.2.13.2 Austria Multi-touch Screen Market Estimates And Forecasts, By Product (2020-2032) (USD Billion)

10.3.2.13.3 Austria Multi-touch Screen Market Estimates And Forecasts, By End Use (2020-2032) (USD Billion)

10.3.2.14 Rest Of Western Europe

10.3.2.14.1 Rest Of Western Europe Multi-touch Screen Market Estimates And Forecasts, By Technology (2020-2032) (USD Billion)

10.3.2.14.2 Rest Of Western Europe Multi-touch Screen Market Estimates And Forecasts, By Product (2020-2032) (USD Billion)

10.3.2.14.3 Rest Of Western Europe Multi-touch Screen Market Estimates And Forecasts, By End Use (2020-2032) (USD Billion)

10.4 Asia Pacific

10.4.1 Trends Analysis

10.4.2 Asia Pacific Multi-touch Screen Market Estimates And Forecasts, By Country (2020-2032) (USD Billion)

10.4.3 Asia Pacific Multi-touch Screen Market Estimates And Forecasts, By Technology (2020-2032) (USD Billion)  

10.4.4 Asia Pacific Multi-touch Screen Market Estimates And Forecasts, By Product (2020-2032) (USD Billion)

10.4.5 Asia Pacific Multi-touch Screen Market Estimates And Forecasts, By End Use (2020-2032) (USD Billion)

10.4.6 China

10.4.6.1 China Multi-touch Screen Market Estimates And Forecasts, By Technology (2020-2032) (USD Billion)

10.4.6.2 China Multi-touch Screen Market Estimates And Forecasts, By Product (2020-2032) (USD Billion)

10.4.6.3 China Multi-touch Screen Market Estimates And Forecasts, By End Use (2020-2032) (USD Billion)

10.4.7 India

10.4.7.1 India Multi-touch Screen Market Estimates And Forecasts, By Technology (2020-2032) (USD Billion)

10.4.7.2 India Multi-touch Screen Market Estimates And Forecasts, By Product (2020-2032) (USD Billion)

10.4.7.3 India Multi-touch Screen Market Estimates And Forecasts, By End Use (2020-2032) (USD Billion)

10.4.8 Japan

10.4.8.1 Japan Multi-touch Screen Market Estimates And Forecasts, By Technology (2020-2032) (USD Billion)

10.4.8.2 Japan Multi-touch Screen Market Estimates And Forecasts, By Product (2020-2032) (USD Billion)

10.4.8.3 Japan Multi-touch Screen Market Estimates And Forecasts, By End Use (2020-2032) (USD Billion)

10.4.9 South Korea

10.4.9.1 South Korea Multi-touch Screen Market Estimates And Forecasts, By Technology (2020-2032) (USD Billion)

10.4.9.2 South Korea Multi-touch Screen Market Estimates And Forecasts, By Product (2020-2032) (USD Billion)

10.4.9.3 South Korea Multi-touch Screen Market Estimates And Forecasts, By End Use (2020-2032) (USD Billion)

10.4.10 Vietnam

10.4.10.1 Vietnam Multi-touch Screen Market Estimates And Forecasts, By Technology (2020-2032) (USD Billion)

10.4.10.2 Vietnam Multi-touch Screen Market Estimates And Forecasts, By Product (2020-2032) (USD Billion)

10.4.10.3 Vietnam Multi-touch Screen Market Estimates And Forecasts, By End Use (2020-2032) (USD Billion)

10.4.11 Singapore

10.4.11.1 Singapore Multi-touch Screen Market Estimates And Forecasts, By Technology (2020-2032) (USD Billion)

10.4.11.2 Singapore Multi-touch Screen Market Estimates And Forecasts, By Product (2020-2032) (USD Billion)

10.4.11.3 Singapore Multi-touch Screen Market Estimates And Forecasts, By End Use (2020-2032) (USD Billion)

10.4.12 Australia

10.4.12.1 Australia Multi-touch Screen Market Estimates And Forecasts, By Technology (2020-2032) (USD Billion)

10.4.12.2 Australia Multi-touch Screen Market Estimates And Forecasts, By Product (2020-2032) (USD Billion)

10.4.12.3 Australia Multi-touch Screen Market Estimates And Forecasts, By End Use (2020-2032) (USD Billion)

10.4.13 Rest Of Asia Pacific

10.4.13.1 Rest Of Asia Pacific Multi-touch Screen Market Estimates And Forecasts, By Technology (2020-2032) (USD Billion)

10.4.13.2 Rest Of Asia Pacific Multi-touch Screen Market Estimates And Forecasts, By Product (2020-2032) (USD Billion)

10.4.13.3 Rest Of Asia Pacific Multi-touch Screen Market Estimates And Forecasts, By End Use (2020-2032) (USD Billion)

10.5 Middle East And Africa

10.5.1 Middle East

10.5.1.1 Trends Analysis

10.5.1.2 Middle East Multi-touch Screen Market Estimates And Forecasts, By Country (2020-2032) (USD Billion)

10.5.1.3 Middle East Multi-touch Screen Market Estimates And Forecasts, By Technology (2020-2032) (USD Billion)  

10.5.1.4 Middle East Multi-touch Screen Market Estimates And Forecasts, By Product (2020-2032) (USD Billion)

10.5.1.5 Middle East Multi-touch Screen Market Estimates And Forecasts, By End Use (2020-2032) (USD Billion)

10.5.1.6 UAE

10.5.1.6.1 UAE Multi-touch Screen Market Estimates And Forecasts, By Technology (2020-2032) (USD Billion)

10.5.1.6.2 UAE Multi-touch Screen Market Estimates And Forecasts, By Product (2020-2032) (USD Billion)

10.5.1.6.3 UAE Multi-touch Screen Market Estimates And Forecasts, By End Use (2020-2032) (USD Billion)

10.5.1.7 Egypt

10.5.1.7.1 Egypt Multi-touch Screen Market Estimates And Forecasts, By Technology (2020-2032) (USD Billion)

10.5.1.7.2 Egypt Multi-touch Screen Market Estimates And Forecasts, By Product (2020-2032) (USD Billion)

10.5.1.7.3 Egypt Multi-touch Screen Market Estimates And Forecasts, By End Use (2020-2032) (USD Billion)

10.5.1.8 Saudi Arabia

10.5.1.8.1 Saudi Arabia Multi-touch Screen Market Estimates And Forecasts, By Technology (2020-2032) (USD Billion)

10.5.1.8.2 Saudi Arabia Multi-touch Screen Market Estimates And Forecasts, By Product (2020-2032) (USD Billion)

10.5.1.8.3 Saudi Arabia Multi-touch Screen Market Estimates And Forecasts, By End Use (2020-2032) (USD Billion)

10.5.1.9 Qatar

10.5.1.9.1 Qatar Multi-touch Screen Market Estimates And Forecasts, By Technology (2020-2032) (USD Billion)

10.5.1.9.2 Qatar Multi-touch Screen Market Estimates And Forecasts, By Product (2020-2032) (USD Billion)

10.5.1.9.3 Qatar Multi-touch Screen Market Estimates And Forecasts, By End Use (2020-2032) (USD Billion)

10.5.1.10 Rest Of Middle East

10.5.1.10.1 Rest Of Middle East Multi-touch Screen Market Estimates And Forecasts, By Technology (2020-2032) (USD Billion)

10.5.1.10.2 Rest Of Middle East Multi-touch Screen Market Estimates And Forecasts, By Product (2020-2032) (USD Billion)

10.5.1.10.3 Rest Of Middle East Multi-touch Screen Market Estimates And Forecasts, By End Use (2020-2032) (USD Billion)

10.5.2 Africa

10.5.2.1 Trends Analysis

10.5.2.2 Africa Multi-touch Screen Market Estimates And Forecasts, By Country (2020-2032) (USD Billion)

10.5.2.3 Africa Multi-touch Screen Market Estimates And Forecasts, By Technology (2020-2032) (USD Billion)  

10.5.2.4 Africa Multi-touch Screen Market Estimates And Forecasts, By Product (2020-2032) (USD Billion)

10.5.2.5 Africa Multi-touch Screen Market Estimates And Forecasts, By End Use (2020-2032) (USD Billion)

10.5.2.6 South Africa

10.5.2.6.1 South Africa Multi-touch Screen Market Estimates And Forecasts, By Technology (2020-2032) (USD Billion)

10.5.2.6.2 South Africa Multi-touch Screen Market Estimates And Forecasts, By Product (2020-2032) (USD Billion)

10.5.2.6.3 South Africa Multi-touch Screen Market Estimates And Forecasts, By End Use (2020-2032) (USD Billion)

10.5.2.7 Nigeria

10.5.2.7.1 Nigeria Multi-touch Screen Market Estimates And Forecasts, By Technology (2020-2032) (USD Billion)

10.5.2.7.2 Nigeria Multi-touch Screen Market Estimates And Forecasts, By Product (2020-2032) (USD Billion)

10.5.2.7.3 Nigeria Multi-touch Screen Market Estimates And Forecasts, By End Use (2020-2032) (USD Billion)

10.5.2.8 Rest Of Africa

10.5.2.8.1 Rest Of Africa Multi-touch Screen Market Estimates And Forecasts, By Technology (2020-2032) (USD Billion)

10.5.2.8.2 Rest Of Africa Multi-touch Screen Market Estimates And Forecasts, By Product (2020-2032) (USD Billion)

10.5.2.8.3 Rest Of Africa Multi-touch Screen Market Estimates And Forecasts, By End Use (2020-2032) (USD Billion)

10.6 Latin America

10.6.1 Trends Analysis

10.6.2 Latin America Multi-touch Screen Market Estimates And Forecasts, By Country (2020-2032) (USD Billion)

10.6.3 Latin America Multi-touch Screen Market Estimates And Forecasts, By Technology (2020-2032) (USD Billion)  

10.6.4 Latin America Multi-touch Screen Market Estimates And Forecasts, By Product (2020-2032) (USD Billion)

10.6.5 Latin America Multi-touch Screen Market Estimates And Forecasts, By End Use (2020-2032) (USD Billion)

10.6.6 Brazil

10.6.6.1 Brazil Multi-touch Screen Market Estimates And Forecasts, By Technology (2020-2032) (USD Billion)

10.6.6.2 Brazil Multi-touch Screen Market Estimates And Forecasts, By Product (2020-2032) (USD Billion)

10.6.6.3 Brazil Multi-touch Screen Market Estimates And Forecasts, By End Use (2020-2032) (USD Billion)

10.6.7 Argentina

10.6.7.1 Argentina Multi-touch Screen Market Estimates And Forecasts, By Technology (2020-2032) (USD Billion)

10.6.7.2 Argentina Multi-touch Screen Market Estimates And Forecasts, By Product (2020-2032) (USD Billion)

10.6.7.3 Argentina Multi-touch Screen Market Estimates And Forecasts, By End Use (2020-2032) (USD Billion)

10.6.8 Colombia

10.6.8.1 Colombia Multi-touch Screen Market Estimates And Forecasts, By Technology (2020-2032) (USD Billion)

10.6.8.2 Colombia Multi-touch Screen Market Estimates And Forecasts, By Product (2020-2032) (USD Billion)

10.6.8.3 Colombia Multi-touch Screen Market Estimates And Forecasts, By End Use (2020-2032) (USD Billion)

10.6.9 Rest Of Latin America

10.6.9.1 Rest Of Latin America Multi-touch Screen Market Estimates And Forecasts, By Technology (2020-2032) (USD Billion)

10.6.9.2 Rest Of Latin America Multi-touch Screen Market Estimates And Forecasts, By Product (2020-2032) (USD Billion)

10.6.9.3 Rest Of Latin America Multi-touch Screen Market Estimates And Forecasts, By End Use (2020-2032) (USD Billion)

11. Company Profiles

11.1 3M

11.1.1 Company Overview

11.1.2 Financial

11.1.3 Products/ Services Offered

11.1.4 SWOT Analysis

11.2 LG Apple Inc

11.2.1 Company Overview

11.2.2 Financial

11.2.3 Products/ Services Offered

11.2.4 SWOT Analysis

11.3 Samsung Electronics

11.3.1 Company Overview

11.3.2 Financial

11.3.3 Products/ Services Offered

11.3.4 SWOT Analysis

11.4 LG Electronics

11.4.1 Company Overview

11.4.2 Financial

11.4.3 Products/ Services Offered

11.4.4 SWOT Analysis

11.5 Microsoft Corporation

11.5.1 Company Overview

11.5.2 Financial

11.5.3 Products/ Services Offered

11.5.4 SWOT Analysis

11.6 Sony Corporation

11.6.1 Company Overview

11.6.2 Financial

11.6.3 Products/ Services Offered

11.6.4 SWOT Analysis

11.7 Atmel Corporation

11.7.1 Company Overview

11.7.2 Financial

11.7.3 Products/ Services Offered

11.7.4 SWOT Analysis

11.8 Cypress Semiconductor Corporation

11.8.1 Company Overview

11.8.2 Financial

11.8.3 Products/ Services Offered

11.8.4 SWOT Analysis

11.9 Fujitsu Limited

11.9.1 Company Overview

11.9.2 Financial

11.9.3 Products/ Services Offered

11.9.4 SWOT Analysis

11.10 Sharp Corporation

11.10.1 Company Overview

11.10.2 Financial

11.10.3 Products/ Services Offered

11.10.4 SWOT Analysis

12. Use Cases and Best Practices

13. Conclusion

An accurate research report requires proper strategizing as well as implementation. There are multiple factors involved in the completion of good and accurate research report and selecting the best methodology to compete the research is the toughest part. Since the research reports we provide play a crucial role in any company’s decision-making process, therefore we at SNS Insider always believe that we should choose the best method which gives us results closer to reality. This allows us to reach at a stage wherein we can provide our clients best and accurate investment to output ratio.

Each report that we prepare takes a timeframe of 350-400 business hours for production. Starting from the selection of titles through a couple of in-depth brain storming session to the final QC process before uploading our titles on our website we dedicate around 350 working hours. The titles are selected based on their current market cap and the foreseen CAGR and growth.


The 5 steps process:

Step 1: Secondary Research:

Secondary Research or Desk Research is as the name suggests is a research process wherein, we collect data through the readily available information. In this process we use various paid and unpaid databases which our team has access to and gather data through the same. This includes examining of listed companies’ annual reports, Journals, SEC filling etc. Apart from this our team has access to various associations across the globe across different industries. Lastly, we have exchange relationships with various university as well as individual libraries.

Secondary Research

Step 2: Primary Research

When we talk about primary research, it is a type of study in which the researchers collect relevant data samples directly, rather than relying on previously collected data.  This type of research is focused on gaining content specific facts that can be sued to solve specific problems. Since the collected data is fresh and first hand therefore it makes the study more accurate and genuine.

We at SNS Insider have divided Primary Research into 2 parts.

Part 1 wherein we interview the KOLs of major players as well as the upcoming ones across various geographic regions. This allows us to have their view over the market scenario and acts as an important tool to come closer to the accurate market numbers. As many as 45 paid and unpaid primary interviews are taken from both the demand and supply side of the industry to make sure we land at an accurate judgement and analysis of the market.

This step involves the triangulation of data wherein our team analyses the interview transcripts, online survey responses and observation of on filed participants. The below mentioned chart should give a better understanding of the part 1 of the primary interview.

Primary Research

Part 2: In this part of primary research the data collected via secondary research and the part 1 of the primary research is validated with the interviews from individual consultants and subject matter experts.

Consultants are those set of people who have at least 12 years of experience and expertise within the industry whereas Subject Matter Experts are those with at least 15 years of experience behind their back within the same space. The data with the help of two main processes i.e., FGDs (Focused Group Discussions) and IDs (Individual Discussions). This gives us a 3rd party nonbiased primary view of the market scenario making it a more dependable one while collation of the data pointers.

Step 3: Data Bank Validation

Once all the information is collected via primary and secondary sources, we run that information for data validation. At our intelligence centre our research heads track a lot of information related to the market which includes the quarterly reports, the daily stock prices, and other relevant information. Our data bank server gets updated every fortnight and that is how the information which we collected using our primary and secondary information is revalidated in real time.

Data Bank Validation

Step 4: QA/QC Process

After all the data collection and validation our team does a final level of quality check and quality assurance to get rid of any unwanted or undesired mistakes. This might include but not limited to getting rid of the any typos, duplication of numbers or missing of any important information. The people involved in this process include technical content writers, research heads and graphics people. Once this process is completed the title gets uploader on our platform for our clients to read it.

Step 5: Final QC/QA Process:

This is the last process and comes when the client has ordered the study. In this process a final QA/QC is done before the study is emailed to the client. Since we believe in giving our clients a good experience of our research studies, therefore, to make sure that we do not lack at our end in any way humanly possible we do a final round of quality check and then dispatch the study to the client.

Key Segments:

By Technology

  • Capacitive Technology

  • Resistive Technology

  • Acoustic Technology

  • Optical

  • Infrared Technology

By Product

  • Smartphones

  • Tablets

  • Laptops

  • Televisions

By End Use

  • Retail

  • Government

  • Enterprise

  • Industrial

  • Commercial

Request for Segment Customization as per your Business Requirement: Segment Customization Request

REGIONAL COVERAGE:

North America

  • US

  • Canada

  • Mexico

Europe

  • Eastern Europe

    • Poland

    • Romania

    • Hungary

    • Turkey

    • Rest of Eastern Europe

  • Western Europe

    • Germany

    • France

    • UK

    • Italy

    • Spain

    • Netherlands

    • Switzerland

    • Austria

    • Rest of Western Europe

Asia Pacific

  • China

  • India

  • Japan

  • South Korea

  • Vietnam

  • Singapore

  • Australia

  • Rest of Asia Pacific

Middle East & Africa

  • Middle East

    • UAE

    • Egypt

    • Saudi Arabia

    • Qatar

    • Rest of the Middle East

  • Africa

    • Nigeria

    • South Africa

    • Rest of Africa

Latin America

  • Brazil

  • Argentina

  • Colombia

  • Rest of Latin America

Request for Country Level Research Report: Country Level Customization Request

Available Customization

With the given market data, SNS Insider offers customization as per the company’s specific needs. The following customization options are available for the report:

  • Product Analysis

  • Criss-Cross segment analysis (e.g. Product X Application)

  • Product Matrix which gives a detailed comparison of the product portfolio of each company

  • Geographic Analysis

  • Additional countries in any of the regions

  • Company Information

  • Detailed analysis and profiling of additional market players (Up to five)


  •            5000 (33% Discount)


  •            8950 (40% Discount)


  •            3050 (23% Discount)

Start a Conversation

Hi! Click one of our member below to chat on Phone