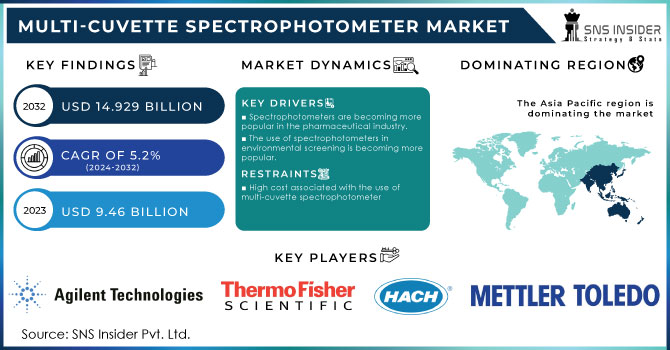
Multi-Cuvette Spectrophotometer Market was valued at USD 8.85 billion in 2023 and is expected to reach USD 14.87 billion by 2032, growing at a CAGR of 5.98% from 2024-2032. This report gives information about the market in key areas, such as supply chain and distribution channels, investment and funding opportunities, regulatory impact, consumer behavior trends, and performance metrics. It focuses on the increasing trend of advanced spectrophotometer technology in the pharmaceutical, biotechnology, and environmental testing sectors, with emphasis on innovations driving the market to grow and meet regulatory requirements for precise analysis.
Get more information on the Multi-Cuvette Spectrophotometer Market - Request Sample Report
Drivers
Technological Advancements in Precision, Automation, and Multi-Cuvette Functionality are Key Growth Factors in the Multi-Cuvette Spectrophotometer Market
Innovations in analytical technology are changing the pace of the Multi-Cuvette Spectrophotometer market through significant boosts in measurement precision, automation, and functionality. Technological advancements in sensor technologies, for example, enhance the accuracy and reliability of the data acquired, increasing the effectiveness of spectrophotometric measurements. Incorporation of automation features speeds up processes and reduces human error, thereby ensuring consistent results across high-throughput applications. Moreover, the ability to use multiple cuvettes simultaneously increases efficiency, making these instruments indispensable for laboratories and industries requiring large-scale testing. These technologies have fulfilled the needs of highly advanced analytical solutions for sectors including pharmaceuticals, biotechnology, and environmental testing and thus became unavoidable tools in the hands of research, quality control, and process monitoring units.
Restraints
Expensive Maintenance and Calibration Efforts Drive Organizations away from Multi-Cuvette Spectrophotometer Use
In many cases, multi-cuvette spectrophotometers will demand significant investments into ongoing maintenance and calibration costs that would sum up the expenses in the end to be substantial for any budgetary restrained organizations. It also means that frequent calibration is a necessity to provide reliable and accurate results, though professional services or specific training may be required in this process, increasing operational costs. Moreover, maintenance of the devices to ensure they remain in proper working order and last for as long as possible increases operational costs. Such expenses can become prohibitively expensive for small laboratories or businesses that must operate within strict budgets. With such hesitation, an organization may prefer multi-cuvette spectrophotometers be a low priority, opting instead for cheaper alternatives with less overhead.
Opportunities
Implementation of Multi-Cuvette Spectrophotometers in Automated Laboratory Systems Increases Capacity and Productivity to Fuel the Market
Integrating multi-cuvette spectrophotometers with automated laboratory systems substantially increases capacity and productivity, driving further market expansion. Automation not only saves labor hours and days, but repetitive processes are handled at a significantly faster pace to enable faster and more consistent testing in high-capacity environments. These spectrophotometers are integrated into fully automated workflows, which means that the processes are streamlined and more precise, with less risk of human error. This synergy is especially valuable in industries like pharmaceuticals, biotechnology, and environmental testing, where rapid and accurate analysis is critical. By facilitating high-throughput testing and minimizing manual intervention, the integration of automation makes multi-cuvette spectrophotometers more appealing for large-scale laboratories, further boosting their adoption and expanding market opportunities.
Challenges
Skilled Personnel Requirements and Operational Complexity Limit Adoption of Multi-Cuvette Spectrophotometers in Smaller Laboratories
The need for skilled personnel to operate multi-cuvette spectrophotometers poses a significant barrier to widespread adoption, particularly in smaller laboratories or organizations with limited technical expertise. These instruments, while highly advanced, require specialized knowledge to ensure accurate operation and maintenance. Without proper training, there's a risk of suboptimal performance or inaccuracy, which would undermine the value. Smaller labs often cannot afford such an investment in training or the hiring of well-trained staff and thus find these highly sophisticated instruments less attractive for adoption. This operational complexity can slow down the growth of the market, especially in regions or industries where access to qualified personnel is limited, thereby restricting the potential user base for multi-cuvette spectrophotometers.
By Component
The Light Source segment held the largest share in the Multi-Cuvette Spectrophotometers Market in 2023, accounting for approximately 29% of the revenue share, because it is a critical component in spectrophotometry that offers stable and consistent light for measurements. The Software segment will be growing with the fastest CAGR of approximately 7.53% over the forecasted period of 2024 to 2032, due to rising demand for advanced software that provides better analytics, automation capabilities, and integrates with other systems used in laboratory, thereby reducing errors and inaccuracies
By Product Type
The UV-Visible Spectrophotometers segment held the highest revenue share of around 45% in the Multi-Cuvette Spectrophotometers Market in 2023, as these instruments are highly utilized due to their ability to measure absorbance range across a wide spectrum of samples, and thus, are highly required by industries such as pharmaceuticals, biotechnology, and environmental testing. The Fluorescence Spectrophotometers segment is expected to grow at the fastest CAGR of about 7.65% from 2024-2032, driven by increasing demand for highly sensitive detection methods in applications like medical diagnostics and research.
By Application
The Life Sciences and Biotechnology segment accounted for the highest revenue share of around 31% in 2023 in the Multi-Cuvette Spectrophotometers Market, as the demand for precise analytical tools in research, genomics, and protein analysis is on the rise. The Pharmaceuticals segment is going to expand with the fastest CAGR around 7.49% during 2024-2032, as there is growing demand of spectrophotometric analysis in drug development, quality control and clinical testing, as the pharmaceutical industry is interested in accuracy coupled with regulatory compliance.
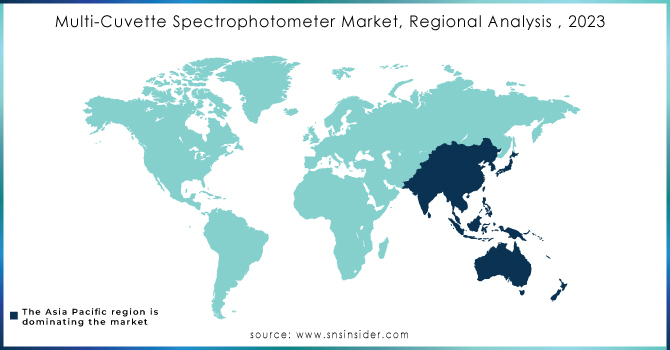
North America dominated the Multi-Cuvette Spectrophotometers Market in 2023 with the highest revenue share of about 35%, driven by the region's strong presence in research and development across biotechnology, pharmaceuticals, and healthcare sectors. The advanced infrastructure, well-established academic institutions, and high demand for precise analytical tools for drug testing, clinical research, and quality control contribute to its market leadership. Additionally, stringent regulatory standards in the region further amplify the need for reliable and accurate measurement instruments.
Asia Pacific is likely to grow at the fastest CAGR of about 7.77% from 2024-2032 due to fast industrialization and growing investment in healthcare, biotechnology, and pharmaceuticals. The upsurge in efforts to upgrade healthcare infrastructure, growth in research activities, and advancements in regulatory practices are all merging into a scenario that is propitious to the adoption of multi-cuvette spectrophotometers. The burgeoning pharmaceutical market in countries like China and India continues to drive demand for advanced analytical solutions, making Asia Pacific the fastest-growing region within the market.
Get Customized Report as per your Business Requirement - Request For Customized Report
PerkinElmer (Lambda 365 UV/Vis Spectrophotometer, Victor Nivo Microplate Reader)
Eppendorf (BioSpectrometer Basic, BioPhotometer)
Shimadzu Corporation (UV-1800 UV-Vis Spectrophotometer, UV-2600 UV-Vis Spectrophotometer)
Hach Company (DR 1900 Portable Spectrophotometer, DR6000 UV-Vis Spectrophotometer)
Xylem (ABS 200 Spectrophotometer, DS5.0 Spectrophotometer)
Horiba (U-2900 UV-Vis Spectrophotometer, FT-IR Spectrometer)
Hitachi HighTech (U-2900 UV-Vis Spectrophotometer, UH-4150 UV-Vis Spectrophotometer)
Jasco (V-630 UV-Vis Spectrophotometer, V-730 UV-Vis Spectrophotometer)
Agilent Technologies (Cary 60 UV-Vis Spectrophotometer, Cary 3500 UV-Vis Spectrophotometer)
Beckman Coulter (DU 800 UV-Vis Spectrophotometer, DU 730 Life Science UV-Vis Spectrophotometer)
Miltenyi Biotec (MACSQuant VYB, MACSQuant Analyzer 10)
Mettler Toledo (SevenExcellence pH/Ion/Conductivity Meter, UV5 Spectrophotometer)
Bruker (Optics FT-IR Spectrophotometer, ALPHA II FT-IR Spectrometer)
Thermo Fisher Scientific (Nicolet iS50 FT-IR Spectrometer, Evolution 260 Bio UV-Vis Spectrophotometer)
BioRad Laboratories (SmartSpec Plus Spectrophotometer, NanoDrop One Microvolume UV-Vis Spectrophotometer)
ABB (UV-VIS Spectrophotometer, ACS800 UV Spectrometer)
Bausch & Lomb (Spectronic 200 Spectrophotometer, Spectronic 1201)
Oxford Instruments (FQS Series UV-Vis Spectrophotometer, X-Strahl UV Spectrometer)
Analytik Jena (Specord 200 UV-Vis Spectrophotometer, Specord 210 Plus)
Thermo Fisher Scientific (UV-Vis Spectrophotometer NanoDrop 8000, Thermo Scientific Genesys 30)
JASCO (V-570 UV-Vis-NIR Spectrophotometer, V-730 UV-Vis Spectrophotometer)
Teledyne Leeman Labs (Proton 4000 UV-Vis Spectrophotometer, SOLA UV-Vis Spectrophotometer)
In 2023, Shimadzu Corporation introduced the SolidSpec-3700i and SolidSpec-3700i DUV UV-Vis-NIR Spectrophotometers, which offer high sensitivity and wide measurement range, catering to industries such as optical, semiconductor, and flat-panel displays.
In 2024, Agilent Technologies launched the Cary 3500 Compact UV-Vis Spectrophotometer, offering high-performance measurements with a focus on sustainability and achieving the My Green Lab’s ACT label for environmental impact.
| Report Attributes | Details |
|---|---|
| Market Size in 2023 | USD 8.85 Billion |
| Market Size by 2032 | USD 14.87 Billion |
| CAGR | CAGR of 5.98% From 2024 to 2032 |
| Base Year | 2023 |
| Forecast Period | 2024-2032 |
| Historical Data | 2020-2022 |
| Report Scope & Coverage | Market Size, Segments Analysis, Competitive Landscape, Regional Analysis, DROC & SWOT Analysis, Forecast Outlook |
| Key Segments | • By Product Type (UV-Visible Spectrophotometers, Fluorescence Spectrophotometers, IR Spectrophotometers, Others) • By Component (Light Source, Detectors, Software, Cuvette Holders, Others) • By Application (Life Sciences and Biotechnology, Pharmaceuticals, Chemical Industry, Environmental Testing, Food and Beverage Industry, Academic and Research Institutes) |
| Regional Analysis/Coverage | North America (US, Canada, Mexico), Europe (Eastern Europe [Poland, Romania, Hungary, Turkey, Rest of Eastern Europe] Western Europe] Germany, France, UK, Italy, Spain, Netherlands, Switzerland, Austria, Rest of Western Europe]), Asia Pacific (China, India, Japan, South Korea, Vietnam, Singapore, Australia, Rest of Asia Pacific), Middle East & Africa (Middle East [UAE, Egypt, Saudi Arabia, Qatar, Rest of Middle East], Africa [Nigeria, South Africa, Rest of Africa], Latin America (Brazil, Argentina, Colombia, Rest of Latin America) |
| Company Profiles | PerkinElmer, Eppendorf, Shimadzu Corporation, Hach, Xylem, Horiba, Hitachi HighTech, Jasco, Agilent Technologies, Beckman Coulter, Miltenyi Biotec, Mettler Toledo, Bruker, Thermo Fisher Scientific, BioRad Laboratories, ABB, Bausch & Lomb, Oxford Instruments, Analytik Jena, Teledyne Leeman Labs |
ANS: Multi-Cuvette Spectrophotometer Market was valued at USD 8.85 billion in 2023 and is expected to reach USD 14.87 billion by 2032, growing at a CAGR of 5.98% from 2024-2032.
ANS: The UV-Visible Spectrophotometers segment held the highest revenue share of around 45%.
ANS: The Life Sciences and Biotechnology segment accounted for the highest revenue share of around 31%.
ANS: Asia Pacific is expected to grow at the fastest CAGR of about 7.77% from 2024 to 2032.
ANS: Technological advancements in precision, automation, and multi-cuvette functionality are key drivers.
Table of Contents
1. Introduction
1.1 Market Definition
1.2 Scope (Inclusion and Exclusions)
1.3 Research Assumptions
2. Executive Summary
2.1 Market Overview
2.2 Regional Synopsis
2.3 Competitive Summary
3. Research Methodology
3.1 Top-Down Approach
3.2 Bottom-up Approach
3.3. Data Validation
3.4 Primary Interviews
4. Market Dynamics Impact Analysis
4.1 Market Driving Factors Analysis
4.1.1 Drivers
4.1.2 Restraints
4.1.3 Opportunities
4.1.4 Challenges
4.2 PESTLE Analysis
4.3 Porter’s Five Forces Model
5. Statistical Insights and Trends Reporting
5.1 Supply Chain and Distribution Channels
5.2 Investment and Funding
5.3 Regulatory Impact
5.4 Consumer Behavior Insights
5.5 Performance Metrics
6. Competitive Landscape
6.1 List of Major Companies, By Region
6.2 Market Share Analysis, By Region
6.3 Product Benchmarking
6.3.1 Product specifications and features
6.3.2 Pricing
6.4 Strategic Initiatives
6.4.1 Marketing and promotional activities
6.4.2 Distribution and supply chain strategies
6.4.3 Expansion plans and new product launches
6.4.4 Strategic partnerships and collaborations
6.5 Technological Advancements
6.6 Market Positioning and Branding
7. Multi-Cuvette Spectrophotometer Market Segmentation, By Product Type
7.1 Chapter Overview
7.2 UV-Visible Spectrophotometers
7.2.1 UV-Visible Spectrophotometers Market Trends Analysis (2020-2032)
7.2.2 UV-Visible Spectrophotometers Market Size Estimates and Forecasts to 2032 (USD Billion)
7.3 Fluorescence Spectrophotometers
7.3.1 Fluorescence Spectrophotometers Market Trends Analysis (2020-2032)
7.3.2 Fluorescence Spectrophotometers Market Size Estimates and Forecasts to 2032 (USD Billion)
7.4 IR Spectrophotometers
7.4.1 IR Spectrophotometers Market Trends Analysis (2020-2032)
7.4.2 IR Spectrophotometers Market Size Estimates and Forecasts to 2032 (USD Billion)
7.5 Others
7.5.1 Others Market Trends Analysis (2020-2032)
7.5.2 Others Market Size Estimates and Forecasts to 2032 (USD Billion)
8. Multi-Cuvette Spectrophotometer Market Segmentation, By Application
8.1 Chapter Overview
8.2 Life Sciences and Biotechnology
8.2.1 Life Sciences and Biotechnology Market Trends Analysis (2020-2032)
8.2.2 Life Sciences and Biotechnology Market Size Estimates and Forecasts to 2032 (USD Billion)
8.3 Pharmaceuticals
8.3.1 Pharmaceuticals Market Trends Analysis (2020-2032)
8.3.2 Pharmaceuticals Market Size Estimates and Forecasts to 2032 (USD Billion)
8.4 Chemical Industry
8.4.1 Chemical Industry Market Trends Analysis (2020-2032)
8.4.2 Chemical Industry Market Size Estimates and Forecasts to 2032 (USD Billion)
8.5 Environmental Testing
8.5.1 Environmental Testing Market Trends Analysis (2020-2032)
8.5.2 Environmental Testing Market Size Estimates and Forecasts to 2032 (USD Billion)
8.6 Food and Beverage Industry
8.6.1 Food and Beverage Industry Market Trends Analysis (2020-2032)
8.6.2 Food and Beverage Industry Market Size Estimates and Forecasts to 2032 (USD Billion)
8.7 Academic and Research Institutes
8.7.1 Academic and Research Institutes Market Trends Analysis (2020-2032)
8.7.2 Academic and Research Institutes Market Size Estimates and Forecasts to 2032 (USD Billion)
9. Multi-Cuvette Spectrophotometer Market Segmentation, By Component
9.1 Chapter Overview
9.2 Light Source
9.2.1 Light Source Market Trends Analysis (2020-2032)
9.2.2 Light Source Market Size Estimates and Forecasts to 2032 (USD Billion)
9.3 Detectors
9.3.1 Detectors Market Trends Analysis (2020-2032)
9.3.2 Detectors Market Size Estimates and Forecasts to 2032 (USD Billion)
9.4 Software
9.4.1 Software Market Trends Analysis (2020-2032)
9.4.2 Software Market Size Estimates and Forecasts to 2032 (USD Billion)
9.5 Cuvette Holders
9.5.1 Cuvette Holders Market Trends Analysis (2020-2032)
9.5.2 Cuvette Holders Market Size Estimates and Forecasts to 2032 (USD Billion)
9.6 Others
9.6.1 Others Market Trends Analysis (2020-2032)
9.6.2 Others Market Size Estimates and Forecasts to 2032 (USD Billion)
10. Regional Analysis
10.1 Chapter Overview
10.2 North America
10.2.1 Trends Analysis
10.2.2 North America Multi-Cuvette Spectrophotometer Market Estimates and Forecasts, by Country (2020-2032) (USD Billion)
10.2.3 North America Multi-Cuvette Spectrophotometer Market Estimates and Forecasts, By Product Type (2020-2032) (USD Billion)
10.2.4 North America Multi-Cuvette Spectrophotometer Market Estimates and Forecasts, By Application (2020-2032) (USD Billion)
10.2.5 North America Multi-Cuvette Spectrophotometer Market Estimates and Forecasts, By Component (2020-2032) (USD Billion)
10.2.6 USA
10.2.6.1 USA Multi-Cuvette Spectrophotometer Market Estimates and Forecasts, By Product Type (2020-2032) (USD Billion)
10.2.6.2 USA Multi-Cuvette Spectrophotometer Market Estimates and Forecasts, By Application (2020-2032) (USD Billion)
10.2.6.3 USA Multi-Cuvette Spectrophotometer Market Estimates and Forecasts, By Component (2020-2032) (USD Billion)
10.2.7 Canada
10.2.7.1 Canada Multi-Cuvette Spectrophotometer Market Estimates and Forecasts, By Product Type (2020-2032) (USD Billion)
10.2.7.2 Canada Multi-Cuvette Spectrophotometer Market Estimates and Forecasts, By Application (2020-2032) (USD Billion)
10.2.7.3 Canada Multi-Cuvette Spectrophotometer Market Estimates and Forecasts, By Component (2020-2032) (USD Billion)
10.2.8 Mexico
10.2.8.1 Mexico Multi-Cuvette Spectrophotometer Market Estimates and Forecasts, By Product Type (2020-2032) (USD Billion)
10.2.8.2 Mexico Multi-Cuvette Spectrophotometer Market Estimates and Forecasts, By Application (2020-2032) (USD Billion)
10.2.8.3 Mexico Multi-Cuvette Spectrophotometer Market Estimates and Forecasts, By Component (2020-2032) (USD Billion)
10.3 Europe
10.3.1 Eastern Europe
10.3.1.1 Trends Analysis
10.3.1.2 Eastern Europe Multi-Cuvette Spectrophotometer Market Estimates and Forecasts, by Country (2020-2032) (USD Billion)
10.3.1.3 Eastern Europe Multi-Cuvette Spectrophotometer Market Estimates and Forecasts, By Product Type (2020-2032) (USD Billion)
10.3.1.4 Eastern Europe Multi-Cuvette Spectrophotometer Market Estimates and Forecasts, By Application (2020-2032) (USD Billion)
10.3.1.5 Eastern Europe Multi-Cuvette Spectrophotometer Market Estimates and Forecasts, By Component (2020-2032) (USD Billion)
10.3.1.6 Poland
10.3.1.6.1 Poland Multi-Cuvette Spectrophotometer Market Estimates and Forecasts, By Product Type (2020-2032) (USD Billion)
10.3.1.6.2 Poland Multi-Cuvette Spectrophotometer Market Estimates and Forecasts, By Application (2020-2032) (USD Billion)
10.3.1.6.3 Poland Multi-Cuvette Spectrophotometer Market Estimates and Forecasts, By Component (2020-2032) (USD Billion)
10.3.1.7 Romania
10.3.1.7.1 Romania Multi-Cuvette Spectrophotometer Market Estimates and Forecasts, By Product Type (2020-2032) (USD Billion)
10.3.1.7.2 Romania Multi-Cuvette Spectrophotometer Market Estimates and Forecasts, By Application (2020-2032) (USD Billion)
10.3.1.7.3 Romania Multi-Cuvette Spectrophotometer Market Estimates and Forecasts, By Component (2020-2032) (USD Billion)
10.3.1.8 Hungary
10.3.1.8.1 Hungary Multi-Cuvette Spectrophotometer Market Estimates and Forecasts, By Product Type (2020-2032) (USD Billion)
10.3.1.8.2 Hungary Multi-Cuvette Spectrophotometer Market Estimates and Forecasts, By Application (2020-2032) (USD Billion)
10.3.1.8.3 Hungary Multi-Cuvette Spectrophotometer Market Estimates and Forecasts, By Component (2020-2032) (USD Billion)
10.3.1.9 Turkey
10.3.1.9.1 Turkey Multi-Cuvette Spectrophotometer Market Estimates and Forecasts, By Product Type (2020-2032) (USD Billion)
10.3.1.9.2 Turkey Multi-Cuvette Spectrophotometer Market Estimates and Forecasts, By Application (2020-2032) (USD Billion)
10.3.1.9.3 Turkey Multi-Cuvette Spectrophotometer Market Estimates and Forecasts, By Component (2020-2032) (USD Billion)
10.3.1.10 Rest of Eastern Europe
10.3.1.10.1 Rest of Eastern Europe Multi-Cuvette Spectrophotometer Market Estimates and Forecasts, By Product Type (2020-2032) (USD Billion)
10.3.1.10.2 Rest of Eastern Europe Multi-Cuvette Spectrophotometer Market Estimates and Forecasts, By Application (2020-2032) (USD Billion)
10.3.1.10.3 Rest of Eastern Europe Multi-Cuvette Spectrophotometer Market Estimates and Forecasts, By Component (2020-2032) (USD Billion)
10.3.2 Western Europe
10.3.2.1 Trends Analysis
10.3.2.2 Western Europe Multi-Cuvette Spectrophotometer Market Estimates and Forecasts, by Country (2020-2032) (USD Billion)
10.3.2.3 Western Europe Multi-Cuvette Spectrophotometer Market Estimates and Forecasts, By Product Type (2020-2032) (USD Billion)
10.3.2.4 Western Europe Multi-Cuvette Spectrophotometer Market Estimates and Forecasts, By Application (2020-2032) (USD Billion)
10.3.2.5 Western Europe Multi-Cuvette Spectrophotometer Market Estimates and Forecasts, By Component (2020-2032) (USD Billion)
10.3.2.6 Germany
10.3.2.6.1 Germany Multi-Cuvette Spectrophotometer Market Estimates and Forecasts, By Product Type (2020-2032) (USD Billion)
10.3.2.6.2 Germany Multi-Cuvette Spectrophotometer Market Estimates and Forecasts, By Application (2020-2032) (USD Billion)
10.3.2.6.3 Germany Multi-Cuvette Spectrophotometer Market Estimates and Forecasts, By Component (2020-2032) (USD Billion)
10.3.2.7 France
10.3.2.7.1 France Multi-Cuvette Spectrophotometer Market Estimates and Forecasts, By Product Type (2020-2032) (USD Billion)
10.3.2.7.2 France Multi-Cuvette Spectrophotometer Market Estimates and Forecasts, By Application (2020-2032) (USD Billion)
10.3.2.7.3 France Multi-Cuvette Spectrophotometer Market Estimates and Forecasts, By Component (2020-2032) (USD Billion)
10.3.2.8 UK
10.3.2.8.1 UK Multi-Cuvette Spectrophotometer Market Estimates and Forecasts, By Product Type (2020-2032) (USD Billion)
10.3.2.8.2 UK Multi-Cuvette Spectrophotometer Market Estimates and Forecasts, By Application (2020-2032) (USD Billion)
10.3.2.8.3 UK Multi-Cuvette Spectrophotometer Market Estimates and Forecasts, By Component (2020-2032) (USD Billion)
10.3.2.9 Italy
10.3.2.9.1 Italy Multi-Cuvette Spectrophotometer Market Estimates and Forecasts, By Product Type (2020-2032) (USD Billion)
10.3.2.9.2 Italy Multi-Cuvette Spectrophotometer Market Estimates and Forecasts, By Application (2020-2032) (USD Billion)
10.3.2.9.3 Italy Multi-Cuvette Spectrophotometer Market Estimates and Forecasts, By Component (2020-2032) (USD Billion)
10.3.2.10 Spain
10.3.2.10.1 Spain Multi-Cuvette Spectrophotometer Market Estimates and Forecasts, By Product Type (2020-2032) (USD Billion)
10.3.2.10.2 Spain Multi-Cuvette Spectrophotometer Market Estimates and Forecasts, By Application (2020-2032) (USD Billion)
10.3.2.10.3 Spain Multi-Cuvette Spectrophotometer Market Estimates and Forecasts, By Component (2020-2032) (USD Billion)
10.3.2.11 Netherlands
10.3.2.11.1 Netherlands Multi-Cuvette Spectrophotometer Market Estimates and Forecasts, By Product Type (2020-2032) (USD Billion)
10.3.2.11.2 Netherlands Multi-Cuvette Spectrophotometer Market Estimates and Forecasts, By Application (2020-2032) (USD Billion)
10.3.2.11.3 Netherlands Multi-Cuvette Spectrophotometer Market Estimates and Forecasts, By Component (2020-2032) (USD Billion)
10.3.2.12 Switzerland
10.3.2.12.1 Switzerland Multi-Cuvette Spectrophotometer Market Estimates and Forecasts, By Product Type (2020-2032) (USD Billion)
10.3.2.12.2 Switzerland Multi-Cuvette Spectrophotometer Market Estimates and Forecasts, By Application (2020-2032) (USD Billion)
10.3.2.12.3 Switzerland Multi-Cuvette Spectrophotometer Market Estimates and Forecasts, By Component (2020-2032) (USD Billion)
10.3.2.13 Austria
10.3.2.13.1 Austria Multi-Cuvette Spectrophotometer Market Estimates and Forecasts, By Product Type (2020-2032) (USD Billion)
10.3.2.13.2 Austria Multi-Cuvette Spectrophotometer Market Estimates and Forecasts, By Application (2020-2032) (USD Billion)
10.3.2.13.3 Austria Multi-Cuvette Spectrophotometer Market Estimates and Forecasts, By Component (2020-2032) (USD Billion)
10.3.2.14 Rest of Western Europe
10.3.2.14.1 Rest of Western Europe Multi-Cuvette Spectrophotometer Market Estimates and Forecasts, By Product Type (2020-2032) (USD Billion)
10.3.2.14.2 Rest of Western Europe Multi-Cuvette Spectrophotometer Market Estimates and Forecasts, By Application (2020-2032) (USD Billion)
10.3.2.14.3 Rest of Western Europe Multi-Cuvette Spectrophotometer Market Estimates and Forecasts, By Component (2020-2032) (USD Billion)
10.4 Asia Pacific
10.4.1 Trends Analysis
10.4.2 Asia Pacific Multi-Cuvette Spectrophotometer Market Estimates and Forecasts, by Country (2020-2032) (USD Billion)
10.4.3 Asia Pacific Multi-Cuvette Spectrophotometer Market Estimates and Forecasts, By Product Type (2020-2032) (USD Billion)
10.4.4 Asia Pacific Multi-Cuvette Spectrophotometer Market Estimates and Forecasts, By Application (2020-2032) (USD Billion)
10.4.5 Asia Pacific Multi-Cuvette Spectrophotometer Market Estimates and Forecasts, By Component (2020-2032) (USD Billion)
10.4.6 China
10.4.6.1 China Multi-Cuvette Spectrophotometer Market Estimates and Forecasts, By Product Type (2020-2032) (USD Billion)
10.4.6.2 China Multi-Cuvette Spectrophotometer Market Estimates and Forecasts, By Application (2020-2032) (USD Billion)
10.4.6.3 China Multi-Cuvette Spectrophotometer Market Estimates and Forecasts, By Component (2020-2032) (USD Billion)
10.4.7 India
10.4.7.1 India Multi-Cuvette Spectrophotometer Market Estimates and Forecasts, By Product Type (2020-2032) (USD Billion)
10.4.7.2 India Multi-Cuvette Spectrophotometer Market Estimates and Forecasts, By Application (2020-2032) (USD Billion)
10.4.7.3 India Multi-Cuvette Spectrophotometer Market Estimates and Forecasts, By Component (2020-2032) (USD Billion)
10.4.8 Japan
10.4.8.1 Japan Multi-Cuvette Spectrophotometer Market Estimates and Forecasts, By Product Type (2020-2032) (USD Billion)
10.4.8.2 Japan Multi-Cuvette Spectrophotometer Market Estimates and Forecasts, By Application (2020-2032) (USD Billion)
10.4.8.3 Japan Multi-Cuvette Spectrophotometer Market Estimates and Forecasts, By Component (2020-2032) (USD Billion)
10.4.9 South Korea
10.4.9.1 South Korea Multi-Cuvette Spectrophotometer Market Estimates and Forecasts, By Product Type (2020-2032) (USD Billion)
10.4.9.2 South Korea Multi-Cuvette Spectrophotometer Market Estimates and Forecasts, By Application (2020-2032) (USD Billion)
10.4.9.3 South Korea Multi-Cuvette Spectrophotometer Market Estimates and Forecasts, By Component (2020-2032) (USD Billion)
10.4.10 Vietnam
10.4.10.1 Vietnam Multi-Cuvette Spectrophotometer Market Estimates and Forecasts, By Product Type (2020-2032) (USD Billion)
10.4.10.2 Vietnam Multi-Cuvette Spectrophotometer Market Estimates and Forecasts, By Application (2020-2032) (USD Billion)
10.4.10.3 Vietnam Multi-Cuvette Spectrophotometer Market Estimates and Forecasts, By Component (2020-2032) (USD Billion)
10.4.11 Singapore
10.4.11.1 Singapore Multi-Cuvette Spectrophotometer Market Estimates and Forecasts, By Product Type (2020-2032) (USD Billion)
10.4.11.2 Singapore Multi-Cuvette Spectrophotometer Market Estimates and Forecasts, By Application (2020-2032) (USD Billion)
10.4.11.3 Singapore Multi-Cuvette Spectrophotometer Market Estimates and Forecasts, By Component (2020-2032) (USD Billion)
10.4.12 Australia
10.4.12.1 Australia Multi-Cuvette Spectrophotometer Market Estimates and Forecasts, By Product Type (2020-2032) (USD Billion)
10.4.12.2 Australia Multi-Cuvette Spectrophotometer Market Estimates and Forecasts, By Application (2020-2032) (USD Billion)
10.4.12.3 Australia Multi-Cuvette Spectrophotometer Market Estimates and Forecasts, By Component (2020-2032) (USD Billion)
10.4.13 Rest of Asia Pacific
10.4.13.1 Rest of Asia Pacific Multi-Cuvette Spectrophotometer Market Estimates and Forecasts, By Product Type (2020-2032) (USD Billion)
10.4.13.2 Rest of Asia Pacific Multi-Cuvette Spectrophotometer Market Estimates and Forecasts, By Application (2020-2032) (USD Billion)
10.4.13.3 Rest of Asia Pacific Multi-Cuvette Spectrophotometer Market Estimates and Forecasts, By Component (2020-2032) (USD Billion)
10.5 Middle East and Africa
10.5.1 Middle East
10.5.1.1 Trends Analysis
10.5.1.2 Middle East Multi-Cuvette Spectrophotometer Market Estimates and Forecasts, by Country (2020-2032) (USD Billion)
10.5.1.3 Middle East Multi-Cuvette Spectrophotometer Market Estimates and Forecasts, By Product Type (2020-2032) (USD Billion)
10.5.1.4 Middle East Multi-Cuvette Spectrophotometer Market Estimates and Forecasts, By Application (2020-2032) (USD Billion)
10.5.1.5 Middle East Multi-Cuvette Spectrophotometer Market Estimates and Forecasts, By Component (2020-2032) (USD Billion)
10.5.1.6 UAE
10.5.1.6.1 UAE Multi-Cuvette Spectrophotometer Market Estimates and Forecasts, By Product Type (2020-2032) (USD Billion)
10.5.1.6.2 UAE Multi-Cuvette Spectrophotometer Market Estimates and Forecasts, By Application (2020-2032) (USD Billion)
10.5.1.6.3 UAE Multi-Cuvette Spectrophotometer Market Estimates and Forecasts, By Component (2020-2032) (USD Billion)
10.5.1.7 Egypt
10.5.1.7.1 Egypt Multi-Cuvette Spectrophotometer Market Estimates and Forecasts, By Product Type (2020-2032) (USD Billion)
10.5.1.7.2 Egypt Multi-Cuvette Spectrophotometer Market Estimates and Forecasts, By Application (2020-2032) (USD Billion)
10.5.1.7.3 Egypt Multi-Cuvette Spectrophotometer Market Estimates and Forecasts, By Component (2020-2032) (USD Billion)
10.5.1.8 Saudi Arabia
10.5.1.8.1 Saudi Arabia Multi-Cuvette Spectrophotometer Market Estimates and Forecasts, By Product Type (2020-2032) (USD Billion)
10.5.1.8.2 Saudi Arabia Multi-Cuvette Spectrophotometer Market Estimates and Forecasts, By Application (2020-2032) (USD Billion)
10.5.1.8.3 Saudi Arabia Multi-Cuvette Spectrophotometer Market Estimates and Forecasts, By Component (2020-2032) (USD Billion)
10.5.1.9 Qatar
10.5.1.9.1 Qatar Multi-Cuvette Spectrophotometer Market Estimates and Forecasts, By Product Type (2020-2032) (USD Billion)
10.5.1.9.2 Qatar Multi-Cuvette Spectrophotometer Market Estimates and Forecasts, By Application (2020-2032) (USD Billion)
10.5.1.9.3 Qatar Multi-Cuvette Spectrophotometer Market Estimates and Forecasts, By Component (2020-2032) (USD Billion)
10.5.1.10 Rest of Middle East
10.5.1.10.1 Rest of Middle East Multi-Cuvette Spectrophotometer Market Estimates and Forecasts, By Product Type (2020-2032) (USD Billion)
10.5.1.10.2 Rest of Middle East Multi-Cuvette Spectrophotometer Market Estimates and Forecasts, By Application (2020-2032) (USD Billion)
10.5.1.10.3 Rest of Middle East Multi-Cuvette Spectrophotometer Market Estimates and Forecasts, By Component (2020-2032) (USD Billion)
10.5.2 Africa
10.5.2.1 Trends Analysis
10.5.2.2 Africa Multi-Cuvette Spectrophotometer Market Estimates and Forecasts, by Country (2020-2032) (USD Billion)
10.5.2.3 Africa Multi-Cuvette Spectrophotometer Market Estimates and Forecasts, By Product Type (2020-2032) (USD Billion)
10.5.2.4 Africa Multi-Cuvette Spectrophotometer Market Estimates and Forecasts, By Application (2020-2032) (USD Billion)
10.5.2.5 Africa Multi-Cuvette Spectrophotometer Market Estimates and Forecasts, By Component (2020-2032) (USD Billion)
10.5.2.6 South Africa
10.5.2.6.1 South Africa Multi-Cuvette Spectrophotometer Market Estimates and Forecasts, By Product Type (2020-2032) (USD Billion)
10.5.2.6.2 South Africa Multi-Cuvette Spectrophotometer Market Estimates and Forecasts, By Application (2020-2032) (USD Billion)
10.5.2.6.3 South Africa Multi-Cuvette Spectrophotometer Market Estimates and Forecasts, By Component (2020-2032) (USD Billion)
10.5.2.7 Nigeria
10.5.2.7.1 Nigeria Multi-Cuvette Spectrophotometer Market Estimates and Forecasts, By Product Type (2020-2032) (USD Billion)
10.5.2.7.2 Nigeria Multi-Cuvette Spectrophotometer Market Estimates and Forecasts, By Application (2020-2032) (USD Billion)
10.5.2.7.3 Nigeria Multi-Cuvette Spectrophotometer Market Estimates and Forecasts, By Component (2020-2032) (USD Billion)
10.5.2.8 Rest of Africa
10.5.2.8.1 Rest of Africa Multi-Cuvette Spectrophotometer Market Estimates and Forecasts, By Product Type (2020-2032) (USD Billion)
10.5.2.8.2 Rest of Africa Multi-Cuvette Spectrophotometer Market Estimates and Forecasts, By Application (2020-2032) (USD Billion)
10.5.2.8.3 Rest of Africa Multi-Cuvette Spectrophotometer Market Estimates and Forecasts, By Component (2020-2032) (USD Billion)
10.6 Latin America
10.6.1 Trends Analysis
10.6.2 Latin America Multi-Cuvette Spectrophotometer Market Estimates and Forecasts, by Country (2020-2032) (USD Billion)
10.6.3 Latin America Multi-Cuvette Spectrophotometer Market Estimates and Forecasts, By Product Type (2020-2032) (USD Billion)
10.6.4 Latin America Multi-Cuvette Spectrophotometer Market Estimates and Forecasts, By Application (2020-2032) (USD Billion)
10.6.5 Latin America Multi-Cuvette Spectrophotometer Market Estimates and Forecasts, By Component (2020-2032) (USD Billion)
10.6.6 Brazil
10.6.6.1 Brazil Multi-Cuvette Spectrophotometer Market Estimates and Forecasts, By Product Type (2020-2032) (USD Billion)
10.6.6.2 Brazil Multi-Cuvette Spectrophotometer Market Estimates and Forecasts, By Application (2020-2032) (USD Billion)
10.6.6.3 Brazil Multi-Cuvette Spectrophotometer Market Estimates and Forecasts, By Component (2020-2032) (USD Billion)
10.6.7 Argentina
10.6.7.1 Argentina Multi-Cuvette Spectrophotometer Market Estimates and Forecasts, By Product Type (2020-2032) (USD Billion)
10.6.7.2 Argentina Multi-Cuvette Spectrophotometer Market Estimates and Forecasts, By Application (2020-2032) (USD Billion)
10.6.7.3 Argentina Multi-Cuvette Spectrophotometer Market Estimates and Forecasts, By Component (2020-2032) (USD Billion)
10.6.8 Colombia
10.6.8.1 Colombia Multi-Cuvette Spectrophotometer Market Estimates and Forecasts, By Product Type (2020-2032) (USD Billion)
10.6.8.2 Colombia Multi-Cuvette Spectrophotometer Market Estimates and Forecasts, By Application (2020-2032) (USD Billion)
10.6.8.3 Colombia Multi-Cuvette Spectrophotometer Market Estimates and Forecasts, By Component (2020-2032) (USD Billion)
10.6.9 Rest of Latin America
10.6.9.1 Rest of Latin America Multi-Cuvette Spectrophotometer Market Estimates and Forecasts, By Product Type (2020-2032) (USD Billion)
10.6.9.2 Rest of Latin America Multi-Cuvette Spectrophotometer Market Estimates and Forecasts, By Application (2020-2032) (USD Billion)
10.6.9.3 Rest of Latin America Multi-Cuvette Spectrophotometer Market Estimates and Forecasts, By Component (2020-2032) (USD Billion)
11. Company Profiles
11.1 PerkinElmer
11.1.1 Company Overview
11.1.2 Financial
11.1.3 Products/ Services Offered
11.1.4 SWOT Analysis
11.2 Eppendorf
11.2.1 Company Overview
11.2.2 Financial
11.2.3 Products/ Services Offered
11.2.4 SWOT Analysis
11.3 Shimadzu Corporation
11.3.1 Company Overview
11.3.2 Financial
11.3.3 Products/ Services Offered
11.3.4 SWOT Analysis
11.4 Hach
11.4.1 Company Overview
11.4.2 Financial
11.4.3 Products/ Services Offered
11.4.4 SWOT Analysis
11.5 Xylem
11.5.1 Company Overview
11.5.2 Financial
11.5.3 Products/ Services Offered
11.5.4 SWOT Analysis
11.6 Horiba
11.6.1 Company Overview
11.6.2 Financial
11.6.3 Products/ Services Offered
11.6.4 SWOT Analysis
11.7 Hitachi HighTech
11.7.1 Company Overview
11.7.2 Financial
11.7.3 Products/ Services Offered
11.7.4 SWOT Analysis
11.8 Jasco
11.8.1 Company Overview
11.8.2 Financial
11.8.3 Products/ Services Offered
11.8.4 SWOT Analysis
11.9 Agilent Technologies
11.9.1 Company Overview
11.9.2 Financial
11.9.3 Products/ Services Offered
11.9.4 SWOT Analysis
11.10 Beckman Coulter
11.10.1 Company Overview
11.10.2 Financial
11.10.3 Products/ Services Offered
11.10.4 SWOT Analysis
12. Use Cases and Best Practices
13. Conclusion
12. Use Cases and Best Practices
13. Conclusion
An accurate research report requires proper strategizing as well as implementation. There are multiple factors involved in the completion of good and accurate research report and selecting the best methodology to compete the research is the toughest part. Since the research reports we provide play a crucial role in any company’s decision-making process, therefore we at SNS Insider always believe that we should choose the best method which gives us results closer to reality. This allows us to reach at a stage wherein we can provide our clients best and accurate investment to output ratio.
Each report that we prepare takes a timeframe of 350-400 business hours for production. Starting from the selection of titles through a couple of in-depth brain storming session to the final QC process before uploading our titles on our website we dedicate around 350 working hours. The titles are selected based on their current market cap and the foreseen CAGR and growth.
The 5 steps process:
Step 1: Secondary Research:
Secondary Research or Desk Research is as the name suggests is a research process wherein, we collect data through the readily available information. In this process we use various paid and unpaid databases which our team has access to and gather data through the same. This includes examining of listed companies’ annual reports, Journals, SEC filling etc. Apart from this our team has access to various associations across the globe across different industries. Lastly, we have exchange relationships with various university as well as individual libraries.

Step 2: Primary Research
When we talk about primary research, it is a type of study in which the researchers collect relevant data samples directly, rather than relying on previously collected data. This type of research is focused on gaining content specific facts that can be sued to solve specific problems. Since the collected data is fresh and first hand therefore it makes the study more accurate and genuine.
We at SNS Insider have divided Primary Research into 2 parts.
Part 1 wherein we interview the KOLs of major players as well as the upcoming ones across various geographic regions. This allows us to have their view over the market scenario and acts as an important tool to come closer to the accurate market numbers. As many as 45 paid and unpaid primary interviews are taken from both the demand and supply side of the industry to make sure we land at an accurate judgement and analysis of the market.
This step involves the triangulation of data wherein our team analyses the interview transcripts, online survey responses and observation of on filed participants. The below mentioned chart should give a better understanding of the part 1 of the primary interview.

Part 2: In this part of primary research the data collected via secondary research and the part 1 of the primary research is validated with the interviews from individual consultants and subject matter experts.
Consultants are those set of people who have at least 12 years of experience and expertise within the industry whereas Subject Matter Experts are those with at least 15 years of experience behind their back within the same space. The data with the help of two main processes i.e., FGDs (Focused Group Discussions) and IDs (Individual Discussions). This gives us a 3rd party nonbiased primary view of the market scenario making it a more dependable one while collation of the data pointers.
Step 3: Data Bank Validation
Once all the information is collected via primary and secondary sources, we run that information for data validation. At our intelligence centre our research heads track a lot of information related to the market which includes the quarterly reports, the daily stock prices, and other relevant information. Our data bank server gets updated every fortnight and that is how the information which we collected using our primary and secondary information is revalidated in real time.

Step 4: QA/QC Process
After all the data collection and validation our team does a final level of quality check and quality assurance to get rid of any unwanted or undesired mistakes. This might include but not limited to getting rid of the any typos, duplication of numbers or missing of any important information. The people involved in this process include technical content writers, research heads and graphics people. Once this process is completed the title gets uploader on our platform for our clients to read it.
Step 5: Final QC/QA Process:
This is the last process and comes when the client has ordered the study. In this process a final QA/QC is done before the study is emailed to the client. Since we believe in giving our clients a good experience of our research studies, therefore, to make sure that we do not lack at our end in any way humanly possible we do a final round of quality check and then dispatch the study to the client.
Key Segments:
By Product Type
UV-Visible Spectrophotometers
Fluorescence Spectrophotometers
IR Spectrophotometers
Others
By Component
Light Source
Detectors
Software
Cuvette Holders
Others
By Application
Life Sciences and Biotechnology
Pharmaceuticals
Chemical Industry
Environmental Testing
Food and Beverage Industry
Academic and Research Institutes
Request for Segment Customization as per your Business Requirement: Segment Customization Request
Regional Coverage:
North America
US
Canada
Mexico
Europe
Eastern Europe
Poland
Romania
Hungary
Turkey
Rest of Eastern Europe
Western Europe
Germany
France
UK
Italy
Spain
Netherlands
Switzerland
Austria
Rest of Western Europe
Asia Pacific
China
India
Japan
South Korea
Vietnam
Singapore
Australia
Rest of Asia Pacific
Middle East & Africa
Middle East
UAE
Egypt
Saudi Arabia
Qatar
Rest of Middle East
Africa
Nigeria
South Africa
Rest of Africa
Latin America
Brazil
Argentina
Colombia
Rest of Latin America
Request for Country Level Research Report: Country Level Customization Request
Available Customization
With the given market data, SNS Insider offers customization as per the company’s specific needs. The following customization options are available for the report:
Detailed Volume Analysis
Criss-Cross segment analysis (e.g. Product X Application)
Competitive Product Benchmarking
Geographic Analysis
Additional countries in any of the regions
Customized Data Representation
Detailed analysis and profiling of additional market players
The Telecom Power System Market Size was valued at USD 3.95 Billion in 2023 and is expected to reach USD 9.60 Billion by 2032 and grow at a CAGR of 10.4% over the forecast period 2024-2032.
The Pressure Washer Market Size was valued at USD 2.3 Billion in 2023 and is expected to grow at a CAGR of 3.48% to reach USD 3.13 Billion by 2032.
The LED Drivers Market Size was valued at USD 46.55 Billion in 2023 and is expected to reach USD 105.35 Billion by 2032, and grow at a CAGR of 9.50% over the forecast period 2024-2032
The Speech and Voice Recognition Market Size was valued at USD 12.63 billion in 2023 and is expected to reach USD 92.08 billion by 2032 and grow at a CAGR of 24.7% over the forecast period 2024-2032.
The Autonomous Mobile Robots for Logistics and Warehousing Market was valued at $2.96 billion in 2023 and is expecting to grow to $18.56 billion at 22.6% CAGR by 2024-2032
The 3nm Process Technology for Semiconductor Market size was valued at USD 1.4 Billion in 2023 and is expected to grow to USD 26.5 Billion by 2032 and grow at a CAGR of 38.68% over the forecast period of 2024-2032

Hi! Click one of our member below to chat on Phone
© 2025 All Rights Reserved by SNS Insider Pvt Ltd


