image

Motion Sensor Market Report & Overview:

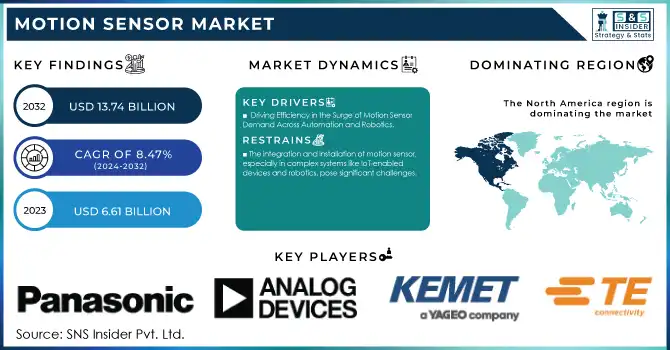
The Motion Sensor Market Size was valued at USD 6.61 Billion in 2023 and is expected to grow to USD 13.74 Billion by 2032 and grow at a CAGR of 8.47 % over the forecast period of 2024-2032.

Motion Sensor Market Revenue Analysis

Get More Information on Motion Sensor Market - Request Sample Report

The motion sensor market is experiencing significant growth, fueled by the increasing demand for safety and security solutions across both residential and commercial sectors. As motion sensor are increasingly integrated into security systems such as surveillance cameras, intrusion alarms, and smart lighting, the market is expanding rapidly. Motion sensor lights, in particular, have become crucial for improving security by automatically activating when motion is detected, ensuring a safer environment. Furthermore, the incorporation of IoT (Internet of Things) with motion sensor is enhancing real-time monitoring and management capabilities, driving adoption in smart homes and commercial security applications. Technological advancements in sensor types, including infrared, ultrasonic, and radar sensor, are also contributing to market expansion. By 2030, the motion sensor market is expected to grow significantly, driven not only by security needs but also by the increasing demand for energy-efficient smart systems. The rise of Industry 4.0, featuring innovations like AI-enabled robots and collaborative technologies, is further accelerating the demand for advanced motion sensor across industries. The growth in global IoT connections, reported to have increased by 12.6 billion according to GSMA, is positively influencing the motion sensor market. Companies like STMicroelectronics have launched innovative products such as the LSM6DSO and LSM6DSOX 6-axis motion sensor, incorporating machine learning and finite state machine technologies to improve performance and extend battery life, particularly in smartphones. The mobile gaming sector is also contributing to the market's growth, with an increased demand for motion sensor for motion-based gaming experiences. Additionally, motion sensor play a vital role in various industrial and scientific fields, including robotics, automotive, and medical research. With continuous innovation from key players, the motion sensor market is set to keep growing, driven by advancements in technology and the rising need for enhanced security.

Market Dynamics

Drivers

  • Driving Efficiency in the Surge of Motion Sensor Demand Across Automation and Robotics

The motion sensor market is experiencing robust growth, driven by the increasing adoption of automation across industries such as robotics, manufacturing, and process control. Automation technologies, powered by Industry 4.0 and AI, are transforming sectors like warehousing, logistics, and manufacturing, with motion sensor playing a pivotal role in enhancing precision, safety, and productivity. As companies focus on boosting efficiency and reducing costs, the integration of motion sensor in automated systems has become indispensable. The home automation market is also contributing to this growth, with a rising demand for smart home solutions that rely on motion sensor for security and energy management. Additionally, proximity sensor are revolutionizing industrial automation by providing contactless precision, which is crucial in robotics, where sensor help robots perform tasks like object detection and navigation with greater efficiency. Ultrasonic sensor are further advancing robotics, offering high accuracy and reliability for a wide range of industrial applications. The investment in Industrial IoT (IIoT) is another key factor driving the motion sensor market, as these sensor enable real-time monitoring and control across different sectors. The increasing reliance on automation, coupled with innovations in sensor technologies, is expected to accelerate the motion sensor market’s expansion. As industries globally adopt more automation technologies to meet competitive pressures and improve operational efficiency, the demand for motion sensor will continue to rise, fostering advancements in sensor technology and driving market growth.

Restraints

  • The integration and installation of motion sensor, especially in complex systems like IoT-enabled devices and robotics, pose significant challenges.

The installation process consumes a considerable amount of time and requires specialized knowledge. In robotics, integrating sensor with actuators and ensuring compatibility with other system components is crucial for seamless performance. This complexity often involves detailed testing, driving up both time and costs. According to statistics, buildings consume over 19% of the total energy usage in the United States, with HVAC systems accounting for 27% of this consumption. Improving energy efficiency could reduce electricity consumption by 14%. In global energy consumption, buildings represent 30% of the total energy used and 60% of electricity production. Lighting, a major energy consumer, accounts for 20% of the total energy and 30% of electricity consumption in buildings. This highlights the importance of energy-efficient technologies such as LEDs, which have a lifespan of over 100,000 hours and convert 40% of electricity into light, making them 40% more efficient than traditional lighting sources. In terms of motion sensor integration, the challenge extends beyond installation. Environmental factors like temperature, humidity, and vibrations can affect sensor performance, which makes proper calibration essential. Specialized expertise is necessary for accurate installation and calibration, which increases operational costs. The complexity of integrating these technologies adds to the overall costs and delays deployment. As industries look to adopt motion sensor for applications such as energy efficiency or automation, these integration challenges must be carefully considered, as they can impact both cost and performance.

Segment Analysis

By Technology

In 2023, the infrared (IR) segment dominated the motion sensor market, accounting for approximately 40% of the market share. Infrared motion sensor are widely used due to their effectiveness in detecting heat signatures and movement, making them suitable for a range of applications, including security systems, automation, and HVAC systems. The primary working principle of infrared sensor involves detecting the infrared radiation emitted by objects, with the most common types being passive infrared (PIR) and active infrared sensor. The growth of this segment is driven by the increasing demand for energy-efficient solutions in residential, commercial, and industrial settings. IR sensor are also vital in smart buildings, contributing to energy savings by controlling lighting and HVAC systems based on occupancy detection. Their cost-effectiveness, reliability, and easy integration into automated systems further boost their widespread adoption, leading to their dominance in the motion sensor market.

By Application

In 2023, the consumer electronics segment led the motion sensor market, accounting for approximately 30% of the market share. This dominance is attributed to the widespread adoption of motion sensor technologies in devices such as smartphones, gaming consoles, wearables, and home automation products. Motion sensor are integral to enhancing user experience in consumer electronics, enabling features like motion detection, gesture recognition, and improved user interfaces. In smartphones, for instance, motion sensor contribute to screen rotation, step tracking, and enhanced camera functionality. The growing trend of smart homes further fuels the demand for motion sensor in devices like smart speakers, security systems, and lighting controls. As the consumer electronics industry continues to innovate, the need for more advanced, compact, and energy-efficient motion sensor is expected to rise, solidifying the consumer electronics segment as a key driver in the motion sensor market.

Regional Analysis

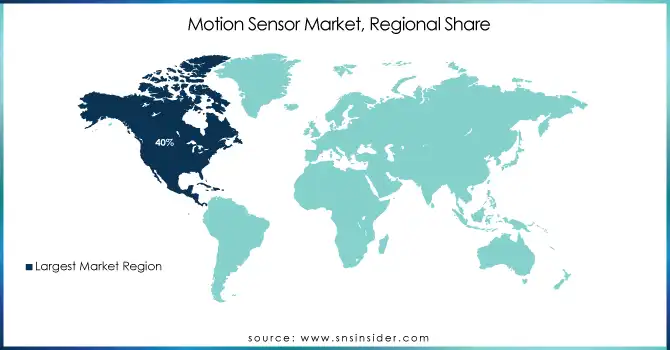
North America, accounting for around 40% of the motion sensor market in 2023, is a dominant force due to its robust technological infrastructure and high demand across various industries like automotive, consumer electronics, healthcare, and security. The United States, as a leader in innovation, plays a significant role with its advanced automation and IoT systems, supporting the widespread adoption of motion sensors in smart homes and energy-efficient technologies. Canada's growing focus on smart cities and environmental sustainability further bolsters the demand for motion sensors in building automation and energy systems. Additionally, the region's strength is reinforced by substantial investments from key industry players and continuous advancements in sensor technologies. The integration of artificial intelligence (AI), robotics, and next-generation systems in sectors such as automotive and healthcare also contributes to North America's dominance, maintaining its leadership in the global motion sensor market.

Asia-Pacific is the fastest-growing region in the motion sensor market from 2024 to 2032, driven by rapid industrialization, urbanization, and the adoption of advanced technologies in countries like China, Japan, South Korea, and India. China leads the growth with significant investments in automation and robotics, while Japan and South Korea focus on integrating motion sensors into robotics, consumer electronics, and automotive sectors. India's expanding automotive and electronics industries are also boosting sensor demand, especially in smart devices and vehicles. Additionally, government initiatives promoting smart cities, IoT infrastructure, and energy efficiency are contributing to the growing demand for motion sensors in building automation and security systems. The region's technological advancements, economic growth, and governmental support for innovation position Asia-Pacific as a dominant force in the motion sensor market, ensuring its continued growth and adoption.

Motion-Sensor-Market-Regional-Share

Get Customized Report as per Your Business Requirement - Request For Customized Report

Key Players

Some of the major players in Motion Sensor market with product:

  • Murata Manufacturing Co., Ltd. (Accelerometers, Gyroscopes)

  • NXP Semiconductors (Motion Sensor ICs, Accelerometers)

  • Robert Bosch GmbH (MEMS Sensor, Inertial Sensor)

  • Sensinova India (Ultrasonic and IR Sensor)

  • STMicroelectronics (MEMS Motion Sensor, Accelerometers)

  • TE Connectivity (Motion Detection Sensor, Accelerometers)

  • TDK Corporation (Inertial Sensor, MEMS)

  • KEMET Corporation (Capacitive Sensor, MEMS Sensor)

  • Analog Devices, Inc. (Accelerometers, Inertial Sensor)

  • Honeywell International Inc. (Inertial Sensor, MEMS)

  • Texas Instruments (Accelerometers, Motion Sensor)

  • Panasonic Corporation (MEMS Sensor, Motion Detectors)

  • Infineon Technologies (Inertial Sensor, Motion Detection ICs)

  • Broadcom Inc. (Motion Sensor, Accelerometers)

  • Vishay Intertechnology (MEMS, Accelerometers)

  • Qualcomm Technologies (Motion Sensor ICs)

  • Amphenol Corporation (Accelerometers, Motion Sensor)

  • Microchip Technology Inc. (MEMS Sensor, Accelerometers)

  • On Semiconductor (MEMS Sensor, Motion Detection ICs)

List of suppliers that provide raw materials and components for the motion sensor market, without mentioning their products:

  • 3M

  • DuPont

  • Honeywell International Inc.

  • Bosch Sensortec

  • STMicroelectronics

  • NXP Semiconductors

  • TDK Corporation

  • Texas Instruments

  • Infineon Technologies

  • Analog Devices, Inc.

Recent Development

  • October 2024, Murata Manufacturing Ltd. opened a new 200mm silicon capacitor production line at its Caen, France facility on expanding its Integrated Passive Solutions and reinforcing its investment in the European electronics industry.

  • On September 2024, NXP Semiconductors unveiled its Trimension SR250 chip, integrating UWB secure ranging, UWB radar, and 3D AoA for precise and energy-efficient presence and motion detection in IoT and automotive applications.

  • On June2024, TE Connectivity launched its Zhaga-certified LUMAWISE Motion Programmable sensor, enabling energy-efficient outdoor lighting and high-bay warehouse lighting with customizable brightness levels for smart city applications.

Motion Sensor Market Report Scope:

Report Attributes Details
Market Size in 2023 USD 6.61 Billion
Market Size by 2032 USD 13.74  Billion
CAGR CAGR of 8.47% From 2024 to 2032
Base Year 2023
Forecast Period 2024-2032
Historical Data 2020-2022
Report Scope & Coverage Market Size, Segments Analysis, Competitive  Landscape, Regional Analysis, DROC & SWOT Analysis, Forecast Outlook
Key Segments • By Technology (Infrared, Ultrasonic, Microwave, Dual Technology, Tomographic, Other)
• By Application (Consumer Electronics, Automotive, Aerospace & Defense, Healthcare, Industrial, Others)
Regional Analysis/Coverage North America (US, Canada, Mexico), Europe (Eastern Europe [Poland, Romania, Hungary, Turkey, Rest of Eastern Europe] Western Europe] Germany, France, UK, Italy, Spain, Netherlands, Switzerland, Austria, Rest of Western Europe]), Asia Pacific (China, India, Japan, South Korea, Vietnam, Singapore, Australia, Rest of Asia Pacific), Middle East & Africa (Middle East [UAE, Egypt, Saudi Arabia, Qatar, Rest of Middle East], Africa [Nigeria, South Africa, Rest of Africa], Latin America (Brazil, Argentina, Colombia, Rest of Latin America)
Company Profiles Murata Manufacturing Co., Ltd., NXP Semiconductors, Robert Bosch GmbH, Sensinova India, STMicroelectronics, TE Connectivity, TDK Corporation, KEMET Corporation, Analog Devices, Inc., Honeywell International Inc., Texas Instruments, Panasonic Corporation, Infineon Technologies, Broadcom Inc., Vishay Intertechnology, Qualcomm Technologies, Amphenol Corporation, Microchip Technology Inc., and On Semiconductor are key players in the motion sensor market.
Key Drivers • Driving Efficiency in the Surge of Motion Sensor Demand Across Automation and Robotics
Restraints • The integration and installation of motion sensor, especially in complex systems like IoT-enabled devices and robotics, pose significant challenges. 

Frequently Asked Questions

Ans: The Motion Sensor Market was valued at USD 6.61 billion in 2023.

Ans: The expected CAGR of the global Motion Sensor Market during the forecast period is 8.47%.

Ans: Factors include increasing demand for smart devices, security concerns, and energy efficiency initiatives.

Ans: Trends include the integration of motion sensors with IoT devices, AI-powered analytics, and gesture recognition technology.

Ans: Technological advancements lead to improved accuracy, sensitivity, and integration capabilities in motion sensor.

Table of Content

1. Introduction

1.1 Market Definition

1.2 Scope (Inclusion and Exclusions)

1.3 Research Assumptions

2. Executive Summary

2.1 Market Overview

2.2 Regional Synopsis

2.3 Competitive Summary

3. Research Methodology

3.1 Top-Down Approach

3.2 Bottom-up Approach

3.3. Data Validation

3.4 Primary Interviews

4. Market Dynamics Impact Analysis

4.1 Market Driving Factors Analysis

4.1.2 Drivers

4.1.2 Restraints

4.2 PESTLE Analysis

4.3 Porter’s Five Forces Model

5. Statistical Insights and Trends Reporting

5.1 Customer Demographics, 2020-2032, by Region 

5.2 Product Development and Launch Data, by Region

5.3 Installation and Maintenance Costs, by Region

5.4 Energy Consumption Savings, by Region

6. Competitive Landscape

6.1 List of Major Companies, By Region

6.2 Market Share Analysis, By Region

6.3 Product Benchmarking

6.3.1 Product specifications and features

6.3.2 Pricing

6.4 Strategic Initiatives

6.4.1 Marketing and promotional activities

6.4.2 Distribution and supply chain strategies

6.4.3 Expansion plans and new product launches

6.4.4 Strategic partnerships and collaborations

6.5 Technological Advancements

6.6 Market Positioning and Branding

7. Motion Sensor Market Segmentation, by Technology

7.1 Chapter Overview

7.2 Infrared

7.2.1 Infrared Market Trends Analysis (2020-2032)

7.2.2 Infrared Market Size Estimates and Forecasts to 2032 (USD Billion)

7.3 Ultrasonic

7.3.1 Ultrasonic Market Trends Analysis (2020-2032)

7.3.2 Ultrasonic Market Size Estimates and Forecasts to 2032 (USD Billion)

7.4 Microwave

7.4.1 Microwave Market Trends Analysis (2020-2032)

7.4.2 Microwave Market Size Estimates and Forecasts to 2032 (USD Billion)

7.5 Dual Technology

7.5.1 Dual Technology Market Trends Analysis (2020-2032)

7.5.2 Dual Technology Market Size Estimates and Forecasts to 2032 (USD Billion)

7.6 Tomographic

7.6.1 Tomographic Market Trends Analysis (2020-2032)

7.6.2 Tomographic Market Size Estimates and Forecasts to 2032 (USD Billion)

7.7 Others

7.7.1 Others Market Trends Analysis (2020-2032)

7.7.2 Others Market Size Estimates and Forecasts to 2032 (USD Billion)

8. Motion Sensor Market Segmentation, by Application

8.1 Chapter Overview

8.2 Consumer Electronics

8.2.1 Consumer Electronics Market Trends Analysis (2020-2032)

8.2.2 Consumer Electronics Market Size Estimates and Forecasts to 2032 (USD Billion)

8.3 Automotive

8.3.1AutomotiveMarket Trends Analysis (2020-2032)

8.3.2 Automotive Market Size Estimates and Forecasts to 2032 (USD Billion)

8.4 Aerospace & Defense

8.4.1Aerospace & Defense Market Trends Analysis (2020-2032)

8.4.2 Aerospace & Defense Market Size Estimates and Forecasts to 2032 (USD Billion)

8.5 Healthcare

8.5.1HealthcareMarket Trends Analysis (2020-2032)

8.5.2 Healthcare Market Size Estimates and Forecasts to 2032 (USD Billion)

8.6 Industrial

8.6.1 Industrial Market Trends Analysis (2020-2032)

8.6.2 Industrial Market Size Estimates and Forecasts to 2032 (USD Billion)

8.7 Others

8.7.1Others Market Trends Analysis (2020-2032)

8.7.2 Others Market Size Estimates and Forecasts to 2032 (USD Billion)

9. Regional Analysis

9.1 Chapter Overview

9.2 North America

9.2.1 Trends Analysis

9.2.2 North America Motion Sensor Market Estimates and Forecasts, by Country (2020-2032) (USD Billion)

9.2.3 North America Motion Sensor Market Estimates and Forecasts, by Technology (2020-2032) (USD Billion) 

9.2.4 North America Motion Sensor Market Estimates and Forecasts, by Application (2020-2032) (USD Billion)

9.2.5 USA

9.2.5.1 USA Motion Sensor Market Estimates and Forecasts, by Technology (2020-2032) (USD Billion)

9.2.5.2 USA Motion Sensor Market Estimates and Forecasts, by Application (2020-2032) (USD Billion)

9.2.6 Canada

9.2.6.1 Canada Motion Sensor Market Estimates and Forecasts, by Technology (2020-2032) (USD Billion)

9.2.6.2 Canada Motion Sensor Market Estimates and Forecasts, by Application (2020-2032) (USD Billion)

9.2.7 Mexico

9.2.7.1 Mexico Motion Sensor Market Estimates and Forecasts, by Technology (2020-2032) (USD Billion)

9.2.7.2 Mexico Motion Sensor Market Estimates and Forecasts, by Application (2020-2032) (USD Billion)

9.3 Europe

9.3.1 Eastern Europe

9.3.1.1 Trends Analysis

9.3.1.2 Eastern Europe Motion Sensor Market Estimates and Forecasts, by Country (2020-2032) (USD Billion)

9.3.1.3 Eastern Europe Motion Sensor Market Estimates and Forecasts, by Technology (2020-2032) (USD Billion) 

9.3.1.4 Eastern Europe Motion Sensor Market Estimates and Forecasts, by Application (2020-2032) (USD Billion)

9.3.1.5 Poland

9.3.1.5.1 Poland Motion Sensor Market Estimates and Forecasts, by Technology (2020-2032) (USD Billion)

9.3.1.5.2 Poland Motion Sensor Market Estimates and Forecasts, by Application (2020-2032) (USD Billion)

9.3.1.6 Romania

9.3.1.6.1 Romania Motion Sensor Market Estimates and Forecasts, by Technology (2020-2032) (USD Billion)

9.3.1.6.2 Romania Motion Sensor Market Estimates and Forecasts, by Application (2020-2032) (USD Billion)

9.3.1.7 Hungary

9.3.1.7.1 Hungary Motion Sensor Market Estimates and Forecasts, by Technology (2020-2032) (USD Billion)

9.3.1.7.2 Hungary Motion Sensor Market Estimates and Forecasts, by Application (2020-2032) (USD Billion)

9.3.1.8 Turkey

9.3.1.8.1 Turkey Motion Sensor Market Estimates and Forecasts, by Technology (2020-2032) (USD Billion)

9.3.1.8.2 Turkey Motion Sensor Market Estimates and Forecasts, by Application (2020-2032) (USD Billion)

9.3.1.9 Rest of Eastern Europe

9.3.1.9.1 Rest of Eastern Europe Motion Sensor Market Estimates and Forecasts, by Technology (2020-2032) (USD Billion)

9.3.1.9.2 Rest of Eastern Europe Motion Sensor Market Estimates and Forecasts, by Application (2020-2032) (USD Billion)

9.3.2 Western Europe

9.3.2.1 Trends Analysis

9.3.2.2 Western Europe Motion Sensor Market Estimates and Forecasts, by Country (2020-2032) (USD Billion)

9.3.2.3 Western Europe Motion Sensor Market Estimates and Forecasts, by Technology (2020-2032) (USD Billion) 

9.3.2.4 Western Europe Motion Sensor Market Estimates and Forecasts, by Application (2020-2032) (USD Billion)

9.3.2.5 Germany

9.3.2.5.1 Germany Motion Sensor Market Estimates and Forecasts, by Technology (2020-2032) (USD Billion)

9.3.2.5.2 Germany Motion Sensor Market Estimates and Forecasts, by Application (2020-2032) (USD Billion)

9.3.2.6 France

9.3.2.6.1 France Motion Sensor Market Estimates and Forecasts, by Technology (2020-2032) (USD Billion)

9.3.2.6.2 France Motion Sensor Market Estimates and Forecasts, by Application (2020-2032) (USD Billion)

9.3.2.7 UK

9.3.2.7.1 UK Motion Sensor Market Estimates and Forecasts, by Technology (2020-2032) (USD Billion)

9.3.2.7.2 UK Motion Sensor Market Estimates and Forecasts, by Application (2020-2032) (USD Billion)

9.3.2.8 Italy

9.3.2.8.1 Italy Motion Sensor Market Estimates and Forecasts, by Technology (2020-2032) (USD Billion)

9.3.2.8.2 Italy Motion Sensor Market Estimates and Forecasts, by Application (2020-2032) (USD Billion)

9.3.2.9 Spain

9.3.2.9.1 Spain Motion Sensor Market Estimates and Forecasts, by Technology (2020-2032) (USD Billion)

9.3.2.9.2 Spain Motion Sensor Market Estimates and Forecasts, by Application (2020-2032) (USD Billion)

9.3.2.10 Netherlands

9.3.2.10.1 Netherlands Motion Sensor Market Estimates and Forecasts, by Technology (2020-2032) (USD Billion)

9.3.2.10.2 Netherlands Motion Sensor Market Estimates and Forecasts, by Application (2020-2032) (USD Billion)

9.3.2.11 Switzerland

9.3.2.11.1 Switzerland Motion Sensor Market Estimates and Forecasts, by Technology (2020-2032) (USD Billion)

9.3.2.11.2 Switzerland Motion Sensor Market Estimates and Forecasts, by Application (2020-2032) (USD Billion)

9.3.2.12 Austria

9.3.2.12.1 Austria Motion Sensor Market Estimates and Forecasts, by Technology (2020-2032) (USD Billion)

9.3.2.12.2 Austria Motion Sensor Market Estimates and Forecasts, by Application (2020-2032) (USD Billion)

9.3.2.13 Rest of Western Europe

9.3.2.13.1 Rest of Western Europe Motion Sensor Market Estimates and Forecasts, by Technology (2020-2032) (USD Billion)

9.3.2.13.2 Rest of Western Europe Motion Sensor Market Estimates and Forecasts, by Application (2020-2032) (USD Billion)

9.4 Asia-Pacific

9.4.1 Trends Analysis

9.4.2 Asia-Pacific Motion Sensor Market Estimates and Forecasts, by Country (2020-2032) (USD Billion)

9.4.3 Asia-Pacific Motion Sensor Market Estimates and Forecasts, by Technology (2020-2032) (USD Billion) 

9.4.4 Asia-Pacific Motion Sensor Market Estimates and Forecasts, by Application (2020-2032) (USD Billion)

9.4.5 China

9.4.5.1 China Motion Sensor Market Estimates and Forecasts, by Technology (2020-2032) (USD Billion)

9.4.5.2 China Motion Sensor Market Estimates and Forecasts, by Application (2020-2032) (USD Billion)

9.4.6 India

9.4.5.1 India Motion Sensor Market Estimates and Forecasts, by Technology (2020-2032) (USD Billion)

9.4.5.2 India Motion Sensor Market Estimates and Forecasts, by Application (2020-2032) (USD Billion)

9.4.5 Japan

9.4.5.1 Japan Motion Sensor Market Estimates and Forecasts, by Technology (2020-2032) (USD Billion)

9.4.5.2 Japan Motion Sensor Market Estimates and Forecasts, by Application (2020-2032) (USD Billion)

9.4.6 South Korea

9.4.6.1 South Korea Motion Sensor Market Estimates and Forecasts, by Technology (2020-2032) (USD Billion)

9.4.6.2 South Korea Motion Sensor Market Estimates and Forecasts, by Application (2020-2032) (USD Billion)

9.4.7 Vietnam

9.4.7.1 Vietnam Motion Sensor Market Estimates and Forecasts, by Technology (2020-2032) (USD Billion)

9.2.7.2 Vietnam Motion Sensor Market Estimates and Forecasts, by Application (2020-2032) (USD Billion)

9.4.8 Singapore

9.4.8.1 Singapore Motion Sensor Market Estimates and Forecasts, by Technology (2020-2032) (USD Billion)

9.4.8.2 Singapore Motion Sensor Market Estimates and Forecasts, by Application (2020-2032) (USD Billion)

9.4.9 Australia

9.4.9.1 Australia Motion Sensor Market Estimates and Forecasts, by Technology (2020-2032) (USD Billion)

9.4.9.2 Australia Motion Sensor Market Estimates and Forecasts, by Application (2020-2032) (USD Billion)

9.4.10 Rest of Asia-Pacific

9.4.10.1 Rest of Asia-Pacific Motion Sensor Market Estimates and Forecasts, by Technology (2020-2032) (USD Billion)

9.4.10.2 Rest of Asia-Pacific Motion Sensor Market Estimates and Forecasts, by Application (2020-2032) (USD Billion)

9.5 Middle East and Africa

9.5.1 Middle East

9.5.1.1 Trends Analysis

9.5.1.2 Middle East Motion Sensor Market Estimates and Forecasts, by Country (2020-2032) (USD Billion)

9.5.1.3 Middle East Motion Sensor Market Estimates and Forecasts, by Technology (2020-2032) (USD Billion) 

9.5.1.4 Middle East Motion Sensor Market Estimates and Forecasts, by Application (2020-2032) (USD Billion)

9.5.1.5 UAE

9.5.1.5.1 UAE Motion Sensor Market Estimates and Forecasts, by Technology (2020-2032) (USD Billion)

9.5.1.5.2 UAE Motion Sensor Market Estimates and Forecasts, by Application (2020-2032) (USD Billion)

9.5.1.6 Egypt

9.5.1.6.1 Egypt Motion Sensor Market Estimates and Forecasts, by Technology (2020-2032) (USD Billion)

9.5.1.6.2 Egypt Motion Sensor Market Estimates and Forecasts, by Application (2020-2032) (USD Billion)

9.5.1.7 Saudi Arabia

9.5.1.7.1 Saudi Arabia Motion Sensor Market Estimates and Forecasts, by Technology (2020-2032) (USD Billion)

9.5.1.7.2 Saudi Arabia Motion Sensor Market Estimates and Forecasts, by Application (2020-2032) (USD Billion)

9.5.1.8 Qatar

9.5.1.8.1 Qatar Motion Sensor Market Estimates and Forecasts, by Technology (2020-2032) (USD Billion)

9.5.1.8.2 Qatar Motion Sensor Market Estimates and Forecasts, by Application (2020-2032) (USD Billion)

9.5.1.9 Rest of Middle East

9.5.1.9.1 Rest of Middle East Motion Sensor Market Estimates and Forecasts, by Technology (2020-2032) (USD Billion)

9.5.1.9.2 Rest of Middle East Motion Sensor Market Estimates and Forecasts, by Application (2020-2032) (USD Billion)

9.5.2 Africa

9.5.2.1 Trends Analysis

9.5.2.2 Africa Motion Sensor Market Estimates and Forecasts, by Country (2020-2032) (USD Billion)

9.5.2.3 Africa Motion Sensor Market Estimates and Forecasts, by Technology (2020-2032) (USD Billion) 

9.5.2.4 Africa Motion Sensor Market Estimates and Forecasts, by Application (2020-2032) (USD Billion)

9.5.2.5 South Africa

9.5.2.5.1 South Africa Motion Sensor Market Estimates and Forecasts, by Technology (2020-2032) (USD Billion)

9.5.2.5.2 South Africa Motion Sensor Market Estimates and Forecasts, by Application (2020-2032) (USD Billion)

9.5.2.6 Nigeria

9.5.2.6.1 Nigeria Motion Sensor Market Estimates and Forecasts, by Technology (2020-2032) (USD Billion)

9.5.2.6.2 Nigeria Motion Sensor Market Estimates and Forecasts, by Application (2020-2032) (USD Billion)

9.5.2.7 Rest of Africa

9.5.2.7.1 Rest of Africa Motion Sensor Market Estimates and Forecasts, by Technology (2020-2032) (USD Billion)

9.5.2.7.2 Rest of Africa Motion Sensor Market Estimates and Forecasts, by Application (2020-2032) (USD Billion)

9.6 Latin America

9.6.1 Trends Analysis

9.6.2 Latin America Motion Sensor Market Estimates and Forecasts, by Country (2020-2032) (USD Billion)

9.6.3 Latin America Motion Sensor Market Estimates and Forecasts, by Technology (2020-2032) (USD Billion) 

9.6.4 Latin America Motion Sensor Market Estimates and Forecasts, by Application (2020-2032) (USD Billion)

9.6.5 Brazil

9.6.5.1 Brazil Motion Sensor Market Estimates and Forecasts, by Technology (2020-2032) (USD Billion)

9.6.5.2 Brazil Motion Sensor Market Estimates and Forecasts, by Application (2020-2032) (USD Billion)

9.6.6 Argentina

9.6.6.1 Argentina Motion Sensor Market Estimates and Forecasts, by Technology (2020-2032) (USD Billion)

9.6.6.2 Argentina Motion Sensor Market Estimates and Forecasts, by Application (2020-2032) (USD Billion)

9.6.7 Colombia

9.6.7.1 Colombia Motion Sensor Market Estimates and Forecasts, by Technology (2020-2032) (USD Billion)

9.6.7.2 Colombia Motion Sensor Market Estimates and Forecasts, by Application (2020-2032) (USD Billion)

9.6.8 Rest of Latin America

9.6.8.1 Rest of Latin America Motion Sensor Market Estimates and Forecasts, by Technology (2020-2032) (USD Billion)

9.6.8.2 Rest of Latin America Motion Sensor Market Estimates and Forecasts, by Application (2020-2032) (USD Billion)

10. Company Profiles

10.1 Murata Manufacturing Co., Ltd.

10.1.1 Company Overview

10.1.2 Financial

10.1.3 Products/ Services Offered

10.1.4 SWOT Analysis

10.2 NXP Semiconductors

10.2.1 Company Overview

10.2.2 Financial

10.2.3 Products/ Services Offered

10.2.4 SWOT Analysis

10.3 Robert Bosch GmbH

 10.3.1 Company Overview

10.3.2 Financial

10.3.3 Products/ Services Offered

10.3.4 SWOT Analysis

10.4 Sensinova India

10.4.1 Company Overview

10.4.2 Financial

10.4.3 Products/ Services Offered

10.4.4 SWOT Analysis

10.5 STMicroelectronics

10.5.1 Company Overview

10.5.2 Financial

10.5.3 Products/ Services Offered

10.5.4 SWOT Analysis

10.6 TE Connectivity

10.6.1 Company Overview

10.6.2 Financial

10.6.3 Products/ Services Offered

10.6.4 SWOT Analysis

10.7 TDK Corporation

 10.7.1 Company Overview

10.7.2 Financial

10.7.3 Products/ Services Offered

10.7.4 SWOT Analysis

10.8 KEMET Corporation

 10.8.1 Company Overview

10.8.2 Financial

10.8.3 Products/ Services Offered

10.8.4 SWOT Analysis

10.9 Analog Devices, Inc.

10.9.1 Company Overview

10.9.2 Financial

10.9.3 Products/ Services Offered

10.9.4 SWOT Analysis

10.10 Honeywell International Inc.

 10.10.1 Company Overview

10.10.2 Financial

10.10.3 Products/ Services Offered

10.10.4 SWOT Analysis

11. Use Cases and Best Practices

12. Conclusion

An accurate research report requires proper strategizing as well as implementation. There are multiple factors involved in the completion of good and accurate research report and selecting the best methodology to compete the research is the toughest part. Since the research reports we provide play a crucial role in any company’s decision-making process, therefore we at SNS Insider always believe that we should choose the best method which gives us results closer to reality. This allows us to reach at a stage wherein we can provide our clients best and accurate investment to output ratio.

Each report that we prepare takes a timeframe of 350-400 business hours for production. Starting from the selection of titles through a couple of in-depth brain storming session to the final QC process before uploading our titles on our website we dedicate around 350 working hours. The titles are selected based on their current market cap and the foreseen CAGR and growth.


The 5 steps process:

Step 1: Secondary Research:

Secondary Research or Desk Research is as the name suggests is a research process wherein, we collect data through the readily available information. In this process we use various paid and unpaid databases which our team has access to and gather data through the same. This includes examining of listed companies’ annual reports, Journals, SEC filling etc. Apart from this our team has access to various associations across the globe across different industries. Lastly, we have exchange relationships with various university as well as individual libraries.

Secondary Research

Step 2: Primary Research

When we talk about primary research, it is a type of study in which the researchers collect relevant data samples directly, rather than relying on previously collected data.  This type of research is focused on gaining content specific facts that can be sued to solve specific problems. Since the collected data is fresh and first hand therefore it makes the study more accurate and genuine.

We at SNS Insider have divided Primary Research into 2 parts.

Part 1 wherein we interview the KOLs of major players as well as the upcoming ones across various geographic regions. This allows us to have their view over the market scenario and acts as an important tool to come closer to the accurate market numbers. As many as 45 paid and unpaid primary interviews are taken from both the demand and supply side of the industry to make sure we land at an accurate judgement and analysis of the market.

This step involves the triangulation of data wherein our team analyses the interview transcripts, online survey responses and observation of on filed participants. The below mentioned chart should give a better understanding of the part 1 of the primary interview.

Primary Research

Part 2: In this part of primary research the data collected via secondary research and the part 1 of the primary research is validated with the interviews from individual consultants and subject matter experts.

Consultants are those set of people who have at least 12 years of experience and expertise within the industry whereas Subject Matter Experts are those with at least 15 years of experience behind their back within the same space. The data with the help of two main processes i.e., FGDs (Focused Group Discussions) and IDs (Individual Discussions). This gives us a 3rd party nonbiased primary view of the market scenario making it a more dependable one while collation of the data pointers.

Step 3: Data Bank Validation

Once all the information is collected via primary and secondary sources, we run that information for data validation. At our intelligence centre our research heads track a lot of information related to the market which includes the quarterly reports, the daily stock prices, and other relevant information. Our data bank server gets updated every fortnight and that is how the information which we collected using our primary and secondary information is revalidated in real time.

Data Bank Validation

Step 4: QA/QC Process

After all the data collection and validation our team does a final level of quality check and quality assurance to get rid of any unwanted or undesired mistakes. This might include but not limited to getting rid of the any typos, duplication of numbers or missing of any important information. The people involved in this process include technical content writers, research heads and graphics people. Once this process is completed the title gets uploader on our platform for our clients to read it.

Step 5: Final QC/QA Process:

This is the last process and comes when the client has ordered the study. In this process a final QA/QC is done before the study is emailed to the client. Since we believe in giving our clients a good experience of our research studies, therefore, to make sure that we do not lack at our end in any way humanly possible we do a final round of quality check and then dispatch the study to the client.

Key Segments:

By Technology

  • Infrared

  • Ultrasonic

  • Microwave

  • Dual Technology

  • Tomographic

  • Others

By Application

  • Consumer Electronics

  • Automotive

  • Aerospace & Defense

  • Healthcare

  • Industrial

  • Others

Request for Segment Customization as per your Business Requirement: Segment Customization Request

REGIONAL COVERAGE:

North America

  • US

  • Canada

  • Mexico

Europe

  • Eastern Europe

    • Poland

    • Romania

    • Hungary

    • Turkey

    • Rest of Eastern Europe

  • Western Europe

    • Germany

    • France

    • UK

    • Italy

    • Spain

    • Netherlands

    • Switzerland

    • Austria

    • Rest of Western Europe

Asia-Pacific

  • China

  • India

  • Japan

  • South Korea

  • Vietnam

  • Singapore

  • Australia

  • Rest of Asia Pacific

Middle East & Africa

  • Middle East

    • UAE

    • Egypt

    • Saudi Arabia

    • Qatar

    • Rest of the Middle East

  • Africa

    • Nigeria

    • South Africa

    • Rest of Africa

Latin America

  • Brazil

  • Argentina

  • Colombia

  • Rest of Latin America

Request for Country Level Research Report: Country Level Customization Request

Available Customization

With the given market data, SNS Insider offers customization as per the company’s specific needs. The following customization options are available for the report:

  • Product Analysis

  • Criss-Cross segment analysis (e.g. Product X Application)

  • Product Matrix which gives a detailed comparison of the product portfolio of each company

  • Geographic Analysis

  • Additional countries in any of the regions

  • Company Information

  • Detailed analysis and profiling of additional market players (Up to five)


  •            5000 (33% Discount)


  •            8950 (40% Discount)


  •            3050 (23% Discount)

Start a Conversation

Hi! Click one of our member below to chat on Phone