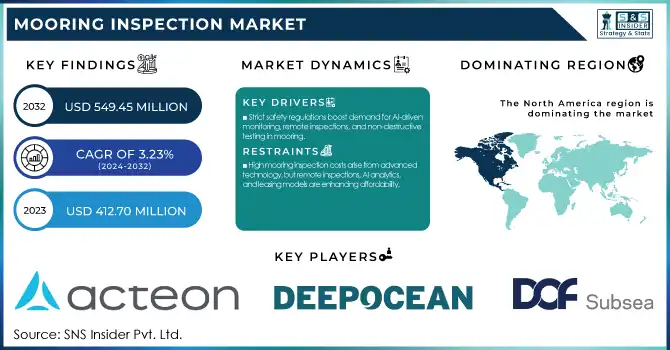
The Mooring Inspection Market Size was estimated at USD 412.70 Million in 2023 and is expected to arrive at USD 549.45 Million by 2032 with a growing CAGR of 3.23% over the forecast period 2024-2032. The Mooring Inspection Market report offers a unique analysis of inspection frequency, failure rates, and regulatory compliance trends across key regions. It highlights the adoption of advanced inspection technologies such as AI-driven predictive analytics, real-time digital twin monitoring, and automated ROV-based inspections. The report also examines mooring system integrity scores, offering insights into structural health trends. Additionally, it explores the increasing shift toward remote and autonomous inspection solutions, reducing human intervention and enhancing efficiency, emerging trends like electromagnetic-based integrity assessment and machine learning-driven anomaly detection further shape the market landscape.
To Get more information on Mooring Inspection Market - Request Free Sample Report
Drivers
Stringent safety regulations drive the demand for frequent mooring inspections, accelerating the adoption of AI-driven monitoring, remote inspection technologies, and non-destructive testing.
Stringent safety regulations are a key driver in the Mooring Inspection Market, as governments and industry bodies enforce stricter compliance measures to ensure offshore infrastructure integrity. Regulator bodies like the International Maritime Organization (IMO) and the American Bureau of Shipping (ABS) require regular checks to minimize the risk of structural failure and environmental accidents. The increasing focus on asset integrity management (AIM) has driven demand for real-time monitoring, digital twin technology, and predictive analytics during mooring inspections. In industries facing these challenges, companies are turning to remote and autonomous inspection solutions and in industries such as oil and gas, robotic-operated vehicles (ROVs) and AI-driven predictive maintenance to meet compliance while minimizing operational expenditures. Furthermore, as floating offshore wind farms and deepwater oil & gas exploration proliferate, the need for stringent safety protocols is becoming increasingly imperative. The NDT techniques are gaining ground in the market, with advancements in sensor-based monitoring improving the accuracy and efficiency of inspections and making it easier to comply with regulatory guidelines.
Restraint
High inspection costs in the Mooring Inspection Market stem from expensive advanced technologies, but trends like remote inspections, AI-driven analytics, and leasing models are improving affordability.
High inspection costs remain a key restraint in the Mooring Inspection Market, as advanced technologies such as ROVs, AUVs, and AI-driven monitoring systems require significant investment. This is costly for the operators and demands specialized equipment, trained personnel, and generally offshore deployment, which is prohibitive for a lot of operators, particularly small ones. Furthermore, the cost of implementing digital twin technology and predictive analytics for improved efficiency also drives up initial costs. In contrast, the market is realizing a transition towards more affordable remote and autonomous inspection technology solutions, lessening the need for human divers and manual methods. Rental and leasing models are also being tentatively developed to relieve financial pressures. The industry is witnessing significant growth despite being an expensive affair, underpinned by stringent safety regulations, expansion in offshore energy projects, and a burgeoning need for real-time monitoring. Now that we have a historical context regarding the IoT-based predictive maintenance trend and AI-based data analysis, they can confidently conclude that they will significantly impact cost-effectiveness in the long term, meaning that advanced inspections will soon be within reach of all stakeholders.
Opportunities
The integration of IoT and AI enables real-time monitoring and predictive maintenance, reducing operational risks, optimizing performance, and minimizing unplanned downtimes.
The integration of IoT and AI in mooring inspection is transforming the industry by enabling real-time monitoring and predictive maintenance. IoT-enabled sensors provide constantly updated information on mooring line tension, corrosion and structural integrity feeding actionable insights to centralized systems. Predictive analytics powered by AI processes this data to flag potential failures before they happen, minimising the chances of mooring failures and unplanned downtimes. This proactive approach improves operational efficiency, safety, and cost-effectiveness as it reduces manual inspections and emergency interventions. Using AI-powered digital twin technology, virtual replicas are made for mooring systems to simulate stress conditions and optimize maintenance schedules for operators. With infrastructure in the North Sea and elsewhere aging, and regulatory compliance becoming more stringent, companies are increasingly investing in automated inspection solutions to help them ensure compliance and to extend the lifespan of these assets. IoT and AI-guided predictive maintenance is transforming the mooring inspection domain, promoting intelligent, data-backed decision processes.
Challenges
The growing reliance on digital inspection tools in the mooring inspection market increases vulnerability to cyber threats, requiring robust security measures to prevent data breaches and system manipulation.
As the mooring inspection market increasingly integrates digital technologies, such as IoT-enabled sensors, AI-driven predictive maintenance, and cloud-based data management, cybersecurity risks have become a major concern. The dependence on real-time monitoring systems, remote inspection tools, and automated ROVs/AUVs creates vulnerabilities in essential infrastructure, making them susceptible to cyber threats such as data breaches, hacking, and system manipulation. An ineffectual inspection system is bound to result in false assessments, operational interruptions, and safety risks that expose offshore systems to danger. Moreover, regulators are elaborating the compliance mandates around cybersecurity, pushing organizations to allocate budget behind a comprehensive security framework. But many organizations have outdated systems with weak encryption and little to no cybersecurity training, making them easy targets for attacks. In response, the industry is turning to blockchain for
By Type
The Below Water Inspection segment dominated with a market share of over 62% in 2023, due to the critical need for frequent assessments of underwater mooring components. Chains, anchors, and connectors are all subject to corrosion, biofouling and mechanical stress, requiring in-depth inspections to ensure their safety and durability. From oil & gas to renewable energy to marine infrastructure, such offshore industries depend on these inspections to meet stringent regulatory compliance needs and avoid structural failures. These new developments offer significant advantages in terms of efficiency, accuracy, and safety for subsea inspections, with the most advanced technology including remotely operated vehicles (ROVs), sonar imaging, and automated underwater drones. As offshore activities increase around the world, the need to inspect mooring systems below the water line has also crept upwards, establishing itself as the largest source of the segment.
By Technology
The Close Visual Inspection (CVI) segment dominated with a market share of over 32% in 2023, due to its cost-effectiveness, ease of implementation, and widespread adoption across offshore and marine industries. This approach enables inspectors to inspect mooring lines, chains and connectors for visible defects, such as corrosion, cracks and wear, without the need for sophisticated equipment. CVI is mostly used for scheduled maintenance, which guarantees timely identification of structural problems and averts failures. It is also widely applicable in both shallow and deepwater environments, providing an effective remedy for a diverse range of operational scenarios. The need to meet the growing demand for offshore oil and gas exploration and the need for regular inspections at these locations to ensure safety and compliance with industry regulations remains the key driver behind the dominance of CVI in this market.
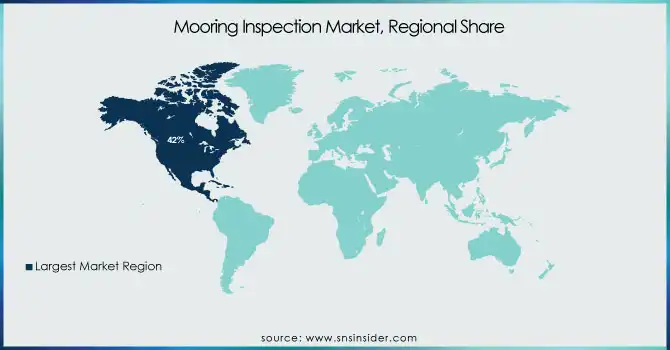
North America region dominated with a market share of over 42% in 2023, primarily Due to the significant number of offshore drilling rigs, FPSOs and production platforms in the region, regular maintenance of mooring systems is essential for safe and continuous operation. Government-imposed regulations BSEE (Bureau of Safety and Environmental Enforcement) impose strict inspection protocols to avoid both structural accidents and environmental catastrophes. With increasing investments in the deepwater and ultra-deepwater exploration, demand for mooring inspection services further increases. Additionally, continuous monitoring and maintenance of aging offshore infrastructure in the region, further strengthens North America to sustain its lead in the market. This dominance is maintained by advanced methods of inspection and security compliance.
Asia-Pacific is the fastest-growing region in the Mooring Inspection Market, driven by increasing offshore energy projects, expanding maritime trade, and rising investments in renewable energy. The surge in large-scale offshore oil & gas exploration in addition to the rapid development of offshore wind farms in China, India, and Australia has created a significant demand for reliable mooring inspection solutions. Increasing safety regulations and the need to avoid structural failure in marine operations also drive market growth. Moreover, growth in inspection technologies such as ultrasonic testing and electromagnetic detection are expected to gain traction in the region. With governments driving for sustainable energy and tightening compliance regulations, the need for efficient mooring inspection services grows in Asia-Pacific.
Get Customized Report as per Your Business Requirement - Enquiry Now
Some of the major key players in the Mooring Inspection Market
Acteon Group (Mooring Integrity Management, Subsea Inspection Services)
DeepOcean (ROV-Based Mooring Inspection, Structural Integrity Monitoring)
Oceaneering International (Autonomous Inspection Systems, Digital Asset Integrity Solutions)
DOF Subsea (ROV and Diver-Based Mooring Inspections, Ultrasonic Testing)
Deep Sea Mooring (Mooring Line Inspection, Load Monitoring Systems)
Welaptega (3D Scanning, Chain Measurement and Inspection)
InterMoor (Mooring System Surveys, Fatigue Analysis)
Moffatt & Nichol (Engineering and Mooring Risk Assessment, Structural Health Monitoring)
Delmar (Mooring Integrity Services, Anchor Handling and Inspection)
Vryhof (Mooring System Inspection, Digital Monitoring Solutions)
Fugro (Subsea Asset Monitoring, Remote Mooring Inspection)
Bureau Veritas (Mooring Compliance Audits, Certification & Testing)
ABS Group (Mooring Integrity Management, Risk-Based Inspection)
Saipem (ROV-Based Inspection, Structural Fatigue Analysis)
Wood PLC (Digital Twin for Mooring, Structural Risk Assessment)
DNV (Regulatory Compliance, Mooring Component Certification)
Seatronics (Subsea Inspection Equipment, ROV Tooling)
JIFMAR Offshore Services (Mooring Maintenance, Inspection & Repair)
Ocean Installer (Mooring System Monitoring, Tension Analysis)
Bluewater (Floating System Integrity, Mooring Line Inspection)
Suppliers for (Provides advanced offshore inspection equipment and services, including ROV-based mooring inspections and subsea monitoring solutions) on Mooring Inspection Market
Acteon Group
Ashtead Technology
InterMoor Inc
Deepwater Corrosion Services
Welaptega Marine
Oceaneering International
Deep Sea Mooring
Vryhof Anchors
Fugro
Bluewater
Recent Development
In October 2024: Acteon and TAISEI Corporation have signed a memorandum of understanding to collaborate on floating offshore wind projects in Japan. Acteon will provide services throughout the project lifecycle, including foundation and mooring solutions, as well as inspection, maintenance, and repair services. This partnership aims to accelerate Japan's renewable energy initiatives by leveraging both companies' expertise.
Report Attributes | Details |
---|---|
Market Size in 2023 | USD 412.70 Million |
Market Size by 2032 | USD 549.45 Million |
CAGR | CAGR of 3.23% From 2024 to 2032 |
Base Year | 2023 |
Forecast Period | 2024-2032 |
Historical Data | 2020-2022 |
Report Scope & Coverage | Market Size, Segments Analysis, Competitive Landscape, Regional Analysis, DROC & SWOT Analysis, Forecast Outlook |
Key Segments | • By Type (Below Water Inspection, Above Water Inspection) • By Technology (Close Visual Inspection, Magnetic Particle Inspection, Ultrasonic Testing, Electromagnetic Detection, Mooring Line Dimension Measurement) |
Regional Analysis/Coverage | North America (US, Canada, Mexico), Europe (Eastern Europe [Poland, Romania, Hungary, Turkey, Rest of Eastern Europe] Western Europe] Germany, France, UK, Italy, Spain, Netherlands, Switzerland, Austria, Rest of Western Europe]), Asia Pacific (China, India, Japan, South Korea, Vietnam, Singapore, Australia, Rest of Asia Pacific), Middle East & Africa (Middle East [UAE, Egypt, Saudi Arabia, Qatar, Rest of Middle East], Africa [Nigeria, South Africa, Rest of Africa], Latin America (Brazil, Argentina, Colombia, Rest of Latin America) |
Company Profiles | Acteon Group, DeepOcean, Oceaneering International, DOF Subsea, Deep Sea Mooring, Welaptega, InterMoor, Moffatt & Nichol, Delmar, Vryhof, Fugro, Bureau Veritas, ABS Group, Saipem, Wood PLC, DNV, Seatronics, JIFMAR Offshore Services, Ocean Installer, Bluewater. |
Ans: The Mooring Inspection Market is expected to grow at a CAGR of 3.23% during 2024-2032.
Ans: The Mooring Inspection Market was USD 412.70 Million in 2023 and is expected to reach USD 549.45 Million by 2032.
Ans: Stringent safety regulations drive the demand for frequent mooring inspections, accelerating the adoption of AI-driven monitoring, remote inspection technologies, and non-destructive testing.
Ans: The “Below Water Inspection” segment dominated the Mooring Inspection Market.
Ans: North America dominated the Mooring Inspection Market in 2023.
Table of Contents:
1. Introduction
1.1 Market Definition
1.2 Scope (Inclusion and Exclusions)
1.3 Research Assumptions
2. Executive Summary
2.1 Market Overview
2.2 Regional Synopsis
2.3 Competitive Summary
3. Research Methodology
3.1 Top-Down Approach
3.2 Bottom-up Approach
3.3. Data Validation
3.4 Primary Interviews
4. Market Dynamics Impact Analysis
4.1 Market Driving Factors Analysis
4.1.2 Drivers
4.1.2 Restraints
4.1.3 Opportunities
4.1.4 Challenges
4.2 PESTLE Analysis
4.3 Porter’s Five Forces Model
5. Statistical Insights and Trends Reporting
5.1 Inspection Frequency, by Region (2020-2023)
5.2 Failure Rates and Causes, by Region (2020-2023)
5.3 Utilization of Inspection Technologies (Diver-Based, ROV, AUV), by Region
5.4 Regulatory Compliance Rates, by Region (2020-2023)
5.5 Mooring System Integrity Scores, by Region (2023)
6. Competitive Landscape
6.1 List of Major Companies, By Region
6.2 Market Share Analysis, By Region
6.3 Product Benchmarking
6.3.1 Product specifications and features
6.3.2 Pricing
6.4 Strategic Initiatives
6.4.1 Marketing and promotional activities
6.4.2 Distribution and supply chain strategies
6.4.3 Expansion plans and new product launches
6.4.4 Strategic partnerships and collaborations
6.5 Technological Advancements
6.6 Market Positioning and Branding
7. Mooring Inspection Market Segmentation, By Type
7.1 Chapter Overview
7.2 Below Water Inspection
7.2.1 Below Water Inspection Market Trends Analysis (2020-2032)
7.2.2 Below Water Inspection Market Size Estimates and Forecasts to 2032 (USD Million)
7.3 Above Water Inspection
7.3.1 Above Water Inspection Market Trends Analysis (2020-2032)
7.3.2 Above Water Inspection Market Size Estimates and Forecasts to 2032 (USD Million)
8. Mooring Inspection Market Segmentation, By Technology
8.1 Chapter Overview
8.2 Close Visual Inspection
8.2.1 Close Visual Inspection Market Trends Analysis (2020-2032)
8.2.2 Close Visual Inspection Market Size Estimates and Forecasts to 2032 (USD Million)
8.3 Magnetic Particle Inspection
8.3.1 Magnetic Particle Inspection Trends Analysis (2020-2032)
8.3.2 Magnetic Particle Inspection Market Size Estimates and Forecasts to 2032 (USD Million)
8.4 Ultrasonic Testing
8.4.1 Ultrasonic Testing Market Trends Analysis (2020-2032)
8.4.2 Ultrasonic Testing Market Size Estimates and Forecasts to 2032 (USD Million)
8.5 Electromagnetic Detection
8.5.1 Electromagnetic Detection Market Trends Analysis (2020-2032)
8.5.2 Electromagnetic Detection Market Size Estimates and Forecasts to 2032 (USD Million)
8.6 Mooring Line Dimension Measurement
8.6.1 Mooring Line Dimension Measurement Market Trends Analysis (2020-2032)
8.6.2 Mooring Line Dimension Measurement Market Size Estimates and Forecasts to 2032 (USD Million)
9. Regional Analysis
9.1 Chapter Overview
9.2 North America
9.2.1 Trends Analysis
9.2.2 North America Mooring Inspection Market Estimates and Forecasts, by Country (2020-2032) (USD Million)
9.2.3 North America Mooring Inspection Market Estimates and Forecasts, By Type (2020-2032) (USD Million)
9.2.4 North America Mooring Inspection Market Estimates and Forecasts, By Technology (2020-2032) (USD Million)
9.2.5 USA
9.2.5.1 USA Mooring Inspection Market Estimates and Forecasts, By Type (2020-2032) (USD Million)
9.2.5.2 USA Mooring Inspection Market Estimates and Forecasts, By Technology (2020-2032) (USD Million)
9.2.6 Canada
9.2.6.1 Canada Mooring Inspection Market Estimates and Forecasts, By Type (2020-2032) (USD Million)
9.2.6.2 Canada Mooring Inspection Market Estimates and Forecasts, By Technology (2020-2032) (USD Million)
9.2.7 Mexico
9.2.7.1 Mexico Mooring Inspection Market Estimates and Forecasts, By Type (2020-2032) (USD Million)
9.2.7.2 Mexico Mooring Inspection Market Estimates and Forecasts, By Technology (2020-2032) (USD Million)
9.3 Europe
9.3.1 Eastern Europe
9.3.1.1 Trends Analysis
9.3.1.2 Eastern Europe Mooring Inspection Market Estimates and Forecasts, by Country (2020-2032) (USD Million)
9.3.1.3 Eastern Europe Mooring Inspection Market Estimates and Forecasts, By Type (2020-2032) (USD Million)
9.3.1.4 Eastern Europe Mooring Inspection Market Estimates and Forecasts, By Technology (2020-2032) (USD Million)
9.3.1.5 Poland
9.3.1.5.1 Poland Mooring Inspection Market Estimates and Forecasts, By Type (2020-2032) (USD Million)
9.3.1.5.2 Poland Mooring Inspection Market Estimates and Forecasts, By Technology (2020-2032) (USD Million)
9.3.1.6 Romania
9.3.1.6.1 Romania Mooring Inspection Market Estimates and Forecasts, By Type (2020-2032) (USD Million)
9.3.1.6.2 Romania Mooring Inspection Market Estimates and Forecasts, By Technology (2020-2032) (USD Million)
9.3.1.7 Hungary
9.3.1.7.1 Hungary Mooring Inspection Market Estimates and Forecasts, By Type (2020-2032) (USD Million)
9.3.1.7.2 Hungary Mooring Inspection Market Estimates and Forecasts, By Technology (2020-2032) (USD Million)
9.3.1.8 Turkey
9.3.1.8.1 Turkey Mooring Inspection Market Estimates and Forecasts, By Type (2020-2032) (USD Million)
9.3.1.8.2 Turkey Mooring Inspection Market Estimates and Forecasts, By Technology (2020-2032) (USD Million)
9.3.1.9 Rest of Eastern Europe
9.3.1.9.1 Rest of Eastern Europe Mooring Inspection Market Estimates and Forecasts, By Type (2020-2032) (USD Million)
9.3.1.9.2 Rest of Eastern Europe Mooring Inspection Market Estimates and Forecasts, By Technology (2020-2032) (USD Million)
9.3.2 Western Europe
9.3.2.1 Trends Analysis
9.3.2.2 Western Europe Mooring Inspection Market Estimates and Forecasts, by Country (2020-2032) (USD Million)
9.3.2.3 Western Europe Mooring Inspection Market Estimates and Forecasts, By Type (2020-2032) (USD Million)
9.3.2.4 Western Europe Mooring Inspection Market Estimates and Forecasts, By Technology (2020-2032) (USD Million)
9.3.2.5 Germany
9.3.2.5.1 Germany Mooring Inspection Market Estimates and Forecasts, By Type (2020-2032) (USD Million)
9.3.2.5.2 Germany Mooring Inspection Market Estimates and Forecasts, By Technology (2020-2032) (USD Million)
9.3.2.6 France
9.3.2.6.1 France Mooring Inspection Market Estimates and Forecasts, By Type (2020-2032) (USD Million)
9.3.2.6.2 France Mooring Inspection Market Estimates and Forecasts, By Technology (2020-2032) (USD Million)
9.3.2.7 UK
9.3.2.7.1 UK Mooring Inspection Market Estimates and Forecasts, By Type (2020-2032) (USD Million)
9.3.2.7.2 UK Mooring Inspection Market Estimates and Forecasts, By Technology (2020-2032) (USD Million)
9.3.2.8 Italy
9.3.2.8.1 Italy Mooring Inspection Market Estimates and Forecasts, By Type (2020-2032) (USD Million)
9.3.2.8.2 Italy Mooring Inspection Market Estimates and Forecasts, By Technology (2020-2032) (USD Million)
9.3.2.9 Spain
9.3.2.9.1 Spain Mooring Inspection Market Estimates and Forecasts, By Type (2020-2032) (USD Million)
9.3.2.9.2 Spain Mooring Inspection Market Estimates and Forecasts, By Technology (2020-2032) (USD Million)
9.3.2.10 Netherlands
9.3.2.10.1 Netherlands Mooring Inspection Market Estimates and Forecasts, By Type (2020-2032) (USD Million)
9.3.2.10.2 Netherlands Mooring Inspection Market Estimates and Forecasts, By Technology (2020-2032) (USD Million)
9.3.2.11 Switzerland
9.3.2.11.1 Switzerland Mooring Inspection Market Estimates and Forecasts, By Type (2020-2032) (USD Million)
9.3.2.11.2 Switzerland Mooring Inspection Market Estimates and Forecasts, By Technology (2020-2032) (USD Million)
9.3.2.12 Austria
9.3.2.12.1 Austria Mooring Inspection Market Estimates and Forecasts, By Type (2020-2032) (USD Million)
9.3.2.12.2 Austria Mooring Inspection Market Estimates and Forecasts, By Technology (2020-2032) (USD Million)
9.3.2.13 Rest of Western Europe
9.3.2.13.1 Rest of Western Europe Mooring Inspection Market Estimates and Forecasts, By Type (2020-2032) (USD Million)
9.3.2.13.2 Rest of Western Europe Mooring Inspection Market Estimates and Forecasts, By Technology (2020-2032) (USD Million)
9.4 Asia Pacific
9.4.1 Trends Analysis
9.4.2 Asia Pacific Mooring Inspection Market Estimates and Forecasts, by Country (2020-2032) (USD Million)
9.4.3 Asia Pacific Mooring Inspection Market Estimates and Forecasts, By Type (2020-2032) (USD Million)
9.4.4 Asia Pacific Mooring Inspection Market Estimates and Forecasts, By Technology (2020-2032) (USD Million)
9.4.5 China
9.4.5.1 China Mooring Inspection Market Estimates and Forecasts, By Type (2020-2032) (USD Million)
9.4.5.2 China Mooring Inspection Market Estimates and Forecasts, By Technology (2020-2032) (USD Million)
9.4.6 India
9.4.5.1 India Mooring Inspection Market Estimates and Forecasts, By Type (2020-2032) (USD Million)
9.4.5.2 India Mooring Inspection Market Estimates and Forecasts, By Technology (2020-2032) (USD Million)
9.4.5 Japan
9.4.5.1 Japan Mooring Inspection Market Estimates and Forecasts, By Type (2020-2032) (USD Million)
9.4.5.2 Japan Mooring Inspection Market Estimates and Forecasts, By Technology (2020-2032) (USD Million)
9.4.6 South Korea
9.4.6.1 South Korea Mooring Inspection Market Estimates and Forecasts, By Type (2020-2032) (USD Million)
9.4.6.2 South Korea Mooring Inspection Market Estimates and Forecasts, By Technology (2020-2032) (USD Million)
9.4.7 Vietnam
9.4.7.1 Vietnam Mooring Inspection Market Estimates and Forecasts, By Type (2020-2032) (USD Million)
9.2.7.2 Vietnam Mooring Inspection Market Estimates and Forecasts, By Technology (2020-2032) (USD Million)
9.4.8 Singapore
9.4.8.1 Singapore Mooring Inspection Market Estimates and Forecasts, By Type (2020-2032) (USD Million)
9.4.8.2 Singapore Mooring Inspection Market Estimates and Forecasts, By Technology (2020-2032) (USD Million)
9.4.9 Australia
9.4.9.1 Australia Mooring Inspection Market Estimates and Forecasts, By Type (2020-2032) (USD Million)
9.4.9.2 Australia Mooring Inspection Market Estimates and Forecasts, By Technology (2020-2032) (USD Million)
9.4.10 Rest of Asia Pacific
9.4.10.1 Rest of Asia Pacific Mooring Inspection Market Estimates and Forecasts, By Type (2020-2032) (USD Million)
9.4.10.2 Rest of Asia Pacific Mooring Inspection Market Estimates and Forecasts, By Technology (2020-2032) (USD Million)
9.5 Middle East and Africa
9.5.1 Middle East
9.5.1.1 Trends Analysis
9.5.1.2 Middle East Mooring Inspection Market Estimates and Forecasts, by Country (2020-2032) (USD Million)
9.5.1.3 Middle East Mooring Inspection Market Estimates and Forecasts, By Type (2020-2032) (USD Million)
9.5.1.4 Middle East Mooring Inspection Market Estimates and Forecasts, By Technology (2020-2032) (USD Million)
9.5.1.5 UAE
9.5.1.5.1 UAE Mooring Inspection Market Estimates and Forecasts, By Type (2020-2032) (USD Million)
9.5.1.5.2 UAE Mooring Inspection Market Estimates and Forecasts, By Technology (2020-2032) (USD Million)
9.5.1.6 Egypt
9.5.1.6.1 Egypt Mooring Inspection Market Estimates and Forecasts, By Type (2020-2032) (USD Million)
9.5.1.6.2 Egypt Mooring Inspection Market Estimates and Forecasts, By Technology (2020-2032) (USD Million)
9.5.1.7 Saudi Arabia
9.5.1.7.1 Saudi Arabia Mooring Inspection Market Estimates and Forecasts, By Type (2020-2032) (USD Million)
9.5.1.7.2 Saudi Arabia Mooring Inspection Market Estimates and Forecasts, By Technology (2020-2032) (USD Million)
9.5.1.8 Qatar
9.5.1.8.1 Qatar Mooring Inspection Market Estimates and Forecasts, By Type (2020-2032) (USD Million)
9.5.1.8.2 Qatar Mooring Inspection Market Estimates and Forecasts, By Technology (2020-2032) (USD Million)
9.5.1.9 Rest of Middle East
9.5.1.9.1 Rest of Middle East Mooring Inspection Market Estimates and Forecasts, By Type (2020-2032) (USD Million)
9.5.1.9.2 Rest of Middle East Mooring Inspection Market Estimates and Forecasts, By Technology (2020-2032) (USD Million)
9.5.2 Africa
9.5.2.1 Trends Analysis
9.5.2.2 Africa Mooring Inspection Market Estimates and Forecasts, by Country (2020-2032) (USD Million)
9.5.2.3 Africa Mooring Inspection Market Estimates and Forecasts, By Type (2020-2032) (USD Million)
9.5.2.4 Africa Mooring Inspection Market Estimates and Forecasts, By Technology (2020-2032) (USD Million)
9.5.2.5 South Africa
9.5.2.5.1 South Africa Mooring Inspection Market Estimates and Forecasts, By Type (2020-2032) (USD Million)
9.5.2.5.2 South Africa Mooring Inspection Market Estimates and Forecasts, By Technology (2020-2032) (USD Million)
9.5.2.6 Nigeria
9.5.2.6.1 Nigeria Mooring Inspection Market Estimates and Forecasts, By Type (2020-2032) (USD Million)
9.5.2.6.2 Nigeria Mooring Inspection Market Estimates and Forecasts, By Technology (2020-2032) (USD Million)
9.5.2.7 Rest of Africa
9.5.2.7.1 Rest of Africa Mooring Inspection Market Estimates and Forecasts, By Type (2020-2032) (USD Million)
9.5.2.7.2 Rest of Africa Mooring Inspection Market Estimates and Forecasts, By Technology (2020-2032) (USD Million)
9.6 Latin America
9.6.1 Trends Analysis
9.6.2 Latin America Mooring Inspection Market Estimates and Forecasts, by Country (2020-2032) (USD Million)
9.6.3 Latin America Mooring Inspection Market Estimates and Forecasts, By Type (2020-2032) (USD Million)
9.6.4 Latin America Mooring Inspection Market Estimates and Forecasts, By Technology (2020-2032) (USD Million)
9.6.5 Brazil
9.6.5.1 Brazil Mooring Inspection Market Estimates and Forecasts, By Type (2020-2032) (USD Million)
9.6.5.2 Brazil Mooring Inspection Market Estimates and Forecasts, By Technology (2020-2032) (USD Million)
9.6.6 Argentina
9.6.6.1 Argentina Mooring Inspection Market Estimates and Forecasts, By Type (2020-2032) (USD Million)
9.6.6.2 Argentina Mooring Inspection Market Estimates and Forecasts, By Technology (2020-2032) (USD Million)
9.6.7 Colombia
9.6.7.1 Colombia Mooring Inspection Market Estimates and Forecasts, By Type (2020-2032) (USD Million)
9.6.7.2 Colombia Mooring Inspection Market Estimates and Forecasts, By Technology (2020-2032) (USD Million)
9.6.8 Rest of Latin America
9.6.8.1 Rest of Latin America Mooring Inspection Market Estimates and Forecasts, By Type (2020-2032) (USD Million)
9.6.8.2 Rest of Latin America Mooring Inspection Market Estimates and Forecasts, By Technology (2020-2032) (USD Million)
10. Company Profiles
10.1 Acteon Group
10.1.1 Company Overview
10.1.2 Financial
10.1.3 Products/ Services Offered
110.1.4 SWOT Analysis
10.2 DeepOcean
10.2.1 Company Overview
10.2.2 Financial
10.2.3 Products/ Services Offered
10.2.4 SWOT Analysis
10.3 Oceaneering International
10.3.1 Company Overview
10.3.2 Financial
10.3.3 Products/ Services Offered
10.3.4 SWOT Analysis
10.4 DOF Subsea
10.4.1 Company Overview
10.4.2 Financial
10.4.3 Products/ Services Offered
10.4.4 SWOT Analysis
10.5 Deep Sea Mooring
10.5.1 Company Overview
10.5.2 Financial
10.5.3 Products/ Services Offered
10.5.4 SWOT Analysis
10.6 Welaptega
10.6.1 Company Overview
10.6.2 Financial
10.6.3 Products/ Services Offered
10.6.4 SWOT Analysis
10.7 InterMoor
10.7.1 Company Overview
10.7.2 Financial
10.7.3 Products/ Services Offered
10.7.4 SWOT Analysis
10.8 Moffatt & Nichol
10.8.1 Company Overview
10.8.2 Financial
10.8.3 Products/ Services Offered
10.8.4 SWOT Analysis
10.9 Delmar
10.9.1 Company Overview
10.9.2 Financial
10.9.3 Products/ Services Offered
10.9.4 SWOT Analysis
10.10 Vryhof
10.9.1 Company Overview
10.9.2 Financial
10.9.3 Products/ Services Offered
10.9.4 SWOT Analysis
11. Use Cases and Best Practices
12. Conclusion
An accurate research report requires proper strategizing as well as implementation. There are multiple factors involved in the completion of good and accurate research report and selecting the best methodology to compete the research is the toughest part. Since the research reports we provide play a crucial role in any company’s decision-making process, therefore we at SNS Insider always believe that we should choose the best method which gives us results closer to reality. This allows us to reach at a stage wherein we can provide our clients best and accurate investment to output ratio.
Each report that we prepare takes a timeframe of 350-400 business hours for production. Starting from the selection of titles through a couple of in-depth brain storming session to the final QC process before uploading our titles on our website we dedicate around 350 working hours. The titles are selected based on their current market cap and the foreseen CAGR and growth.
The 5 steps process:
Step 1: Secondary Research:
Secondary Research or Desk Research is as the name suggests is a research process wherein, we collect data through the readily available information. In this process we use various paid and unpaid databases which our team has access to and gather data through the same. This includes examining of listed companies’ annual reports, Journals, SEC filling etc. Apart from this our team has access to various associations across the globe across different industries. Lastly, we have exchange relationships with various university as well as individual libraries.
Step 2: Primary Research
When we talk about primary research, it is a type of study in which the researchers collect relevant data samples directly, rather than relying on previously collected data. This type of research is focused on gaining content specific facts that can be sued to solve specific problems. Since the collected data is fresh and first hand therefore it makes the study more accurate and genuine.
We at SNS Insider have divided Primary Research into 2 parts.
Part 1 wherein we interview the KOLs of major players as well as the upcoming ones across various geographic regions. This allows us to have their view over the market scenario and acts as an important tool to come closer to the accurate market numbers. As many as 45 paid and unpaid primary interviews are taken from both the demand and supply side of the industry to make sure we land at an accurate judgement and analysis of the market.
This step involves the triangulation of data wherein our team analyses the interview transcripts, online survey responses and observation of on filed participants. The below mentioned chart should give a better understanding of the part 1 of the primary interview.
Part 2: In this part of primary research the data collected via secondary research and the part 1 of the primary research is validated with the interviews from individual consultants and subject matter experts.
Consultants are those set of people who have at least 12 years of experience and expertise within the industry whereas Subject Matter Experts are those with at least 15 years of experience behind their back within the same space. The data with the help of two main processes i.e., FGDs (Focused Group Discussions) and IDs (Individual Discussions). This gives us a 3rd party nonbiased primary view of the market scenario making it a more dependable one while collation of the data pointers.
Step 3: Data Bank Validation
Once all the information is collected via primary and secondary sources, we run that information for data validation. At our intelligence centre our research heads track a lot of information related to the market which includes the quarterly reports, the daily stock prices, and other relevant information. Our data bank server gets updated every fortnight and that is how the information which we collected using our primary and secondary information is revalidated in real time.
Step 4: QA/QC Process
After all the data collection and validation our team does a final level of quality check and quality assurance to get rid of any unwanted or undesired mistakes. This might include but not limited to getting rid of the any typos, duplication of numbers or missing of any important information. The people involved in this process include technical content writers, research heads and graphics people. Once this process is completed the title gets uploader on our platform for our clients to read it.
Step 5: Final QC/QA Process:
This is the last process and comes when the client has ordered the study. In this process a final QA/QC is done before the study is emailed to the client. Since we believe in giving our clients a good experience of our research studies, therefore, to make sure that we do not lack at our end in any way humanly possible we do a final round of quality check and then dispatch the study to the client.
Key Segmentation:
By Type
Below Water Inspection
Above Water Inspection
By Technology
Close Visual Inspection
Magnetic Particle Inspection
Ultrasonic Testing
Electromagnetic Detection
Mooring Line Dimension Measurement
Request for Segment Customization as per your Business Requirement: Segment Customization Request
Regional Coverage:
North America
US
Canada
Mexico
Europe
Eastern Europe
Poland
Romania
Hungary
Turkey
Rest of Eastern Europe
Western Europe
Germany
France
UK
Italy
Spain
Netherlands
Switzerland
Austria
Rest of Western Europe
Asia Pacific
China
India
Japan
South Korea
Vietnam
Singapore
Australia
Rest of Asia Pacific
Middle East & Africa
Middle East
UAE
Egypt
Saudi Arabia
Qatar
Rest of Middle East
Africa
Nigeria
South Africa
Rest of Africa
Latin America
Brazil
Argentina
Colombia
Rest of Latin America
Request for Country Level Research Report: Country Level Customization Request
Available Customization
With the given market data, SNS Insider offers customization as per the company’s specific needs. The following customization options are available for the report:
Detailed Volume Analysis
Criss-Cross segment analysis (e.g. Product X Application)
Competitive Product Benchmarking
Geographic Analysis
Additional countries in any of the regions
Customized Data Representation
Detailed analysis and profiling of additional market players
Industrial Robotics Market was valued at USD 39.80 billion in 2023 and is expected to reach USD 113.10 billion by 2032, at a CAGR of 12.55% from 2024-2032.
The Hydraulic Equipment Market Size was valued at USD 49.34 Billion in 2023 and is now anticipated to grow to USD 114.4 Billion by 2032, displaying a compound annual growth rate (CAGR) of 9.8% during the forecast Period 2024-2032.
The Pneumatic Tube System Market size was valued at USD 2.43 Billion in 2023 and is expected to reach USD 4.44 Billion by 2032 and grow at a CAGR of 7.40% over the forecast period 2024-2032.
The Control Towers Market Size was esteemed at USD 8.53 billion in 2023 and is supposed to arrive at USD 51.64 billion by 2032 with a growing CAGR of 22.15% over the forecast period 2024-2032.
The Crawler Dozers Market size was estimated at USD 7.82 billion in 2023 and is expected to reach USD 13.89 billion By 2032 at a CAGR of 6.59% during the forecast period of 2024-2032.
The Industrial Control & Factory Automation Market Size was valued at USD 226.93 Billion in 2023 and is now anticipated to grow to USD 513.82 Billion by 2032, displaying a compound annual growth rate (CAGR) of 9.51% during the forecast Period 2024-2032.
Hi! Click one of our member below to chat on Phone