Molecular Imaging Market Size & Overview:
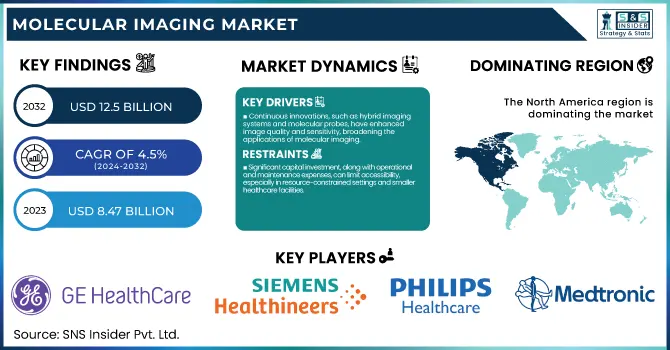
The Molecular Imaging Market Size was valued at USD 8.47 billion in 2023 and is expected to reach USD 12.5 billion by 2032, growing at a CAGR of 4.5% over the forecast period 2024-2032.
To Get more information on Molecular Imaging Market - Request Free Sample Report
The molecular imaging market is dominated by exponential growth due to rising chronic diseases, technological advancement, and high demand for early and accurate diagnosis. Based on the WHO report, cancer is one of the leading causes of death across the globe. In 2020, it caused about 9.6 million deaths. Further, the U.S. National Cancer Institute asserts that about 39.5% of men and women will be diagnosed with cancer at some points in their lifetime. This high prevalence of the disease influences the amount of allocation of government funds to enhance research on cancer and its diagnosis. For example, the U.S. National Institutes of Health allocated $6.9 billion to research for cancer during FY 2021. The European Commission’s Horizon Europe allocated €6.8 billion to health research and innovation from 2021-2027, a significant portion dedicated to cancer diagnosis and manipulation.
The demand for molecular imaging is accelerated by the increasing population globally, especially among the aging group. The U.N. suggests that by 2050 more than one out of every six people will be over 65 years, compared to one out of every 11 persons in 2019. Human brains degenerate with age, leading to more vulnerable health conditions. For example, the prevalence of Alzheimers disease is high among the aging group. Molecular imaging plays a significant impact on the detection of the diseases in the early stages of the reduction of the Amyloid protein in human brains. Lastly, technological advancements also accelerate the growth of the market. For instance, there are hybrid imaging devices and radiotracers to enhance molecular imaging. Moreover, the invention of artificial intelligence to analyze an image for certain structures within a few seconds accelerates the diagnosis process. The COVID-19 pandemic enhanced the growth of the market to improve diagnosis.
Molecular Imaging Market Dynamics
Drivers
-
Continuous innovations, such as hybrid imaging systems and molecular probes, have enhanced image quality and sensitivity, broadening the applications of molecular imaging.
-
The increasing incidence of conditions like cancer and cardiovascular diseases has escalated the demand for precise diagnostic tools, positioning molecular imaging as a vital component in early detection and personalized treatment planning.
The increasing prevalence of chronic diseases is one of the major factors driving the growth of the Molecular Imaging Market. Changing lifestyles, the growing proportion of elderly populations, and environmental factors, among others, are leading to a higher incidence of malignancies and chronic disorders, including cancers, cardiovascular diseases, and neurological disorders. Because these diseases necessitate very early and precise detection in order to treat them effectively, advanced diagnostic tools such as molecular imaging are in greater demand.
Cancer is one of the leading causes of death in the world there are 9.6 million estimated deaths according to the World Health Organization (WHO) and this number is expected to increase. The techniques such as Positron Emission Tomography (PET) and Single Photon Emission Computed Tomography (SPECT) which plays an important role in early diagnosis of cancer and hence increasing chances of survival. Molecular imaging is a very important step for detecting cancer, because it aids in location, the position, size, and spread of the cancer. As regards cardiovascular diseases, the American Heart Association report estimates that nearly 18.6 million adults in the US had some type of coronary artery disease in 2020. Molecular imaging techniques, such as PET scans, are now being used more frequently to find heart conditions, helping provide more detailed information about the underlying mechanism of heart disease, such as atherosclerosis or inflammation, which has the potential to help inform treatment decisions.
Restraints
-
Significant capital investment, along with operational and maintenance expenses, can limit accessibility, especially in resource-constrained settings and smaller healthcare facilities.
-
Inadequate coverage for molecular imaging procedures and radiopharmaceuticals creates uncertainties for healthcare providers, hindering widespread adoption of these technologies.
A major factor that hinders the growth of the molecular imaging market is the cost of molecular imaging systems. Besides these advanced imaging technologies, they often have rather high capital costs not only in purchasing but also in maintaining and operating the equipment. Healthcare professionals need training to use these systems, which increases the cost. Moreover, molecular imaging involves the use of high-cost radiopharmaceuticals, and the price of each procedure is high. The exorbitant costs can restrict access to advanced diagnostic tools for healthcare providers, particularly in developing or resource-limited environments. While these technologies may carry certain advantages over a clinical imaging standpoint, hospitals and clinics may resort to set alternatives for imaging that are much less pricey, therefore, burying molecular imaging deeper in the ground. This accessibility problem also hinders patient access to these advanced diagnostic tests, which can prolong diagnosis and treatment for patients who would benefit from earlier and more precise disease detection such as cancers and neurological disorders.
Molecular Imaging Market Segment Overview
By Modality
The molecular imaging market was dominated by the SPECT segment with a revenue share of 42% in 2023. The dominant responsibility of SPECT can be accredited to numerous factors such as the stamina of SPECT systems, their price for other modalities, and their appropriateness for a wide range of essential conditions. In cardiology, neurology, and oncological applications, SPECT imaging is particularly useful. SPECT myocardial perfusion imaging is one of the most significant diagnostic tools used in cardiovascular diagnosis with over 6 million studies performed annually in the United States. In 2020, there were 2.5 million SPECT procedures reimbursed through the U.S. Centers for Medicare & Medicaid Services (CMS) in the elderly population, suggesting relatively high utilization of this imaging modality. In addition, technological developments have further improved SPECT capability, as in the availability of cadmium zinc telluride (CZT) detectors to greatly enhance imaging efficiency with improved image quality in less time. The European Association of Nuclear Medicine (EANM) guidelines also helped to standardize SPECT imaging protocols, making them more reliable and reproducible in the daily clinical setting. SPECT systems tend to be more affordable to operate and can be applied to a wider range of clinical disciplines, thus propelling their ascendancy in market leadership among emerging economies.
By Application
Oncology was the largest application segment that held a share of 32.0% of the molecular imaging market in 2023. This is largely because of the importance of molecular imaging in the diagnosis, staging, treatment planning, and monitoring of cancer. The urgent need for effective diagnostics is underscored by the fact that according to the World Health Organization, almost 10 million people globally died from cancer in 2020. According to The National Cancer Institute, as of 2018, they estimated that approximately 1,735,350 new cancer cases were being diagnosed in the United States. Molecular imaging techniques, especially PET-CT scans, have become key tools in oncology. According to 2019 CMS claims data, more than 2 million PET-CT scans were performed for oncology indications in the Medicare population alone. Molecular imaging is increasingly utilized as molecular imaging recommendations in ESMO guidelines are becoming more widespread in several cancer types translating to the use of molecular imaging in cancer management in more healthcare systems. Additionally, the use of new radiotracers is further widening molecular imaging applications in oncology. An example includes the approval of 68Ga-PSMA-11 by the FDA for prostate cancer imaging in 2020, which represents an important step forward in precision diagnostics. With increasing focus on personalized therapy in cancer treatment, there has also been a concomitant increase in the need for more detailed characterization of tumors and monitoring of treatment response which molecular imaging can provide.
By End-use
The hospital segment accounted for about 48% share of the molecular imaging market in 2023. Several reasons account for this huge market share. Large academic and tertiary care centers, where people usually go for their heart care, have the financial resources and patient volumes to justify the cost of expensive molecular imaging equipment. The American Hospital Association has many hospitals across the U.S. and in 2021, there were 6,093 hospitals. Most of the hospitals provide advanced imaging services. In 2018 alone there were an estimated 130 million emergency department visits by the U.S. Centers for Disease Control and Prevention (CDC) and many of those cases may have benefited from advanced imaging. In addition, hospitals often serve a more diverse patient population and a broader range of clinical specialties, requiring access to a wider array of molecular imaging modalities. Several radiopharmaceuticals and imaging agents have been approved by the U.S. Food and Drug Administration (FDA) for hospital use to increase the repertoire diagnosis. Furthermore, hospitals are also frequently at the front line of clinical trials implementing molecular imaging techniques. For example, many of the studies incorporating advanced imaging technologies are conducted by the National Institutes of Health (NIH) Clinical Center. The COVID-19 pandemic has underscored the vital role of hospital-based advanced diagnostics that may expedite investments in molecular imaging technologies.
Molecular Imaging Market Regional Analysis
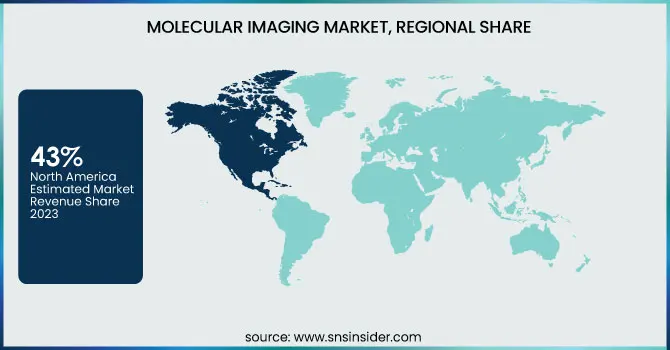
North America held the largest share of the molecular imaging market in 2023, accounting for a market with a revenue share of 43%. The dominance of the region can be explained by superior healthcare systems, high healthcare spending, and quick acceptance and adoption of innovative medical technologies. In 2020, U.S. healthcare expenditures were $4.1 trillion. This significant investment allowed advanced molecular imaging systems to become ubiquitous in healthcare facilities. In particular, the U.S. Food and Drug Administration (FDA) has also become very active in approving new molecular imaging agents and technologies to encourage innovation. For instance, in 2021, the FDA approved 68Ga-PSMA-11 as the first PSMA-targeted PET imaging agent for prostate cancer, expanding diagnostic capabilities in oncology.
The Asia-Pacific region will record the fastest CAGR in the molecular imaging market between 2024-2032. Rising expenditure on healthcare escalated awareness regarding early disease detection, and advancement in access to modern healthcare technologies in developing economies are the few factors accelerating the market growth. In particular, China has been able to significantly increase the spectrum of molecular imaging. The National Health Commission of China reported that the number of PET-CT scanners in service in the country numbered 9723 by the end of 2020, which was more than the previous year by 15.7%. Similarly, the Indian Council of Medical Research (ICMR) has highlighted the strengths of molecular imaging in cancer research, which is likely to upsurge market growth of molecular imaging in the region.
Get Customized Report as per Your Business Requirement - Enquiry Now
Recent Developments
-
In June 2024, Positron Corporation confirmed the sale of its Attrius PET system that will be installed at the Centre in accordance with the Centre timeline's at Q4 in 2024. Positioned as the industrys only Truly 2D quantitative PET, the Attrius offers high-resolution imaging for nuclear cardiology with a dedicated PET scanner.
-
FUJIFILM India on February 4, 2023, unveiled the Prime open MRI, the APERTO Lucent, with Arietta 850 DeepInsight and Arietta 650 DeepInsight ultrasound models, and the FDX Visionary-DR bone density scanner.
Key Players in Molecular Imaging Market
Key Service Providers/Manufacturers
-
GE Healthcare (Discovery MI, PET/CT Scanner)
-
Siemens Healthineers (Biograph mMR, Somatom PET-CT Scanner)
-
Philips Healthcare (Allegra PET/MR, PET/CT Scanner)
-
Canon Medical Systems Corporation (Vantage Galan 3T, Aquilion CT)
-
Elekta AB (Unity MR-Linac, Elekta Synergy)
-
Medtronic (HIFU, Cryoablation)
-
Thermo Fisher Scientific (Tri-Carb, Femtosecond Laser Systems)
-
PerkinElmer (IVIS Spectrum, VICTOR Nivo)
-
Invivo (a part of Philips) (MRI Coil, PET/CT Scan)
-
Hitachi Medical Systems (PET Scanner, HITACHI AIRIS V)
Users of Services and Products
-
Johns Hopkins Medicine
-
Mayo Clinic
-
Cleveland Clinic
-
Memorial Sloan Kettering Cancer Center
-
MD Anderson Cancer Center
-
The Mayo Clinic
-
University of California, San Francisco (UCSF)
-
Stanford Health Care
-
Kaiser Permanente
-
Mount Sinai Health System
| Report Attributes | Details |
|---|---|
| Market Size in 2023 | USD 8.47 Billion |
| Market Size by 2032 | USD 12.5 Billion |
| CAGR | CAGR of 4.5% From 2024 to 2032 |
| Base Year | 2023 |
| Forecast Period | 2024-2032 |
| Historical Data | 2020-2022 |
| Report Scope & Coverage | Market Size, Segments Analysis, Competitive Landscape, Regional Analysis, DROC & SWOT Analysis, Forecast Outlook |
| Key Segments | • By Modality (Molecular Ultrasound Imaging, Positron Emission Tomography (PET), Single Photon Emission Computed Tomography (SPECT), Nuclear Magnetic Resonance (NMR) Spectrometer, Other Modalities) • By Application (Cardiovascular, Neurology, Oncology, Respirator, Gastrointestinal) • By End-use (Hospitals, Diagnostic Imaging Centers, Research Institutes) |
| Regional Analysis/Coverage | North America (US, Canada, Mexico), Europe (Eastern Europe [Poland, Romania, Hungary, Turkey, Rest of Eastern Europe] Western Europe] Germany, France, UK, Italy, Spain, Netherlands, Switzerland, Austria, Rest of Western Europe]), Asia Pacific (China, India, Japan, South Korea, Vietnam, Singapore, Australia, Rest of Asia Pacific), Middle East & Africa (Middle East [UAE, Egypt, Saudi Arabia, Qatar, Rest of Middle East], Africa [Nigeria, South Africa, Rest of Africa], Latin America (Brazil, Argentina, Colombia, Rest of Latin America) |
| Company Profiles | GE Healthcare, Siemens Healthineers, Philips Healthcare, Canon Medical Systems Corporation, Elekta AB, Medtronic, Thermo Fisher Scientific, PerkinElmer, Invivo (a part of Philips), Hitachi Medical Systems. |
| Key Drivers | • Continuous innovations, such as hybrid imaging systems and molecular probes, have enhanced image quality and sensitivity, broadening the applications of molecular imaging. • The increasing incidence of conditions like cancer and cardiovascular diseases has escalated the demand for precise diagnostic tools, positioning molecular imaging as a vital component in early detection and personalized treatment planning. |
| Restraints | • Significant capital investment, along with operational and maintenance expenses, can limit accessibility, especially in resource-constrained settings and smaller healthcare facilities. |
