Mobile Virtual Network Operator Market Report Scope & Overview:
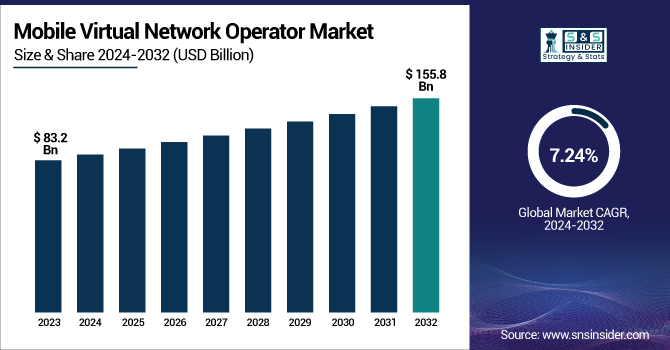
The Mobile Virtual Network Operator Market was valued at USD 83.2 billion in 2023 and is expected to reach USD 155.8 billion by 2032, growing at a CAGR of 7.24% from 2024-2032.
To Get more information on Mobile Virtual Network Operator Market - Request Free Sample Report
This report consists of key insights into the Mobile Virtual Network Operator Market, focusing on subscriber growth, market share, and revenue dynamics. It highlights the expansion of MVNO users across different regions, reflecting adoption trends and competitive positioning against traditional Mobile Network Operators. The analysis also explores revenue generation through various business models such as retail, business, and M2M services, along with regional variations in Average Revenue Per User, indicating profitability trends. Additionally, the report examines technological advancements in eSIM adoption, regulatory impacts, partnerships with 5G networks, and the growing role of MVNOs in IoT connectivity.
The growth of the U.S. The Mobile Virtual Network Operator Market was valued at USD 14.9 billion in 2023 and is expected to reach USD 27.3 billion by 2032, growing at a CAGR of 6.97% from 2024-2032. driven by increasing demand for low-cost mobile plans, expanding eSIM adoption, and partnerships with 5G network providers. Future growth is expected to be fueled by rising IoT connectivity, personalized service offerings, and regulatory support for competition. By 2030, the market is projected to see steady subscriber expansion, with ARPU growth influenced by data-driven and value-added services.
Mobile Virtual Network Operator Market Dynamics
Drivers
-
Growing consumer preference for affordable and flexible mobile plans is driving MVNO market expansion.
The rising consumer preference for affordable mobile plans is a key driver of the MVNO market. Unlike traditional Mobile Network Operators, MVNOs offer flexible, budget-friendly options with customized plans, attracting price-sensitive users, businesses, and IoT applications. Additionally, MVNOs leverage MNO infrastructure without incurring high capital expenditures, allowing them to offer competitive pricing. The growing adoption of digital services, eSIM technology, and contract-free plans further fuels market expansion. The demand for value-added services, such as bundled content, international roaming, and niche customer targeting, also supports MVNO growth. As mobile data consumption continues to rise, MVNOs are positioned to capitalize on increasing connectivity needs across various consumer and enterprise segments.
Restraints
-
MVNOs rely on MNO infrastructure, limiting pricing control, service quality, and innovation.
MVNOs rely on MNOs for network infrastructure, making them vulnerable to unfavorable pricing agreements, bandwidth limitations, and service quality constraints. Since MNOs prioritize their direct subscribers, MVNOs may face challenges in securing competitive wholesale rates, limiting their ability to offer attractive pricing. Additionally, network congestion and coverage issues can impact MVNO service reliability, affecting customer retention. Regulatory restrictions and licensing complexities further hinder MVNOs from gaining full autonomy in service offerings. This dependence also restricts innovation in network customization, preventing MVNOs from differentiating beyond pricing strategies. As MNOs expand their own cost-effective plans, MVNOs may struggle to maintain their competitive edge in the long run.
Opportunities
-
5G adoption and IoT integration create new revenue streams for MVNOs in enterprise and consumer markets.
The deployment of 5G networks creates a lot of opportunities for MVNOs to improve service offerings and create new revenue streams in both the IoT and enterprise market segments. As the need for ultra-reliable, low-latency communication continues to rise, MVNOs can leverage 5G to deliver high-speed data services for the Internet of Things, smart city initiatives, and industrial automation. The growing popularity of IoT-based applications, including smart meters, fleet management, and remote healthcare, presents MVNOs with new revenue opportunities. Collaboration with cloud providers, enterprises, and device manufacturers can give them an edge in the market as well. With the implementation of AI-powered analytics and flexible data plans, MVNOs can differentiate their services and help meet the shifting needs of consumers when it comes to accessing digital connectivity.
Challenges
-
Heavy competition and pricing pressures make profitability and customer retention challenging for MVNOs.
The MVNO space is already quite competitive, and the proliferation of players offering similar services creates price competition and lower profitability. As MVNOs require less capital investment than MNOs, they must depend on creative business plans for continued expansion. Customer acquisition and retention continue to be a battlefield, especially since MVNO and MNO plans significantly overlap in terms of available subscriptions. In addition, shifting to a 5G infrastructure can be expensive for providing networks, customer service agents, and investment in other technologies, making it burdensome for smaller MVNOs. Gainful MVNOs will need to outsell on value-add solutions, exceptional customer journey and advanced partnerships as market saturation and revenue growth underpinnings become more critical than ever.
Mobile Virtual Network Operator Market Segmentation Analysis
By type
The discount segment dominated the market and held the highest share of total revenue in 2023. The M2M segment in the mobile virtual network operator market is anticipated to experience considerable growth as machine manufacturers increasingly adopt cellular connectivity in their devices, including vehicles and vending machines. The major factors contributing to the growth of MVNOs in the M2M market include technology advancements in the 3G M2M segment, initiatives taken up by MNOs to widen their service portfolio and extend mobile network coverage.
The M2M segment is anticipated to register the fastest CAGR during the forecast period. Since different markets have fewer users, MNOs provide various service plans and products for each radio access network, resulting in costly and inefficient operational and business support systems. The cost of retaining and acquiring new customers is high, especially for fixed-term contracts
Operational Model
The full MVNO segment dominated the market and accounted for 58% of the revenue share in 2023. A full MVNO solution can be deployed with lower capital investment and complete call control to enable customers to call abroad at much lower rates. MVNOs arose from regulatory interventions designed to lower entry barriers as a way of increasing competition and the strategies of MNOs.
The reseller MVNO segment is expected to witness the fastest CAGR from 2024 to 2032. Mobile Network Operators have mobile licenses and existing infrastructure, they have existing customer relationships with their A and B users and they can handle such routing. They usually have roaming agreements with their overseas peers. Nonetheless, to grow their current consumer base and services, MNOs partner with MVNOs and focus on specialized segments.
By Service Type
In 2023, the 4G MVNO segment dominated the market and accounted for significant revenue share in 2023. The increasing demand for high-speed mobile data and better connectivity has led to the growth of the 4G MVNO segment. Easy access to videos, superior browsing experience, along quick downloading of apps enabled by 4G technology have led the consumers to opt for 4G technology, making it one of the prime reasons for the growth of the 4G MVNO segment during the forecast period.
The 5G MVNO is expected to register the fastest CAGR during the forecast period. As the 5G technology is being rolled out around the world, 5G MVNO is gaining benefits from 5G with the help of high data speed, low latency as well as increased network capacity that provides a better user experience.
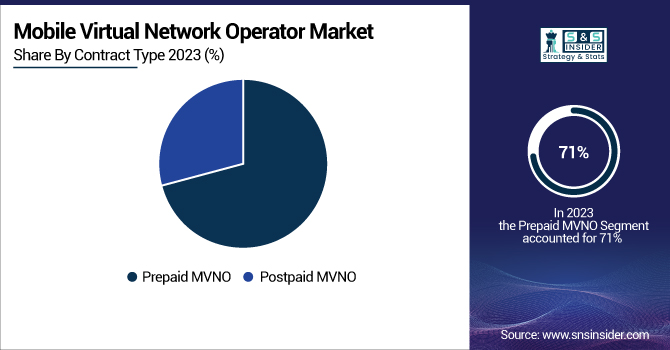
By Contract Type
In 2023, the prepaid MVNO segment dominated the market and accounted for 71% of revenue share due to benefits offered to the customers, including flexible and more cost-effective alternatives to traditional postpaid plans. In addition, the companies functioning in the mobile virtual network operator market have been introducing a wide range of initiatives, including new product launches, mergers and acquisitions, and many more, which have contributed to boosting the demand for prepaid MVNO.
The postpaid MVNO segment is expected to register the fastest CAGR during the forecast period. The postpaid MVNO primarily serves monthly customers who prefer long-term contracts in exchange for which the customers get long-term benefits.
By End-Use
The consumer segment dominated the market and accounted for a significant revenue share in 2023. As a result of network speed increase and advanced device usage, data applications have been growing such as internet browsing and video streaming. There are higher investments to enhance network coverage along with the rise in Mobile Broadband connections. The MVNO model will prove time efficient and cost effective, therefore increasing consumer conversion, which will drive the growth of this consumer segment at a high swell.
The enterprise segment is expected to register the fastest CAGR during the forecast period. In addition, the management of connected living, personal data, and growing e-commerce activities are expected to be key growth drivers for the market players during the forecast period, along with growing consumer benefits. How intelligent networks connecting a spectrum of devices are preparing enterprises for scale.
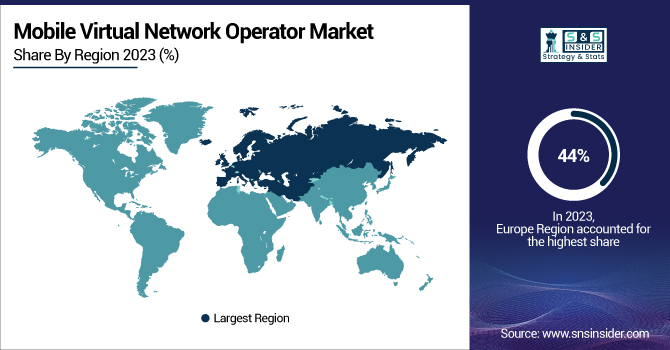
Regional Landscape
In 2023, the Europe region dominated the market and held the largest share with more than 44% of the market share in 2023. This growth can be credited to a favorable regulatory framework that will play a significant role in developing the MVNO. Projected positive growth for the period 2024 to 2032 of countries such as the U.K., Germany and the Netherlands would greatly impact regional growth. From 2024 to 2032, data services will be the main service as regional growth.
The North American MVNO Market was valued at USD 19.1 billion in 2023. One of the key factors for the MVNO market growth in North America is the underlying strategic initiatives in the region to enhance MVNO offerings. For example, T-Mobile in May 2023 announced that it had signed an exclusive multiyear MVNO with Mobi, one enabling Mobi customers to utilize the strength of the T-Mobile nationwide network from home in the islands and while traveling throughout the continental United States.
Get Customized Report as per Your Business Requirement - Enquiry Now
Key Players
The major key players along with their products are
-
TracFone Wireless – Straight Talk
-
Lycamobile – International SIM Plans
-
Ting Mobile – Flex Plan
-
Boost Mobile – Unlimited Data Plans
-
Consumer Cellular – Talk & Connect Plans
-
Google Fi – Flexible and Unlimited Plans
-
Red Pocket Mobile – eSIM Plans
-
Mint Mobile – 3-Month Intro Plan
-
Republic Wireless – Adaptive Coverage Plans
-
Metro by T-Mobile – Unlimited 5G Plan
-
Cricket Wireless – Cricket More Plan
-
Xfinity Mobile – By the Gig Plan
-
US Mobile – Customizable Plans
-
Giffgaff – Goodybag Plans
-
Visible (by Verizon) – Visible+ Unlimited Plan
Recent Developments
-
May 2024 – Freedom Mobile Launches Home Internet and TV Services Freedom Mobile began offering home internet and IPTV services by reselling Vidéotron-owned VMedia products in select markets, marking its expansion into triple-play services.
-
July 2024 – T-Mobile Introduces 'Your Name, Our Wireless' Solution T-Mobile unveiled a service simplifying the process for companies to establish and manage personalized wireless services, operating on the United States' extensive 5G network.
-
August 2024 – Lebara Acquired by Waterland Private Equity Lebara was sold to Waterland Private Equity, aiming to strengthen its position in the telecommunications market.
-
September 2024 – Workz Acquired by Trasna Holdings Workz was acquired by Ireland’s Trasna Holdings to enhance services in mobile IoT technologies, including SIM, eSIM, and SoC technology.
|
Report Attributes |
Details |
|
Market Size in 2023 |
US$ 83.2 Billion |
|
Market Size by 2032 |
US$ 155.8 Billion |
|
CAGR |
CAGR of 7.24 % From 2024 to 2032 |
|
Base Year |
2023 |
|
Forecast Period |
2024-2032 |
|
Historical Data |
2020-2022 |
|
Report Scope & Coverage |
Market Size, Segments Analysis, Competitive Landscape, Regional Analysis, DROC & SWOT Analysis, Forecast Outlook |
|
Key Segments |
• By Type (Business, Discount, M2M, Media, Migrant, Retail, Roaming, Telecom) |
|
Regional Analysis/Coverage |
North America (US, Canada, Mexico), Europe (Eastern Europe [Poland, Romania, Hungary, Turkey, Rest of Eastern Europe] Western Europe] Germany, France, UK, Italy, Spain, Netherlands, Switzerland, Austria, Rest of Western Europe]), Asia Pacific (China, India, Japan, South Korea, Vietnam, Singapore, Australia, Rest of Asia Pacific), Middle East & Africa (Middle East [UAE, Egypt, Saudi Arabia, Qatar, Rest of Middle East], Africa [Nigeria, South Africa, Rest of Africa], Latin America (Brazil, Argentina, Colombia, Rest of Latin America) |
|
Company Profiles |
TracFone Wireless, Lycamobile, Ting Mobile, Boost Mobile, Consumer Cellular, Google Fi, Red Pocket Mobile, Mint Mobile, Republic Wireless, Metro by T-Mobile, Cricket Wireless, Xfinity Mobile, US Mobile. |
