Mobile Phone Power Accessories Market Size:
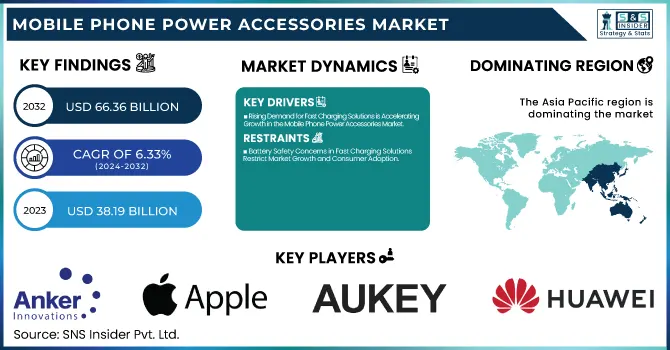
The Mobile Phone Power Accessories Market size was valued at USD 38.19 billion in 2023 and is expected to grow to USD 66.36 billion by 2032 and grow at a CAGR of 6.33 % over the forecast period of 2024-2032. Regional adoption rates are a key factor in this growth, with varying preferences for battery capacity and charging speed. Consumers are increasingly focusing on energy efficiency and sustainability, driving trends towards eco-friendly and high-performance products. Adoption and usage trends reveal a growing demand for fast, reliable charging solutions across different regions.
To Get more information on Mobile Phone Power Accessories Market - Request Free Sample Report
Additionally, price sensitivity plays a crucial role in influencing consumer choices, with affordability being a significant factor in purchase decisions. As the market evolves, these trends will shape the landscape of mobile phone power accessories, balancing performance, price, and sustainability.
Mobile Phone Power Accessories Market Dynamics:
Drivers:
-
Rising Demand for Fast Charging Solutions is Accelerating Growth in the Mobile Phone Power Accessories Market.
The increase need for efficiency for charging has also been one of the biggest contributors to the increase of the fast charging technologies used in devices such as 33W and 65W chargers, which have also contributed majorly to growth of Mobile Phone Power Accessories Market. For smartphone users looking to charge more quickly, first external power adapters and chargers are faster than ever. That trend is also being driven by innovations around things like MagSafe and other wireless charging, with more and more devices from both Android and iPhone featuring these magnetic charging solutions to make it easier for users. Market reports mentioned this growth, further, external power banks had become much more powerful and had to supply modern mobile devices. With the market moving in the direction of fast and effective charging solutions, consumers are also looking for the right product which provides high-power charging and portability.
Restraints:
-
Battery Safety Concerns in Fast Charging Solutions Restrict Market Growth and Consumer Adoption.
While fast-charging technologies have improved significantly, they also bring major safety issues such as overheating, battery damage or device failure. And fast charging can strain a mobile device’s battery, increasing the risk of temperature spikes that can shorten battery life and even damage it. Its suitable charging environment must be present by the end-user; else the end-users may likewise face performance problems of the device. Those safety concerns have prompted manufacturers to invest countless resources into better cooling systems, as well as more advanced battery management systems, but many still worry about long-term safety over time, especially as charging speeds continue to climb.
Opportunities:
-
Rising demand for lightweight, travel-friendly power banks and foldable chargers presents a significant opportunity for growth in the mobile phone power accessories market.
As consumers increasingly prioritize convenience and mobility, the demand for compact, lightweight, and portable power solutions is rising. There has been a growing demand for compact, lightweight and portable power options. As our devices occupy more and more of our daily lives, the demand for mobility-friendly products like pocket-sized power banks, which can be carried anywhere, or foldable solar chargers, which can be used on the go, are only expected to increase. We provide extreme performance in a small, portable package and we think this is an area where innovation is possible in the market. The tailwind behind this growth could be attributed to growing number of busy professionals, travelers, and outdoor enthusiasts that rely on phone chargers or power banks to improve portability, without compromising charging capacity, thereby creating an opportunity for companies in Mobile Phone Power Accessories Market.
Challenges:
-
The challenge in integrating power accessories is ensuring compatibility across various devices, systems, and charging standards, particularly with wireless charging.
As wireless charging technology has matured, one of the more prominent technical barriers for manufacturers has been to design systems that work well with a variety of smartphones and other portable devices. With so many different charging protocols being chosen by different companies, it is becoming a challenge for power accessories to be universally compatible while meeting the criteria for high-speed power delivery and safety, scaling back on supply and effectiveness of these products.
Mobile Phone Power Accessories Market Segment Analysis:
By Component
The Power Bank segment held the largest share of the Mobile Phone Power Accessories Market, contributing approximately 60% of the revenue in 2023. Driven by the increasing demand for portable power solutions as pay-per-use lifestyle consumers look for reliable and convenient ways to charge their devices on the go. Power banks are designed to meet the increasing need for portable, high-energy storage units, allowing for the charging of a myriad of smartphones, tablets and other electronic devices. Further bolstered by the rise of remote work, travel, and outdoor activities, we see an ongoing increase in the demand for power banks, which have cemented their place as essential accessories in the mobile ecosystem.
The Chargers segment is the fastest growing in the Mobile Phone Power Accessories Market during the forecast period from 2024 to 2032. This growth is fueled by the growing adoption of fast-charging tech in the form of 33W, 65W, and even 100W chargers, providing consumers with faster and more efficient charging solutions. With more smartphones, gadgets, and other electronics supporting faster charging speeds, the need for high-performance chargers will definitely only go one way. Moreover, the availability of wireless charging options and universal compatibility with various devices have enabled the segment to grow and expand rapidly, as consumers look for more versatile and convenient charging solutions.
By Sales Channel
The Offline segment dominated the Mobile Phone Power Accessories Market with a revenue share of approximately 65% in 2023. This strong market presence can be attributed to the widespread availability of mobile phone accessories through traditional retail channels, such as electronics stores, supermarkets, and brick-and-mortar outlets. Consumers continue to prefer in-store shopping for these products due to the ability to physically inspect the items, access expert advice, and make immediate purchases. Additionally, offline retailers often offer attractive deals, promotional discounts, and bundled offers, further driving consumer preference for in-person purchases. Despite the growth of online sales, the offline segment remains a significant player in the mobile power accessories market.
The Online segment is the fastest-growing in the Mobile Phone Power Accessories Market over the forecast period of 2024-2032. The increasing consumer shift to any e-commerce platform for increased convenience, wider selection, and generally better pricing. Consumers can compare multiple products, evaluate reviews, and access globally available brands without the necessity of stepping into a retail outlet or a store with the help of online channels. Online shopping has become even more appealing as mobile shopping apps have arisen, payment systems have improved, and delivery options have accelerated, all contributing to the market's proliferation. This trend is not going away, with consumers continuing to adapt to digital shopping for mobile accessories.
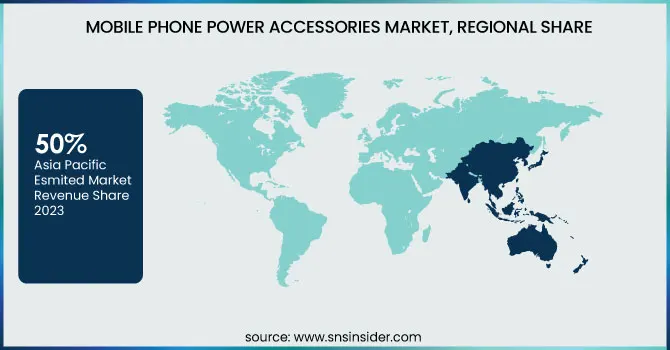
Mobile Phone Power Accessories Market Regional Overview:
The Asia-Pacific region dominated the Mobile Phone Power Accessories Market with a revenue share of around 50% in 2023. This dominance can be attributed to the demand for mobile devices and accessories, especially in countries like China, India, Japan, and South Korea. China dominates mobile phone accessory production and consumption, allowing the mobile phone accessory market to grow rapidly. The increasing penetration of smartphones, along with rapid urbanization in developing countries such as India and Southeast Asia, has also driven demand. A number of the leading accessory manufacturers are located in the region, so it serves as a focal point of innovation and competitive pricing. With the increase in mobile device usage and 5G penetration, Asia-pacific are likely to dominate the market till 2032.
The North American region is expected to be the fastest-growing market for mobile phone power accessories over the forecast period of 2024-2032. with the increase of smartphone and tablets and other portable device, has increased the demand for efficient charging solution. The region's advanced customer base is suited for next-generation supplements, such as quick charge electricity banks and remote control frameworks. The growing work-from-home and mobile gaming trend further increases the prospects for portable charging devices. In addition, they have supported by dominating brands such as Anker & Belkin and a strong retail store and e-commerce channels promote steady growth in the market. North America’s rapid adoption of emerging technology (5G, electric vehicles, etc.) is also an enabler of growth.
Get Customized Report as per Your Business Requirement - Enquiry Now
Key Players:
Some of the Major Players in Mobile Phone Power Accessories Market along with their product:
-
Anker Innovations Ltd. (China) (Power Banks, Wireless Chargers, Wall Chargers, Car Chargers)
-
Apple Inc. (United States) (Charging Cables, Wireless Chargers, Power Adapters, MagSafe Accessories)
-
Aukey (China) (Power Banks, Wall Chargers, Wireless Chargers, Car Chargers)
-
BBK Electronics Corp. Ltd. (China) (Power Banks, Charging Accessories, Smartphone Chargers)
-
Belkin International, Inc. (United States) (Wireless Chargers, Power Banks, USB-C Cables, Surge Protectors)
-
Google LLC (United States) (Power Adapters, Wireless Charging Stands, Pixel Chargers)
-
Huawei Technology Co., Ltd. (China) (Power Banks, Wall Chargers, Fast Chargers, Wireless Chargers)
-
Samsung Electronics Co., Ltd. (South Korea) (Wireless Chargers, Power Banks, USB-C Cables, Fast Chargers)
-
Xiaomi Corporation (China) (Power Banks, Wall Chargers, Wireless Chargers, Car Chargers)
-
Ventev (United States) (Wall Chargers, Power Banks, Charging Cables, Wireless Chargers)
-
Griffin Technology (United States) (Wireless Chargers, Power Banks, Car Chargers, Charging Cables)
List of Suppliers who provide raw material and component in Mobile Phone Power Accessories Market:
-
LG Chem (South Korea)
-
Samsung SDI (South Korea)
-
Panasonic Corporation (Japan)
-
ATL (Amperex Technology Limited) (China)
-
BYD Company Limited (China)
-
EVE Energy Co., Ltd. (China)
-
Murata Manufacturing Co., Ltd. (Japan)
-
Varta AG (Germany)
-
Texas Instruments (United States)
-
Qualcomm Technologies (United States)
-
SK Innovation (South Korea)
Recent Development
-
On Jan. 8, 2025 Anker Innovations Introduces Revolutionary Charging Solutions at CES 2025, Anker exhibited the 25,000mAh Power Bank, Anker 140W Charger and EverForest 2 Electric Cooler all Galliumnitride (Gan)-integrated consumer electronics that can charge faster and safer with the Anker Prime Charging Docking Station winning a CES Innovation Award.
-
On Dec. 30, 2024 Xiaomi launches Magnetic Power Bank with built-in cable – 10000 magnetic wireless power bank allows for 33W wired charging and 7.5W wireless charging, priced USD 23 in China, 10,000mAh capacity.
| Report Attributes | Details |
|---|---|
| Market Size in 2023 | USD 38.19 Billion |
| Market Size by 2032 | USD 66.36 Billion |
| CAGR | CAGR of 6.33% From 2024 to 2032 |
| Base Year | 2023 |
| Forecast Period | 2024-2032 |
| Historical Data | 2020-2022 |
| Report Scope & Coverage | Market Size, Segments Analysis, Competitive Landscape, Regional Analysis, DROC & SWOT Analysis, Forecast Outlook |
| Key Segments | • By Component (Power Bank, Chargers) • By Sales Channel (Online, Offline) |
| Regional Analysis/Coverage | North America (US, Canada, Mexico), Europe (Eastern Europe [Poland, Romania, Hungary, Turkey, Rest of Eastern Europe] Western Europe] Germany, France, UK, Italy, Spain, Netherlands, Switzerland, Austria, Rest of Western Europe]), Asia Pacific (China, India, Japan, South Korea, Vietnam, Singapore, Australia, Rest of Asia Pacific), Middle East & Africa (Middle East [UAE, Egypt, Saudi Arabia, Qatar, Rest of Middle East], Africa [Nigeria, South Africa, Rest of Africa], Latin America (Brazil, Argentina, Colombia, Rest of Latin America) |
| Company Profiles | Anker Innovations Ltd. (China), Apple Inc. (United States), Aukey (China), BBK Electronics Corp. Ltd. (China), Belkin International, Inc. (United States), Google LLC (United States), Huawei Technology Co., Ltd. (China), Samsung Electronics Co., Ltd. (South Korea), Xiaomi Corporation (China), Ventev (United States), Griffin Technology (United States). |
