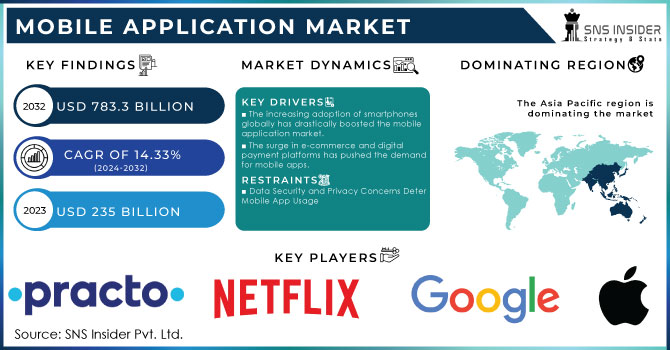
The Mobile Application Market Size was valued at USD 245.71 Billion in 2023 and is expected to reach USD 813.07 Billion by 2032 and grow at a CAGR of 14.3% over the forecast period 2024-2032. The Market is driven by key performance indicators (KPIs) such as ARPU, app download rates, and active user statistics, offering insights into monetization and engagement. Consumer behavior metrics, including session duration, retention, and uninstall rates, help analyze user interaction. Subscription-based revenue trends highlight the rise of premium models, in-app purchases, and freemium offerings. Advertising revenue share tracks mobile ad earnings, while app category performance compares growth across gaming, entertainment, and e-commerce. Security statistics monitor data breaches, while cloud-based app deployment and emerging technologies like AI, AR/VR, and blockchain shape future trends. Developer ecosystem insights reflect innovation and industry expansion.
Get More Information on Mobile Application Market - Request Sample Report
Key Drivers:
Growing Adoption of AI and AR/VR Technologies Drives the Mobile Application Market Growth
The increasing integration of AI and AR/VR technologies is a significant driver for the Mobile Application Market. AI-powered applications enhance user experiences through personalized recommendations, chatbots, and voice assistants, while AR/VR-based apps transform sectors such as gaming, retail, real estate, and healthcare by offering immersive experiences. Companies like Google and Apple have introduced AI-driven app development tools, further accelerating innovation. For instance, Apple’s ARKit and Google’s ARCore enable developers to create AR-based mobile applications, boosting market demand. Additionally, AI-driven automation in mobile apps improves efficiency in industries like fintech, healthcare, and e-commerce. As mobile devices become more powerful, AI and AR/VR adoption will continue to rise, fueling market expansion.
Restrain:
High App Development Costs and Complex Maintenance Restrain the Mobile Application Market Growth
Despite rapid growth, high development and maintenance costs remain a key restraint for the Mobile Application Market. Creating a high-quality, feature-rich mobile application requires significant investment in development, testing, and deployment, often making it inaccessible to small and medium-sized enterprises (SMEs). Moreover, ongoing updates, security patches, and compatibility with new OS versions add to long-term expenses. Developers must also account for cross-platform compatibility, ensuring smooth functionality across Android, iOS, and other platforms. Additionally, cloud infrastructure costs for hosting, storage, and data processing can further strain budgets. Companies like Microsoft and IBM offer low-code/no-code development platforms to mitigate costs, but these solutions have limitations in customization. As businesses seek cost-effective alternatives, budget constraints may hinder the adoption of advanced mobile applications, slowing market growth.
Opportunities:
Rising Demand for Subscription-Based and In-App Purchase Models Creates Lucrative Opportunities in the Mobile Application Market
The increasing shift toward subscription-based and in-app purchase (IAP) revenue models presents significant opportunities in the Mobile Application Market. Consumers are willing to pay for premium services, exclusive content, and ad-free experiences, driving the adoption of subscription-based apps across gaming, entertainment, fitness, and productivity segments. Streaming giants like Netflix and Spotify have successfully implemented subscription models, while gaming apps leverage IAP for in-game enhancements. Apple and Google’s introduction of subscription-based app monetization further validates this trend, allowing developers to generate consistent revenue. Additionally, enterprise mobile applications, including SaaS-based productivity tools, are embracing subscription pricing, increasing market potential. As digital payments and mobile wallets grow in popularity, seamless payment integration enhances user convenience, further boosting adoption. The shift towards subscription and IAP models ensures steady revenue streams, making it a key growth opportunity for developers and businesses.
Challenges:
Data Privacy Concerns and Regulatory Compliance Pose Challenges for the Mobile Application Market Growth
Data privacy concerns and stringent regulatory compliance requirements present significant challenges for the Mobile Application Market. With increasing cyber threats and data breaches, users demand greater transparency and control over their personal information. Regulations like GDPR, CCPA, and India’s Digital Personal Data Protection Act impose strict data handling and consent policies, requiring app developers to enhance security measures. Companies like Apple have implemented App Tracking Transparency (ATT) to improve user privacy, impacting targeted advertising revenues for businesses relying on user data. Additionally, compliance with multiple international regulations increases operational complexity and legal risks. Developers must invest in robust encryption, secure data storage, and transparent privacy policies to maintain consumer trust. Failure to comply can result in heavy penalties, legal actions, and reputational damage. As data protection regulations evolve, mobile application providers must continuously adapt, making privacy and compliance a persistent challenge for the industry.
By Application
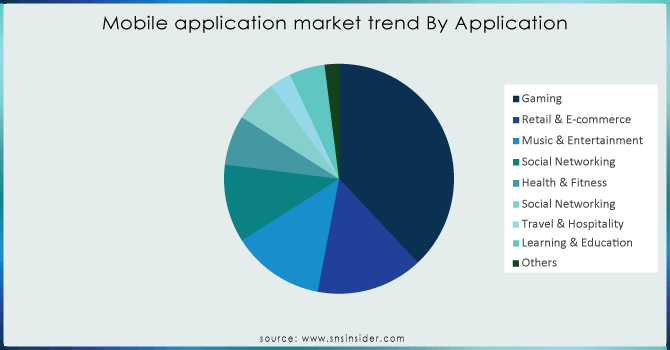
The Gaming segment emerged as the dominant application in the Mobile Application Market, accounting for 43% of total revenue in 2023. The increasing popularity of mobile gaming, driven by advancements in smartphone technology, 5G connectivity, and cloud gaming services, has fueled this growth. Companies like Tencent, Activision Blizzard, and Ubisoft have been investing heavily in mobile game development.
Tencent’s Honor of Kings and PUBG Mobile have consistently ranked among the highest-grossing mobile games, while Activision Blizzard’s Call of Duty: Mobile has further strengthened the segment.
Additionally, the rise of gaming subscription services, such as Apple Arcade and Google Play Pass, has contributed to user engagement and monetization. Cloud gaming platforms like NVIDIA GeForce NOW and Xbox Cloud Gaming allow users to play high-end games without high-end hardware, making mobile gaming more accessible.
The Music and Entertainment segment is expected to grow at the highest CAGR of 16.4% during the forecasted period, driven by the increasing demand for streaming services, digital content consumption, and personalized entertainment experiences. The proliferation of mobile-first entertainment platforms such as Netflix, Spotify, and YouTube have reshaped the way users engage with content.
The integration of virtual reality (VR) and AR in entertainment applications, such as Meta’s Horizon Worlds and Apple’s Vision Pro, is also transforming content consumption. As 5G networks expand globally, providing high-speed connectivity, seamless streaming, and interactive entertainment experiences will continue to propel the growth of the Mobile Application Market.
By Store
The Apple Store segment held the largest share of the Mobile Application Market, contributing 64% of total revenue in 2023. This dominance is attributed to Apple’s strong ecosystem, high consumer spending on premium apps, and the success of subscription-based services. Apple’s App Store generates significant revenue through in-app purchases, premium app downloads, and subscription services like Apple Music, Apple Arcade, and Apple TV+.
Additionally, Apple's strict app review policies ensure high-quality and secure applications, making it a preferred platform for developers targeting high-value customers. In 2023, Apple introduced new features such as enhanced privacy controls, in-app event promotions, and expanded support for alternative payment methods in select regions.
The Google Store segment is projected to grow at the highest CAGR of 15.8% in the forecasted period, driven by the increasing penetration of Android devices, the expansion of emerging markets, and Google's focus on app monetization strategies. Google Play Store benefits from a larger global user base, particularly in Asia-Pacific, Latin America, and Africa, where Android smartphones dominate.
The rise of budget-friendly smartphones from companies like Samsung, Xiaomi, and Oppo has contributed to the growing number of app downloads. In 2023, Google introduced features like Play Points rewards, AI-powered app discovery, and expanded support for Progressive Web Apps (PWAs) to enhance user experience.
Need any customization research on Mobile Applications Market - Enquiry Now
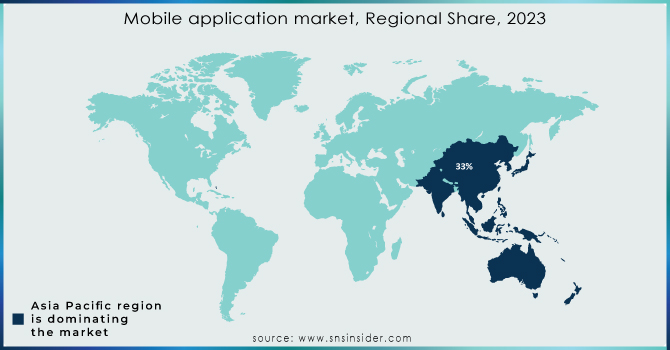
Asia Pacific held the largest share of the Mobile Application Market in 2023, accounting for approximately 35% of global revenue. This dominance is driven by the region’s massive smartphone user base, increasing internet penetration, and growing consumer spending on mobile applications.
Furthermore, mobile payments and e-commerce applications are thriving in Southeast Asia, where companies like Grab and Shopee continue to expand their digital ecosystems. With rising demand for mobile entertainment, fintech, and social networking applications, Asia Pacific remains the dominant force in the Mobile Application Market.
North America emerged as the fastest-growing region in the Mobile Application Market in 2023, with an estimated CAGR of 15.4% during the forecast period. The region’s growth is fueled by high consumer spending on mobile applications, advanced 5G adoption, and a strong developer ecosystem. The U.S. and Canada are leading markets, with significant revenue generated from subscription-based services such as Netflix, Disney+, and Spotify.
Additionally, North America is at the forefront of integrating AI, AR/VR, and blockchain into mobile applications, enhancing user engagement and app functionalities. The increasing adoption of mobile wallets, fintech applications, and on-demand services has further accelerated market expansion. With high disposable income, tech-savvy consumers, and strong innovation, North America continues to drive rapid growth in the Mobile Application Market.
Some of the major players in the Mobile Application Market are:
Apple Inc. (App Store, Apple Music)
Google (Google Play Store, Google Maps)
Amazon.com, Inc. (Amazon Shopping App, Amazon Prime Video)
Gameloft (Asphalt 9: Legends, Modern Combat 5)
Netflix, Inc.(Netflix Mobile App, Netflix Games)
Practo (Practo Health App, Practo Ray)
cult.fit (cult.fit Fitness App, mind.fit Meditation App)
Ubisoft Entertainment (Assassin’s Creed Rebellion, Just Dance Now)
Xiaomi (Mi Fit, Xiaomi App Store)
Intellectsoft US (Mobile Banking Solutions, Enterprise App Development)
Microsoft (Microsoft Office Mobile, Xbox Game Pass App)
International Business Machines Corporation (IBM MobileFirst, IBM Watson Health App)
Cognizant (Cognizant Digital App Services, AI-Powered Enterprise Mobility Solutions)
CA Technologies, Inc. (CA Mobile API Gateway, CA App Experience Analytics)
Verbat Technologies (Custom Mobile App Development, Verbat AI Chatbot)
China Mobile Limited (Migu Video, China Mobile Cloud App)
Hewlett Packard Enterprise Development LP (HPE Mobile Center, HPE Intelligent Edge Mobile App)
In September 2023, Google rolled out new functionalities on YouTube aimed at assisting creators in enhancing, crafting, and distributing content more efficiently. One feature, named 'Dream Screen,' enables creators to include AI-generated video or image backgrounds in YouTube Shorts. These updates are designed to assist creators in expanding their audience and simplifying time-consuming tasks.
Apple Inc. released Freeform, a new app for iPad, Mac, and iPhone, in December 2022. Freeform helps users arrange content on a versatile canvas, allowing them to share and work together on one platform. The application provides users with a range of colour choices and brush designs to create diagrams and include annotations.
Report Attributes | Details |
---|---|
Market Size in 2023 | US$ 245.71 Billion |
Market Size by 2032 | US$ 813.07 Billion |
CAGR | CAGR of 14.3 % From 2024 to 2032 |
Base Year | 2023 |
Forecast Period | 2024-2032 |
Historical Data | 2020-2022 |
Report Scope & Coverage | Market Size, Segments Analysis, Competitive Landscape, Regional Analysis, DROC & SWOT Analysis, Forecast Outlook |
Key Segments | • By Store Type (Google Store, Apple Store, Others) • By Application Type (Gaming, Music & Entertainment, Health & Fitness, Social Networking, Retail & e-Commerce, Travel & Hospitality, Learning & Education, Others) |
Regional Analysis/Coverage | North America (US, Canada, Mexico), Europe (Eastern Europe [Poland, Romania, Hungary, Turkey, Rest of Eastern Europe] Western Europe] Germany, France, UK, Italy, Spain, Netherlands, Switzerland, Austria, Rest of Western Europe]), Asia Pacific (China, India, Japan, South Korea, Vietnam, Singapore, Australia, Rest of Asia Pacific), Middle East & Africa (Middle East [UAE, Egypt, Saudi Arabia, Qatar, Rest of Middle East], Africa [Nigeria, South Africa, Rest of Africa], Latin America (Brazil, Argentina, Colombia, Rest of Latin America) |
Company Profiles | Apple Inc., Google, Amazon.com, Inc., Gameloft, Netflix, Inc., Practo, cult.fit, Ubisoft Entertainment, Xiaomi, Intellectsoft US, Microsoft Corporation, International Business Machines Corporation, Cognizant, CA Technologies, Inc., Verbat Technologies, China Mobile Limited, Hewlett Packard Enterprise Development LP. |
Ans: The Mobile Application Market is expected to grow at a CAGR of 14.3% during 2024-2032.
Ans: The Mobile Application Market size was USD 245.71 billion in 2023 and is expected to Reach USD 813.07 billion by 2032.
Ans: The major growth factor of the Mobile Application Market is the increasing smartphone penetration, rising internet connectivity, and growing demand for mobile-based digital services.
Ans: The Gaming segment dominated the Mobile application market.
Ans: Asia Pacific dominated the Mobile Application Market in 2023.
1. Introduction
1.1 Market Definition
1.2 Scope (Inclusion and Exclusions)
1.3 Research Assumptions
2. Executive Summary
2.1 Market Overview
2.2 Regional Synopsis
2.3 Competitive Summary
3. Research Methodology
3.1 Top-Down Approach
3.2 Bottom-up Approach
3.3. Data Validation
3.4 Primary Interviews
4. Market Dynamics Impact Analysis
4.1 Market Driving Factors Analysis
4.1.2 Drivers
4.1.2 Restraints
4.1.3 Opportunities
4.1.4 Challenges
4.2 PESTLE Analysis
4.3 Porter’s Five Forces Model
5. Statistical Insights and Trends Reporting
5.1 Average Revenue Per User (ARPU) (2023)
5.2 Advertising Revenue Share
5.3 App Category Performance (2023)
5.4 Developer Ecosystem Statistics
6. Competitive Landscape
6.1 List of Major Companies, By Region
6.2 Market Share Analysis, By Region
6.3 Product Benchmarking
6.3.1 Product specifications and features
6.3.2 Pricing
6.4 Strategic Initiatives
6.4.1 Marketing and promotional activities
6.4.2 Distribution and supply chain strategies
6.4.3 Expansion plans and new product launches
6.4.4 Strategic partnerships and collaborations
6.5 Technological Advancements
6.6 Market Positioning and Branding
7. Mobile application Market Segmentation, By Store
7.1 Chapter Overview
7.2 Google Store
7.2.1 Google Store Market Trends Analysis (2020-2032)
7.2.2 Google Store Market Size Estimates and Forecasts to 2032 (USD Billion)
7.3 Apple Store
7.3.1 Apple Store Market Trends Analysis (2020-2032)
7.3.2 Apple Store Market Size Estimates and Forecasts to 2032 (USD Billion)
7.4 Others
7.4.1 Others Market Trends Analysis (2020-2032)
7.4.2 Others Market Size Estimates and Forecasts to 2032 (USD Billion)
8. Mobile application Market Segmentation, By Application
8.1 Chapter Overview
8.2 Gaming
8.2.1 Gaming Market Trends Analysis (2020-2032)
8.2.2 Gaming Market Size Estimates and Forecasts to 2032 (USD Billion)
8.3 Music & Entertainment
8.3.1 Music & Entertainment Market Trends Analysis (2020-2032)
8.3.2 Music & Entertainment Market Size Estimates and Forecasts to 2032 (USD Billion)
8.4 Health & Fitness
8.2.1 Health & Fitness Market Trends Analysis (2020-2032)
8.4.2 Health & Fitness Market Size Estimates and Forecasts to 2032 (USD Billion)
8.5 Social Networking
8.5.1 Social Networking Market Trends Analysis (2020-2032)
8.5.2 Social Networking Market Size Estimates and Forecasts to 2032 (USD Billion)
8.6 Retail & e-Commerce
8.6.1 Retail & e-Commerce Market Trends Analysis (2020-2032)
8.6.2 Retail & e-Commerce Market Size Estimates and Forecasts to 2032 (USD Billion)
8.7 Travel & Hospitality
8.7.1 Travel & Hospitality Market Trends Analysis (2020-2032)
8.7.2 Travel & Hospitality Market Size Estimates and Forecasts to 2032 (USD Billion)
8.8 Learning & Education
8.8.1 Learning & Education Market Trends Analysis (2020-2032)
8.8.2 Learning & Education Market Size Estimates and Forecasts to 2032 (USD Billion)
8.9 Others
8.9.1 Others Market Trends Analysis (2020-2032)
8.9.2 Others Market Size Estimates and Forecasts to 2032 (USD Billion)
9. Regional Analysis
9.1 Chapter Overview
9.2 North America
9.2.1 Trends Analysis
9.2.2 North America Mobile application Market Estimates and Forecasts, by Country (2020-2032) (USD Billion)
9.2.3 North America Mobile application Market Estimates and Forecasts, By Store (2020-2032) (USD Billion)
9.2.4 North America Mobile application Market Estimates and Forecasts, By Application (2020-2032) (USD Billion)
9.2.5 USA
9.2.5.1 USA Mobile application Market Estimates and Forecasts, By Store (2020-2032) (USD Billion)
9.2.5.2 USA Mobile application Market Estimates and Forecasts, By Application (2020-2032) (USD Billion)
9.2.6 Canada
9.2.6.1 Canada Mobile application Market Estimates and Forecasts, By Store (2020-2032) (USD Billion)
9.2.6.2 Canada Mobile application Market Estimates and Forecasts, By Application (2020-2032) (USD Billion)
9.2.7 Mexico
9.2.7.1 Mexico Mobile application Market Estimates and Forecasts, By Store (2020-2032) (USD Billion)
9.2.7.2 Mexico Mobile application Market Estimates and Forecasts, By Application (2020-2032) (USD Billion)
9.3 Europe
9.3.1 Eastern Europe
9.3.1.1 Trends Analysis
9.3.1.2 Eastern Europe Mobile application Market Estimates and Forecasts, by Country (2020-2032) (USD Billion)
9.3.1.3 Eastern Europe Mobile application Market Estimates and Forecasts, By Store (2020-2032) (USD Billion)
9.3.1.4 Eastern Europe Mobile application Market Estimates and Forecasts, By Application (2020-2032) (USD Billion)
9.3.1.5 Poland
9.3.1.5.1 Poland Mobile application Market Estimates and Forecasts, By Store (2020-2032) (USD Billion)
9.3.1.5.2 Poland Mobile application Market Estimates and Forecasts, By Application (2020-2032) (USD Billion)
9.3.1.6 Romania
9.3.1.6.1 Romania Mobile application Market Estimates and Forecasts, By Store (2020-2032) (USD Billion)
9.3.1.6.2 Romania Mobile application Market Estimates and Forecasts, By Application (2020-2032) (USD Billion)
9.3.1.7 Hungary
9.3.1.7.1 Hungary Mobile application Market Estimates and Forecasts, By Store (2020-2032) (USD Billion)
9.3.1.7.2 Hungary Mobile application Market Estimates and Forecasts, By Application (2020-2032) (USD Billion)
9.3.1.8 Turkey
9.3.1.8.1 Turkey Mobile application Market Estimates and Forecasts, By Store (2020-2032) (USD Billion)
9.3.1.8.2 Turkey Mobile application Market Estimates and Forecasts, By Application (2020-2032) (USD Billion)
9.3.1.9 Rest of Eastern Europe
9.3.1.9.1 Rest of Eastern Europe Mobile application Market Estimates and Forecasts, By Store (2020-2032) (USD Billion)
9.3.1.9.2 Rest of Eastern Europe Mobile application Market Estimates and Forecasts, By Application (2020-2032) (USD Billion)
9.3.2 Western Europe
9.3.2.1 Trends Analysis
9.3.2.2 Western Europe Mobile application Market Estimates and Forecasts, by Country (2020-2032) (USD Billion)
9.3.2.3 Western Europe Mobile application Market Estimates and Forecasts, By Store (2020-2032) (USD Billion)
9.3.2.4 Western Europe Mobile application Market Estimates and Forecasts, By Application (2020-2032) (USD Billion)
9.3.2.5 Germany
9.3.2.5.1 Germany Mobile application Market Estimates and Forecasts, By Store (2020-2032) (USD Billion)
9.3.2.5.2 Germany Mobile application Market Estimates and Forecasts, By Application (2020-2032) (USD Billion)
9.3.2.6 France
9.3.2.6.1 France Mobile application Market Estimates and Forecasts, By Store (2020-2032) (USD Billion)
9.3.2.6.2 France Mobile application Market Estimates and Forecasts, By Application (2020-2032) (USD Billion)
9.3.2.7 UK
9.3.2.7.1 UK Mobile application Market Estimates and Forecasts, By Store (2020-2032) (USD Billion)
9.3.2.7.2 UK Mobile application Market Estimates and Forecasts, By Application (2020-2032) (USD Billion)
9.3.2.8 Italy
9.3.2.8.1 Italy Mobile application Market Estimates and Forecasts, By Store (2020-2032) (USD Billion)
9.3.2.8.2 Italy Mobile application Market Estimates and Forecasts, By Application (2020-2032) (USD Billion)
9.3.2.9 Spain
9.3.2.9.1 Spain Mobile application Market Estimates and Forecasts, By Store (2020-2032) (USD Billion)
9.3.2.9.2 Spain Mobile application Market Estimates and Forecasts, By Application (2020-2032) (USD Billion)
9.3.2.10 Netherlands
9.3.2.10.1 Netherlands Mobile application Market Estimates and Forecasts, By Store (2020-2032) (USD Billion)
9.3.2.10.2 Netherlands Mobile application Market Estimates and Forecasts, By Application (2020-2032) (USD Billion)
9.3.2.11 Switzerland
9.3.2.11.1 Switzerland Mobile application Market Estimates and Forecasts, By Store (2020-2032) (USD Billion)
9.3.2.11.2 Switzerland Mobile application Market Estimates and Forecasts, By Application (2020-2032) (USD Billion)
9.3.2.12 Austria
9.3.2.12.1 Austria Mobile application Market Estimates and Forecasts, By Store (2020-2032) (USD Billion)
9.3.2.12.2 Austria Mobile application Market Estimates and Forecasts, By Application (2020-2032) (USD Billion)
9.3.2.13 Rest of Western Europe
9.3.2.13.1 Rest of Western Europe Mobile application Market Estimates and Forecasts, By Store (2020-2032) (USD Billion)
9.3.2.13.2 Rest of Western Europe Mobile application Market Estimates and Forecasts, By Application (2020-2032) (USD Billion)
9.4 Asia Pacific
9.4.1 Trends Analysis
9.4.2 Asia Pacific Mobile application Market Estimates and Forecasts, by Country (2020-2032) (USD Billion)
9.4.3 Asia Pacific Mobile application Market Estimates and Forecasts, By Store (2020-2032) (USD Billion)
9.4.4 Asia Pacific Mobile application Market Estimates and Forecasts, By Application (2020-2032) (USD Billion)
9.4.5 China
9.4.5.1 China Mobile application Market Estimates and Forecasts, By Store (2020-2032) (USD Billion)
9.4.5.2 China Mobile application Market Estimates and Forecasts, By Application (2020-2032) (USD Billion)
9.4.6 India
9.4.5.1 India Mobile application Market Estimates and Forecasts, By Store (2020-2032) (USD Billion)
9.4.5.2 India Mobile application Market Estimates and Forecasts, By Application (2020-2032) (USD Billion)
9.4.5 Japan
9.4.5.1 Japan Mobile application Market Estimates and Forecasts, By Store (2020-2032) (USD Billion)
9.4.5.2 Japan Mobile application Market Estimates and Forecasts, By Application (2020-2032) (USD Billion)
9.4.6 South Korea
9.4.6.1 South Korea Mobile application Market Estimates and Forecasts, By Store (2020-2032) (USD Billion)
9.4.6.2 South Korea Mobile application Market Estimates and Forecasts, By Application (2020-2032) (USD Billion)
9.4.7 Vietnam
9.4.7.1 Vietnam Mobile application Market Estimates and Forecasts, By Store (2020-2032) (USD Billion)
9.2.7.2 Vietnam Mobile application Market Estimates and Forecasts, By Application (2020-2032) (USD Billion)
9.4.8 Singapore
9.4.8.1 Singapore Mobile application Market Estimates and Forecasts, By Store (2020-2032) (USD Billion)
9.4.8.2 Singapore Mobile application Market Estimates and Forecasts, By Application (2020-2032) (USD Billion)
9.4.9 Australia
9.4.9.1 Australia Mobile application Market Estimates and Forecasts, By Store (2020-2032) (USD Billion)
9.4.9.2 Australia Mobile application Market Estimates and Forecasts, By Application (2020-2032) (USD Billion)
9.4.10 Rest of Asia Pacific
9.4.10.1 Rest of Asia Pacific Mobile application Market Estimates and Forecasts, By Store (2020-2032) (USD Billion)
9.4.10.2 Rest of Asia Pacific Mobile application Market Estimates and Forecasts, By Application (2020-2032) (USD Billion)
9.5 Middle East and Africa
9.5.1 Middle East
9.5.1.1 Trends Analysis
9.5.1.2 Middle East Mobile application Market Estimates and Forecasts, by Country (2020-2032) (USD Billion)
9.5.1.3 Middle East Mobile application Market Estimates and Forecasts, By Store (2020-2032) (USD Billion)
9.5.1.4 Middle East Mobile application Market Estimates and Forecasts, By Application (2020-2032) (USD Billion)
9.5.1.5 UAE
9.5.1.5.1 UAE Mobile application Market Estimates and Forecasts, By Store (2020-2032) (USD Billion)
9.5.1.5.2 UAE Mobile application Market Estimates and Forecasts, By Application (2020-2032) (USD Billion)
9.5.1.6 Egypt
9.5.1.6.1 Egypt Mobile application Market Estimates and Forecasts, By Store (2020-2032) (USD Billion)
9.5.1.6.2 Egypt Mobile application Market Estimates and Forecasts, By Application (2020-2032) (USD Billion)
9.5.1.7 Saudi Arabia
9.5.1.7.1 Saudi Arabia Mobile application Market Estimates and Forecasts, By Store (2020-2032) (USD Billion)
9.5.1.7.2 Saudi Arabia Mobile application Market Estimates and Forecasts, By Application (2020-2032) (USD Billion)
9.5.1.8 Qatar
9.5.1.8.1 Qatar Mobile application Market Estimates and Forecasts, By Store (2020-2032) (USD Billion)
9.5.1.8.2 Qatar Mobile application Market Estimates and Forecasts, By Application (2020-2032) (USD Billion)
9.5.1.9 Rest of Middle East
9.5.1.9.1 Rest of Middle East Mobile application Market Estimates and Forecasts, By Store (2020-2032) (USD Billion)
9.5.1.9.2 Rest of Middle East Mobile application Market Estimates and Forecasts, By Application (2020-2032) (USD Billion)
9.5.2 Africa
9.5.2.1 Trends Analysis
9.5.2.2 Africa Mobile application Market Estimates and Forecasts, by Country (2020-2032) (USD Billion)
9.5.2.3 Africa Mobile application Market Estimates and Forecasts, By Store (2020-2032) (USD Billion)
9.5.2.4 Africa Mobile application Market Estimates and Forecasts, By Application (2020-2032) (USD Billion)
9.5.2.5 South Africa
9.5.2.5.1 South Africa Mobile application Market Estimates and Forecasts, By Store (2020-2032) (USD Billion)
9.5.2.5.2 South Africa Mobile application Market Estimates and Forecasts, By Application (2020-2032) (USD Billion)
9.5.2.6 Nigeria
9.5.2.6.1 Nigeria Mobile application Market Estimates and Forecasts, By Store (2020-2032) (USD Billion)
9.5.2.6.2 Nigeria Mobile application Market Estimates and Forecasts, By Application (2020-2032) (USD Billion)
9.5.2.7 Rest of Africa
9.5.2.7.1 Rest of Africa Mobile application Market Estimates and Forecasts, By Store (2020-2032) (USD Billion)
9.5.2.7.2 Rest of Africa Mobile application Market Estimates and Forecasts, By Application (2020-2032) (USD Billion)
9.6 Latin America
9.6.1 Trends Analysis
9.6.2 Latin America Mobile application Market Estimates and Forecasts, by Country (2020-2032) (USD Billion)
9.6.3 Latin America Mobile application Market Estimates and Forecasts, By Store (2020-2032) (USD Billion)
9.6.4 Latin America Mobile application Market Estimates and Forecasts, By Application (2020-2032) (USD Billion)
9.6.5 Brazil
9.6.5.1 Brazil Mobile application Market Estimates and Forecasts, By Store (2020-2032) (USD Billion)
9.6.5.2 Brazil Mobile application Market Estimates and Forecasts, By Application (2020-2032) (USD Billion)
9.6.6 Argentina
9.6.6.1 Argentina Mobile application Market Estimates and Forecasts, By Store (2020-2032) (USD Billion)
9.6.6.2 Argentina Mobile application Market Estimates and Forecasts, By Application (2020-2032) (USD Billion)
9.6.7 Colombia
9.6.7.1 Colombia Mobile application Market Estimates and Forecasts, By Store (2020-2032) (USD Billion)
9.6.7.2 Colombia Mobile application Market Estimates and Forecasts, By Application (2020-2032) (USD Billion)
9.6.8 Rest of Latin America
9.6.8.1 Rest of Latin America Mobile application Market Estimates and Forecasts, By Store (2020-2032) (USD Billion)
9.6.8.2 Rest of Latin America Mobile application Market Estimates and Forecasts, By Application (2020-2032) (USD Billion)
10. Company Profiles
10.1 Apple Inc.
10.1.1 Company Overview
10.1.2 Financial
10.1.3 Products/ Services Offered
110.1.4 SWOT Analysis
10.2 Google
10.2.1 Company Overview
10.2.2 Financial
10.2.3 Products/ Services Offered
10.2.4 SWOT Analysis
10.3 Amazon.com, Inc.
10.3.1 Company Overview
10.3.2 Financial
10.3.3 Products/ Services Offered
10.3.4 SWOT Analysis
10.4 Gameloft
10.4.1 Company Overview
10.4.2 Financial
10.4.3 Products/ Services Offered
10.4.4 SWOT Analysis
10.5 Netflix, Inc.
10.5.1 Company Overview
10.5.2 Financial
10.5.3 Products/ Services Offered
10.5.4 SWOT Analysis
10.6 Practo
10.6.1 Company Overview
10.6.2 Financial
10.6.3 Products/ Services Offered
10.6.4 SWOT Analysis
10.7 cult.fit
10.7.1 Company Overview
10.7.2 Financial
10.7.3 Products/ Services Offered
10.7.4 SWOT Analysis
10.8 Ubisoft Entertainment
10.8.1 Company Overview
10.8.2 Financial
10.8.3 Products/ Services Offered
10.8.4 SWOT Analysis
10.9 Xiaomi
10.9.1 Company Overview
10.9.2 Financial
10.9.3 Products/ Services Offered
10.9.4 SWOT Analysis
10.10 Intellectsoft US
10.9.1 Company Overview
10.9.2 Financial
10.9.3 Products/ Services Offered
10.9.4 SWOT Analysis
11. Use Cases and Best Practices
12. Conclusion
An accurate research report requires proper strategizing as well as implementation. There are multiple factors involved in the completion of good and accurate research report and selecting the best methodology to compete the research is the toughest part. Since the research reports we provide play a crucial role in any company’s decision-making process, therefore we at SNS Insider always believe that we should choose the best method which gives us results closer to reality. This allows us to reach at a stage wherein we can provide our clients best and accurate investment to output ratio.
Each report that we prepare takes a timeframe of 350-400 business hours for production. Starting from the selection of titles through a couple of in-depth brain storming session to the final QC process before uploading our titles on our website we dedicate around 350 working hours. The titles are selected based on their current market cap and the foreseen CAGR and growth.
The 5 steps process:
Step 1: Secondary Research:
Secondary Research or Desk Research is as the name suggests is a research process wherein, we collect data through the readily available information. In this process we use various paid and unpaid databases which our team has access to and gather data through the same. This includes examining of listed companies’ annual reports, Journals, SEC filling etc. Apart from this our team has access to various associations across the globe across different industries. Lastly, we have exchange relationships with various university as well as individual libraries.
Step 2: Primary Research
When we talk about primary research, it is a type of study in which the researchers collect relevant data samples directly, rather than relying on previously collected data. This type of research is focused on gaining content specific facts that can be sued to solve specific problems. Since the collected data is fresh and first hand therefore it makes the study more accurate and genuine.
We at SNS Insider have divided Primary Research into 2 parts.
Part 1 wherein we interview the KOLs of major players as well as the upcoming ones across various geographic regions. This allows us to have their view over the market scenario and acts as an important tool to come closer to the accurate market numbers. As many as 45 paid and unpaid primary interviews are taken from both the demand and supply side of the industry to make sure we land at an accurate judgement and analysis of the market.
This step involves the triangulation of data wherein our team analyses the interview transcripts, online survey responses and observation of on filed participants. The below mentioned chart should give a better understanding of the part 1 of the primary interview.
Part 2: In this part of primary research the data collected via secondary research and the part 1 of the primary research is validated with the interviews from individual consultants and subject matter experts.
Consultants are those set of people who have at least 12 years of experience and expertise within the industry whereas Subject Matter Experts are those with at least 15 years of experience behind their back within the same space. The data with the help of two main processes i.e., FGDs (Focused Group Discussions) and IDs (Individual Discussions). This gives us a 3rd party nonbiased primary view of the market scenario making it a more dependable one while collation of the data pointers.
Step 3: Data Bank Validation
Once all the information is collected via primary and secondary sources, we run that information for data validation. At our intelligence centre our research heads track a lot of information related to the market which includes the quarterly reports, the daily stock prices, and other relevant information. Our data bank server gets updated every fortnight and that is how the information which we collected using our primary and secondary information is revalidated in real time.
Step 4: QA/QC Process
After all the data collection and validation our team does a final level of quality check and quality assurance to get rid of any unwanted or undesired mistakes. This might include but not limited to getting rid of the any typos, duplication of numbers or missing of any important information. The people involved in this process include technical content writers, research heads and graphics people. Once this process is completed the title gets uploader on our platform for our clients to read it.
Step 5: Final QC/QA Process:
This is the last process and comes when the client has ordered the study. In this process a final QA/QC is done before the study is emailed to the client. Since we believe in giving our clients a good experience of our research studies, therefore, to make sure that we do not lack at our end in any way humanly possible we do a final round of quality check and then dispatch the study to the client.
Key Segments:
By Store
Google Store
Apple Store
Others
By Application
Gaming
Music & Entertainment
Health & Fitness
Social Networking
Retail & e-Commerce
Travel & Hospitality
Learning & Education
Others
Request for Segment Customization as per your Business Requirement: Segment Customization Request
Regional Coverage:
North America
US
Canada
Mexico
Europe
Eastern Europe
Poland
Romania
Hungary
Turkey
Rest of Eastern Europe
Western Europe
Germany
France
UK
Italy
Spain
Netherlands
Switzerland
Austria
Rest of Western Europe
Asia Pacific
China
India
Japan
South Korea
Vietnam
Singapore
Australia
Rest of Asia Pacific
Middle East & Africa
Middle East
UAE
Egypt
Saudi Arabia
Qatar
Rest of Middle East
Africa
Nigeria
South Africa
Rest of Africa
Latin America
Brazil
Argentina
Colombia
Rest of Latin America
Request for Country Level Research Report: Country Level Customization Request
Available Customization
With the given market data, SNS Insider offers customization as per the company’s specific needs. The following customization options are available for the report:
Detailed Volume Analysis
Criss-Cross segment analysis (e.g. Product X Application)
Competitive Product Benchmarking
Geographic Analysis
Additional countries in any of the regions
Customized Data Representation
Detailed analysis and profiling of additional market players
The Integration Platform as a Service Market Size was USD 10.1 Billion in 2023 & will reach USD 106.60 Bn by 2032 & grow at a CAGR of 29.93 % by 2024-2032.
The 5G Satellite Communication Market Size was USD 4.1 Billion in 2023 and will reach to USD 28.6 Billion by 2032, growing at a CAGR of 24.1% by 2024-2032.
The Metaverse in Education Market was valued at USD 4.6 Billion in 2023 and will reach USD 85.6 Billion by 2032 and grow at a CAGR of 38.31% by 2032.
The Virtual Classroom Market size was USD 16.09 billion in 2023 and is expected to grow to USD 63.35 Bn by 2032 and grow at a CAGR of 16.45% by 2024-2032.
The Commerce Cloud Market was valued at USD 21.0 Billion in 2023 and is expected to reach USD 138.3 Billion by 2032, growing at a CAGR of 23.35% from 2024-2032.
Data Center Automation Market Size was at USD 9.2 Billion in 2023. It is expected to hit USD 33.42 Billion by 2032 and grow at a CAGR of 15.41% by 2024-2032.
Hi! Click one of our member below to chat on Phone