Get More Information on Minivans Market -Request Sample Report
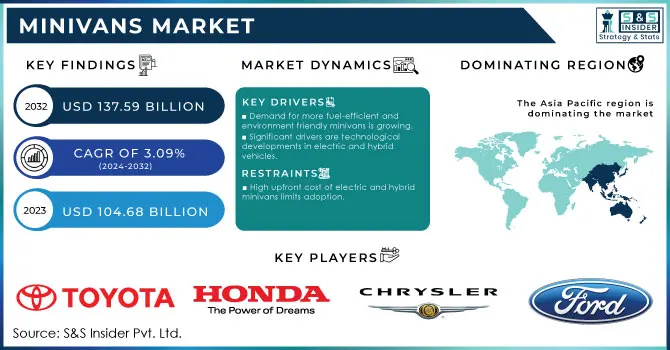
The Minivans Market Size was valued at USD 104.68 Billion in 2023 and is expected to reach USD 137.59 Billion by 2032 and grow at a CAGR of 3.09% over the forecast period 2024-2032.
The minivan market is experiencing a resurgence, driven by evolving consumer preferences and technological advancements. Families and businesses are increasingly drawn to minivans for their versatility, spaciousness, and ability to accommodate both passengers and cargo. As governments worldwide prioritize sustainable transportation, electric and hybrid minivans are gaining significant traction. These eco-friendly vehicles offer reduced emissions and lower operating costs, making them attractive choices for environmentally conscious consumers.
Moreover, technological innovations are transforming the minivan experience. Advanced safety features, cutting-edge infotainment systems, and autonomous driving technologies are enhancing comfort, convenience, and safety. Emerging markets with growing middle classes and urbanization are further fueling the demand for minivans, as they provide practical and affordable transportation solutions for growing families. As the automotive industry continues to innovate and adapt to changing consumer needs, the minivan market is poised for sustained growth and development in the years to come.
For Instance, Self-driving company May Mobility is now celebrating a new deployment of its autonomous vehicles (AVs) in Georgia. The company's Toyota Sienna Autono-MaaS minivans have rolled out at Peachtree Corners smart city development. The AVs are running in partnership with T-Mobile, providing the 5G connectivity, and the Curiosity Lab from the smart city, dedicated space for testing and assessing mobility solutions.
Key Drivers:
Demand for more fuel-efficient and environment friendly minivans is growing.
Environmentally savvy consumers, primarily in North America and Europe, are increasingly desirous of cleaner rather than traditional internal combustion engines. Thus, government policies supporting incentives for electric and hybrid vehicles propel the new trend.
For example, the U.S. government announced a federal tax credit of USD 7,500 for electric vehicles (EVs), in pursuit of its emission-cutting strategy. And Under its Mobility Orientation Law, France has a number of incentives. Among them is the Bonus-Malus System where electric minivans are rewarded with a bonus of up to 6,000 Euro. The Crit'Air program prohibits high emission vehicles from city centers; doing this indirectly encourages the sale of electric and hybrid minivans, even more especially in cities.
One of the main reasons for the attractiveness of fuel-efficient minivans lies in the peculiarly high price of gasoline in certain regions. Hybrid and electric minivans are gaining ground not only because of their reduced fuel consumption but also on grounds of maintenance costs, with less wear and tear likely to increase consumer preference for greener models. As the infrastructure of charging stations, etc., expands, this is likely to pick up in the near future.
Significant drivers are technological developments in electric and hybrid vehicles.
The modern electric minivans come with significantly improved battery life, fast charging, and far more efficient powertrains, and hence truly make minivans a better option than the conventional set of vehicles. Hybrid minivans combine electric motors with traditional internal combustion engines to maintain performance while providing much better fuel economy.
Advanced safety and entertainment technologies, including driver-assistance systems, connected-car features, and infotainment options, also are being incorporated by automakers to make minivans of interest to both family users and commercial stakeholders. These advancements ensure that electric and hybrid minivans are competitive offerings in a wider automotive market space that cannot be confined to niche status.
Restraints
High upfront cost of electric and hybrid minivans limits adoption.
Electric and hybrid minivans, compared to gasoline or diesel-powered counterparts, will reduce a lot of fuel consumption and maintenance costs in the long run; however, at a high cost and much higher than regular vehicles. This cost gap is mainly contributed by the expensive parts of electric and hybrid powertrains, including the lithium-ion battery.
As such, for most customers, mostly in emerging markets, the higher upfront cost offsets the long-term saving to nullify adoption. Commercial consumers who would boast large fleets may not invest in the pricey electric vehicles because they may take years without reaping the return on investment. Although government incentives and subsidies dominate many regions to counterbalance these costs, still higher prices put up a massive deterrent, primarily in price-sensitive markets.
By Fuel Type
Diesel minivans are popular for more efficiency in fuel consumption and high torque, so they are great for mileage traveling or just commercial use with long-distance trucking. Diesel comprised 88% of the market share in 2023. The diesel-powered minivans are dominantly utilized in Europe and some parts of Asia, but due to the aspects of environmental concerns and ever-tightening policies to regulate emission, the demand for diesel is slowly decreasing.
Electric minivans is expected with fastest CAGR of 12.32% during 2024 through 2032. Drivers impacting this business segment would be the need for government incentives and increasing awareness among consumers of the growing need for environmental sustainability, increasing demand for electric vehicles. To meet this increasing demand, the automotive industry is launching more electric models. This will further accelerate the electric minivan market. Despite this, the petrol minivans will continue to hold considerable market shares as consumers gradually shift towards these greener alternatives.
By Application
The Passenger Vehicle segment accounted for the highest market share of 74% in the global market in 2023. This is essentially because minivans are widely used by families due to ample space inside, comfort, and safety features. Minivans are the first choice for large families, recreational travelers, and cargo space demanders, thus enhancing their market share significantly.
The rate would be in the Commercial Vehicle segment will experience fastest growth over the forecast period, driven mainly by increasing demand for minivans for shuttle services, rental fleets, and corporate transport as the minivan offers versatility ideal for commercial application which would be critical in urban areas where maneuverability and fuel efficiency are pivotal. The commercial fleet of electric and hybrid minivans is expected to further fuel the growth in this segment due to increased acceptance and popularity of electric and hybrid vehicles by most of the fleet owners.
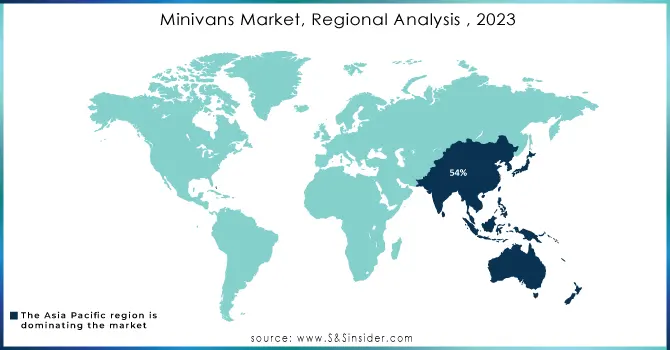
Asia Pacific gained the majority market share of 54% in the global market for minivans in 2023. This is because of huge demand areas in countries such as China and Japan, where minivans are highly in demand for both personal and business purposes. China has continuously seen more frequent usage of minivans for family purposes because of its ever-advancing middle-class and increased levels of urbanization. The same has been observed for Japan as well.
The region that is anticipated to show the highest growth in the forecast period is North America, with a CAGR of 5.27% from 2024 to 2032. A major reason for the growth is the rising interest in electric and hybrid minivans in the USA. There have been many incentives offered for EV purchases, and these have aroused the interest of buyers specifically targeting an eco-friendly mode of transport. Strong charging infrastructure and the desire for roomy, comfortable vehicles make North America a lucrative market for minivans.
Need Any Customization Research On Minivans Market - Inquiry Now
Some of the major players in the Minivans Market are
Toyota (Sienna, Proace)
Honda (Odyssey, Stepwgn)
Chrysler (Pacifica, Voyager)
Kia (Carnival, Sedona)
Ford (Transit Connect, Galaxy)
Mercedes-Benz (V-Class, EQV)
Volkswagen (Caddy, Multivan)
Renault (Espace, Kangoo)
Nissan (Serena, NV350)
Peugeot (Traveller, Expert)
Hyundai (Staria, H-1)
Citroen (Spacetourer, Berlingo)
Opel (Zafira Life, Vivaro)
Fiat (Ducato, Scudo)
Suzuki (Every, Solio)
Mazda (Biante, Premacy)
Mitsubishi (Delica, RVR)
Subaru (Exiga, Levorg)
GMC (Savana, Safari)
Chevrolet (Express, Uplander)
September 2024: Kia's do-it-all Carnival MPV, arriving this month with the usual range of cosmetic and technology enhancements, also debuts a new turbo hybrid motor. Hybrid version, the added Carnival Hybrid has a 1.6-litre turbo-hybrid engine and a 54 kW motor and a six-speed automatic transmission the only tranny offered for front-wheel drive. The combined output runs at 242 horsepower, 271 lb.-ft. of torque.
October 2024: Honda Motor Co., Ltd. announced that it will begin sales of a new commercial-use mini-EV, the N-VAN e in Japan. The new model will be developed by adding features unique to EVs, such as user-friendliness, to the popular gasoline-powered N-VAN model, which has received great attention as a car accommodating diversified needs for both commercial and recreational use.
Report Attributes | Details |
---|---|
Market Size in 2023 | US$ 104.68 Billion |
Market Size by 2032 | US$ 137.59 Billion |
CAGR | CAGR of 3.09 % From 2024 to 2032 |
Base Year | 2023 |
Forecast Period | 2024-2032 |
Historical Data | 2020-2022 |
Report Scope & Coverage | Market Size, Segments Analysis, Competitive Landscape, Regional Analysis, DROC & SWOT Analysis, Forecast Outlook |
Key Segments | • By Product Type(Plug-In Minivan, Hybrid Minivan, Mini MPV, Compact MPV, Large MPV) • By Fuel Type (Diesel, Petrol, Electric, Other) • By Application (Commercial Vehicle, Passenger Vehicle) |
Regional Analysis/Coverage | North America (US, Canada, Mexico), Europe (Eastern Europe [Poland, Romania, Hungary, Turkey, Rest of Eastern Europe] Western Europe [Germany, France, UK, Italy, Spain, Netherlands, Switzerland, Austria, Rest of Western Europe]), Asia Pacific (China, India, Japan, South Korea, Vietnam, Singapore, Australia, Rest of Asia Pacific), Middle East & Africa (Middle East [UAE, Egypt, Saudi Arabia, Qatar, Rest of Middle East], Africa [Nigeria, South Africa, Rest of Africa], Latin America (Brazil, Argentina, Colombia, Rest of Latin America) |
Company Profiles | Toyota, Honda, Chrysler, Kia, Ford, Mercedes-Benz, Volkswagen, Renault, Nissan, Peugeot, Hyundai, Citroen, Opel, Fiat, Suzuki, Mazda, Mitsubishi, Subaru, GMC, Chevrolet. |
Key Drivers | • Demand for more fuel-efficient and environment friendly minivans is growing. • Significant drivers are technological developments in electric and hybrid vehicles. |
Restraints | • High upfront cost of electric and hybrid minivans limits adoption. |
Ans: The Minivans Market is expected to grow at a CAGR of 3.09% during 2024-2032.
Ans: Minivans Market size was USD 104.68 Billion in 2023 and is expected to Reach USD 137.59 Billion by 2032.
Ans: The major growth factors of the Minivans Market are Demand for fuel-efficient and environment friendly minivans as well as technological developments in electric and hybrid vehicles.
Ans: The Diesel segment dominated the Minivans Market.
Ans: Asia Pacific dominated the Minivans Market in 2023.
Table of Content
1. Introduction
1.1 Market Definition
1.2 Scope (Inclusion and Exclusions)
1.3 Research Assumptions
2. Executive Summary
2.1 Market Overview
2.2 Regional Synopsis
2.3 Competitive Summary
3. Research Methodology
3.1 Top-Down Approach
3.2 Bottom-up Approach
3.3. Data Validation
3.4 Primary Interviews
4. Market Dynamics Impact Analysis
4.1 Market Driving Factors Analysis
4.1.1 Drivers
4.1.2 Restraints
4.1.3 Opportunities
4.1.4 Challenges
4.2 PESTLE Analysis
4.3 Porter’s Five Forces Model
5. Statistical Insights and Trends Reporting
5.1 Vehicle Production and Sales Volumes, 2020-2032, by Region
5.2 Emission Standards Compliance, by Region
5.3 Vehicle Technology Adoption, by Region
5.4 Consumer Preferences, by Region
5.5 Aftermarket Trends (Data on vehicle maintenance, parts, and services)
6. Competitive Landscape
6.1 List of Major Companies, By Region
6.2 Market Share Analysis, By Region
6.3 Product Benchmarking
6.3.1 Product specifications and features
6.3.2 Pricing
6.4 Strategic Initiatives
6.4.1 Marketing and promotional activities
6.4.2 Distribution and Supply Chain Strategies
6.4.3 Expansion plans and new product launches
6.4.4 Strategic partnerships and collaborations
6.5 Technological Advancements
6.6 Market Positioning and Branding
7. Minivans Market Segmentation, By Product Type
7.1 Chapter Overview
7.2 Plug-In Minivan
7.2.1 Plug-In Minivan Market Trends Analysis (2020-2032)
7.2.2 Plug-In Minivan Market Size Estimates and Forecasts to 2032 (USD Billion)
7.3 Hybrid Minivan
7.3.1 Hybrid Minivan Market Trends Analysis (2020-2032)
7.3.2 Hybrid Minivan Market Size Estimates and Forecasts to 2032 (USD Billion)
7.4 Mini MPV
7.4.1 Mini MPV Market Trends Analysis (2020-2032)
7.4.2 Mini MPV Market Size Estimates and Forecasts to 2032 (USD Billion)
7.4 Compact MPV
7.4.1 Compact MPV Market Trends Analysis (2020-2032)
7.4.2 Compact MPV Market Size Estimates and Forecasts to 2032 (USD Billion)
7.4 Large MPV
7.4.1 Large MPV Market Trends Analysis (2020-2032)
7.4.2 Large MPV Market Size Estimates and Forecasts to 2032 (USD Billion)
8. Minivans Market Segmentation, By Fuel Type
8.1 Chapter Overview
8.2 Diesel
8.2.1 Diesel Market Trends Analysis (2020-2032)
8.2.2 Diesel Market Size Estimates and Forecasts to 2032 (USD Billion)
8.3 Petrol
8.3.1 Petrol Market Trends Analysis (2020-2032)
8.3.2 Petrol Market Size Estimates and Forecasts to 2032 (USD Billion)
8.4 Electric
8.4.1 Electric Market Trends Analysis (2020-2032)
8.4.2 Electric Market Size Estimates and Forecasts to 2032 (USD Billion)
8.5 Others
8.5.1 Others Market Trends Analysis (2020-2032)
8.5.2 Others Market Size Estimates and Forecasts to 2032 (USD Billion)
9. Minivans Market Segmentation, By Application
9.1 Chapter Overview
9.2 Commercial Vehicle
9.2.1 Commercial Vehicle Market Trends Analysis (2020-2032)
9.2.2 Commercial Vehicle Market Size Estimates and Forecasts to 2032 (USD Billion)
9.3 Passenger Vehicle
9.3.1 Passenger Vehicle Market Trends Analysis (2020-2032)
9.3.2 Passenger Vehicle Market Size Estimates and Forecasts to 2032 (USD Billion)
10. Regional Analysis
10.1 Chapter Overview
10.2 North America
10.2.1 Trends Analysis
10.2.2 North America Minivans Market Estimates and Forecasts, by Country (2020-2032) (USD Billion)
10.2.3 North America Minivans Market Estimates and Forecasts, By Application (2020-2032) (USD Billion)
10.2.4 North America Minivans Market Estimates and Forecasts, By Product Type (2020-2032) (USD Billion)
10.2.5 North America Minivans Market Estimates and Forecasts, By Fuel Type (2020-2032) (USD Billion)
10.2.6 USA
10.2.6.1 USA Minivans Market Estimates and Forecasts, By Application (2020-2032) (USD Billion)
10.2.6.2 USA Minivans Market Estimates and Forecasts, By Product Type (2020-2032) (USD Billion)
10.2.6.3 USA Minivans Market Estimates and Forecasts, By Fuel Type (2020-2032) (USD Billion)
10.2.7 Canada
10.2.7.1 Canada Minivans Market Estimates and Forecasts, By Application (2020-2032) (USD Billion)
10.2.7.2 Canada Minivans Market Estimates and Forecasts, By Product Type (2020-2032) (USD Billion)
10.2.7.3 Canada Minivans Market Estimates and Forecasts, By Fuel Type (2020-2032) (USD Billion)
10.2.8 Mexico
10.2.8.1 Mexico Minivans Market Estimates and Forecasts, By Application (2020-2032) (USD Billion)
10.2.8.2 Mexico Minivans Market Estimates and Forecasts, By Product Type (2020-2032) (USD Billion)
10.2.8.3 Mexico Minivans Market Estimates and Forecasts, By Fuel Type (2020-2032) (USD Billion)
10.3 Europe
10.3.1 Eastern Europe
10.3.1.1 Trends Analysis
10.3.1.2 Eastern Europe Minivans Market Estimates and Forecasts, by Country (2020-2032) (USD Billion)
10.3.1.3 Eastern Europe Minivans Market Estimates and Forecasts, By Application (2020-2032) (USD Billion)
10.3.1.4 Eastern Europe Minivans Market Estimates and Forecasts, By Product Type (2020-2032) (USD Billion)
10.3.1.5 Eastern Europe Minivans Market Estimates and Forecasts, By Fuel Type (2020-2032) (USD Billion)
10.3.1.6 Poland
10.3.1.6.1 Poland Minivans Market Estimates and Forecasts, By Application (2020-2032) (USD Billion)
10.3.1.6.2 Poland Minivans Market Estimates and Forecasts, By Product Type (2020-2032) (USD Billion)
10.3.1.6.3 Poland Minivans Market Estimates and Forecasts, By Fuel Type (2020-2032) (USD Billion)
10.3.1.7 Romania
10.3.1.7.1 Romania Minivans Market Estimates and Forecasts, By Application (2020-2032) (USD Billion)
10.3.1.7.2 Romania Minivans Market Estimates and Forecasts, By Product Type (2020-2032) (USD Billion)
10.3.1.7.3 Romania Minivans Market Estimates and Forecasts, By Fuel Type (2020-2032) (USD Billion)
10.3.1.8 Hungary
10.3.1.8.1 Hungary Minivans Market Estimates and Forecasts, By Application (2020-2032) (USD Billion)
10.3.1.8.2 Hungary Minivans Market Estimates and Forecasts, By Product Type (2020-2032) (USD Billion)
10.3.1.8.3 Hungary Minivans Market Estimates and Forecasts, By Fuel Type (2020-2032) (USD Billion)
10.3.1.9 Turkey
10.3.1.9.1 Turkey Minivans Market Estimates and Forecasts, By Application (2020-2032) (USD Billion)
10.3.1.9.2 Turkey Minivans Market Estimates and Forecasts, By Product Type (2020-2032) (USD Billion)
10.3.1.9.3 Turkey Minivans Market Estimates and Forecasts, By Fuel Type (2020-2032) (USD Billion)
10.3.1.10 Rest of Eastern Europe
10.3.1.10.1 Rest of Eastern Europe Minivans Market Estimates and Forecasts, By Application (2020-2032) (USD Billion)
10.3.1.10.2 Rest of Eastern Europe Minivans Market Estimates and Forecasts, By Product Type (2020-2032) (USD Billion)
10.3.1.10.3 Rest of Eastern Europe Minivans Market Estimates and Forecasts, By Fuel Type (2020-2032) (USD Billion)
10.3.2 Western Europe
10.3.2.1 Trends Analysis
10.3.2.2 Western Europe Minivans Market Estimates and Forecasts, by Country (2020-2032) (USD Billion)
10.3.2.3 Western Europe Minivans Market Estimates and Forecasts, By Application (2020-2032) (USD Billion)
10.3.2.4 Western Europe Minivans Market Estimates and Forecasts, By Product Type (2020-2032) (USD Billion)
10.3.2.5 Western Europe Minivans Market Estimates and Forecasts, By Fuel Type (2020-2032) (USD Billion)
10.3.2.6 Germany
10.3.2.6.1 Germany Minivans Market Estimates and Forecasts, By Application (2020-2032) (USD Billion)
10.3.2.6.2 Germany Minivans Market Estimates and Forecasts, By Product Type (2020-2032) (USD Billion)
10.3.2.6.3 Germany Minivans Market Estimates and Forecasts, By Fuel Type (2020-2032) (USD Billion)
10.3.2.7 France
10.3.2.7.1 France Minivans Market Estimates and Forecasts, By Application (2020-2032) (USD Billion)
10.3.2.7.2 France Minivans Market Estimates and Forecasts, By Product Type (2020-2032) (USD Billion)
10.3.2.7.3 France Minivans Market Estimates and Forecasts, By Fuel Type (2020-2032) (USD Billion)
10.3.2.8 UK
10.3.2.8.1 UK Minivans Market Estimates and Forecasts, By Application (2020-2032) (USD Billion)
10.3.2.8.2 UK Minivans Market Estimates and Forecasts, By Product Type (2020-2032) (USD Billion)
10.3.2.8.3 UK Minivans Market Estimates and Forecasts, By Fuel Type (2020-2032) (USD Billion)
10.3.2.9 Italy
10.3.2.9.1 Italy Minivans Market Estimates and Forecasts, By Application (2020-2032) (USD Billion)
10.3.2.9.2 Italy Minivans Market Estimates and Forecasts, By Product Type (2020-2032) (USD Billion)
10.3.2.9.3 Italy Minivans Market Estimates and Forecasts, By Fuel Type (2020-2032) (USD Billion)
10.3.2.10 Spain
10.3.2.10.1 Spain Minivans Market Estimates and Forecasts, By Application (2020-2032) (USD Billion)
10.3.2.10.2 Spain Minivans Market Estimates and Forecasts, By Product Type (2020-2032) (USD Billion)
10.3.2.10.3 Spain Minivans Market Estimates and Forecasts, By Fuel Type (2020-2032) (USD Billion)
10.3.2.11 Netherlands
10.3.2.11.1 Netherlands Minivans Market Estimates and Forecasts, By Application (2020-2032) (USD Billion)
10.3.2.11.2 Netherlands Minivans Market Estimates and Forecasts, By Product Type (2020-2032) (USD Billion)
10.3.2.11.3 Netherlands Minivans Market Estimates and Forecasts, By Fuel Type (2020-2032) (USD Billion)
10.3.2.12 Switzerland
10.3.2.12.1 Switzerland Minivans Market Estimates and Forecasts, By Application (2020-2032) (USD Billion)
10.3.2.12.2 Switzerland Minivans Market Estimates and Forecasts, By Product Type (2020-2032) (USD Billion)
10.3.2.12.3 Switzerland Minivans Market Estimates and Forecasts, By Fuel Type (2020-2032) (USD Billion)
10.3.2.13 Austria
10.3.2.13.1 Austria Minivans Market Estimates and Forecasts, By Application (2020-2032) (USD Billion)
10.3.2.13.2 Austria Minivans Market Estimates and Forecasts, By Product Type (2020-2032) (USD Billion)
10.3.2.13.3 Austria Minivans Market Estimates and Forecasts, By Fuel Type (2020-2032) (USD Billion)
10.3.2.14 Rest of Western Europe
10.3.2.14.1 Rest of Western Europe Minivans Market Estimates and Forecasts, By Application (2020-2032) (USD Billion)
10.3.2.14.2 Rest of Western Europe Minivans Market Estimates and Forecasts, By Product Type (2020-2032) (USD Billion)
10.3.2.14.3 Rest of Western Europe Minivans Market Estimates and Forecasts, By Fuel Type (2020-2032) (USD Billion)
10.4 Asia Pacific
10.4.1 Trends Analysis
10.4.2 Asia Pacific Minivans Market Estimates and Forecasts, by Country (2020-2032) (USD Billion)
10.4.3 Asia Pacific Minivans Market Estimates and Forecasts, By Application (2020-2032) (USD Billion)
10.4.4 Asia Pacific Minivans Market Estimates and Forecasts, By Product Type (2020-2032) (USD Billion)
10.4.5 Asia Pacific Minivans Market Estimates and Forecasts, By Fuel Type (2020-2032) (USD Billion)
10.4.6 China
10.4.6.1 China Minivans Market Estimates and Forecasts, By Application (2020-2032) (USD Billion)
10.4.6.2 China Minivans Market Estimates and Forecasts, By Product Type (2020-2032) (USD Billion)
10.4.6.3 China Minivans Market Estimates and Forecasts, By Fuel Type (2020-2032) (USD Billion)
10.4.7 India
10.4.7.1 India Minivans Market Estimates and Forecasts, By Application (2020-2032) (USD Billion)
10.4.7.2 India Minivans Market Estimates and Forecasts, By Product Type (2020-2032) (USD Billion)
10.4.7.3 India Minivans Market Estimates and Forecasts, By Fuel Type (2020-2032) (USD Billion)
10.4.8 Japan
10.4.8.1 Japan Minivans Market Estimates and Forecasts, By Application (2020-2032) (USD Billion)
10.4.8.2 Japan Minivans Market Estimates and Forecasts, By Product Type (2020-2032) (USD Billion)
10.4.8.3 Japan Minivans Market Estimates and Forecasts, By Fuel Type (2020-2032) (USD Billion)
10.4.9 South Korea
10.4.9.1 South Korea Minivans Market Estimates and Forecasts, By Application (2020-2032) (USD Billion)
10.4.9.2 South Korea Minivans Market Estimates and Forecasts, By Product Type (2020-2032) (USD Billion)
10.4.9.3 South Korea Minivans Market Estimates and Forecasts, By Fuel Type (2020-2032) (USD Billion)
10.4.10 Vietnam
10.4.10.1 Vietnam Minivans Market Estimates and Forecasts, By Application (2020-2032) (USD Billion)
10.4.10.2 Vietnam Minivans Market Estimates and Forecasts, By Product Type (2020-2032) (USD Billion)
10.4.10.3 Vietnam Minivans Market Estimates and Forecasts, By Fuel Type (2020-2032) (USD Billion)
10.4.11 Singapore
10.4.11.1 Singapore Minivans Market Estimates and Forecasts, By Application (2020-2032) (USD Billion)
10.4.11.2 Singapore Minivans Market Estimates and Forecasts, By Product Type (2020-2032) (USD Billion)
10.4.11.3 Singapore Minivans Market Estimates and Forecasts, By Fuel Type (2020-2032) (USD Billion)
10.4.12 Australia
10.4.12.1 Australia Minivans Market Estimates and Forecasts, By Application (2020-2032) (USD Billion)
10.4.12.2 Australia Minivans Market Estimates and Forecasts, By Product Type (2020-2032) (USD Billion)
10.4.12.3 Australia Minivans Market Estimates and Forecasts, By Fuel Type (2020-2032) (USD Billion)
10.4.13 Rest of Asia Pacific
10.4.13.1 Rest of Asia Pacific Minivans Market Estimates and Forecasts, By Application (2020-2032) (USD Billion)
10.4.13.2 Rest of Asia Pacific Minivans Market Estimates and Forecasts, By Product Type (2020-2032) (USD Billion)
10.4.13.3 Rest of Asia Pacific Minivans Market Estimates and Forecasts, By Fuel Type (2020-2032) (USD Billion)
10.5 Middle East and Africa
10.5.1 Middle East
10.5.1.1 Trends Analysis
10.5.1.2 Middle East Minivans Market Estimates and Forecasts, by Country (2020-2032) (USD Billion)
10.5.1.3 Middle East Minivans Market Estimates and Forecasts, By Application (2020-2032) (USD Billion)
10.5.1.4 Middle East Minivans Market Estimates and Forecasts, By Product Type (2020-2032) (USD Billion)
10.5.1.5 Middle East Minivans Market Estimates and Forecasts, By Fuel Type (2020-2032) (USD Billion)
10.5.1.6 UAE
10.5.1.6.1 UAE Minivans Market Estimates and Forecasts, By Application (2020-2032) (USD Billion)
10.5.1.6.2 UAE Minivans Market Estimates and Forecasts, By Product Type (2020-2032) (USD Billion)
10.5.1.6.3 UAE Minivans Market Estimates and Forecasts, By Fuel Type (2020-2032) (USD Billion)
10.5.1.7 Egypt
10.5.1.7.1 Egypt Minivans Market Estimates and Forecasts, By Application (2020-2032) (USD Billion)
10.5.1.7.2 Egypt Minivans Market Estimates and Forecasts, By Product Type (2020-2032) (USD Billion)
10.5.1.7.3 Egypt Minivans Market Estimates and Forecasts, By Fuel Type (2020-2032) (USD Billion)
10.5.1.8 Saudi Arabia
10.5.1.8.1 Saudi Arabia Minivans Market Estimates and Forecasts, By Application (2020-2032) (USD Billion)
10.5.1.8.2 Saudi Arabia Minivans Market Estimates and Forecasts, By Product Type (2020-2032) (USD Billion)
10.5.1.8.3 Saudi Arabia Minivans Market Estimates and Forecasts, By Fuel Type (2020-2032) (USD Billion)
10.5.1.9 Qatar
10.5.1.9.1 Qatar Minivans Market Estimates and Forecasts, By Application (2020-2032) (USD Billion)
10.5.1.9.2 Qatar Minivans Market Estimates and Forecasts, By Product Type (2020-2032) (USD Billion)
10.5.1.9.3 Qatar Minivans Market Estimates and Forecasts, By Fuel Type (2020-2032) (USD Billion)
10.5.1.10 Rest of Middle East
10.5.1.10.1 Rest of Middle East Minivans Market Estimates and Forecasts, By Application (2020-2032) (USD Billion)
10.5.1.10.2 Rest of Middle East Minivans Market Estimates and Forecasts, By Product Type (2020-2032) (USD Billion)
10.5.1.10.3 Rest of Middle East Minivans Market Estimates and Forecasts, By Fuel Type (2020-2032) (USD Billion)
10.5.2 Africa
10.5.2.1 Trends Analysis
10.5.2.2 Africa Minivans Market Estimates and Forecasts, by Country (2020-2032) (USD Billion)
10.5.2.3 Africa Minivans Market Estimates and Forecasts, By Application (2020-2032) (USD Billion)
10.5.2.4 Africa Minivans Market Estimates and Forecasts, By Product Type (2020-2032) (USD Billion)
10.5.2.5 Africa Minivans Market Estimates and Forecasts, By Fuel Type (2020-2032) (USD Billion)
10.5.2.6 South Africa
10.5.2.6.1 South Africa Minivans Market Estimates and Forecasts, By Application (2020-2032) (USD Billion)
10.5.2.6.2 South Africa Minivans Market Estimates and Forecasts, By Product Type (2020-2032) (USD Billion)
10.5.2.6.3 South Africa Minivans Market Estimates and Forecasts, By Fuel Type (2020-2032) (USD Billion)
10.5.2.7 Nigeria
10.5.2.7.1 Nigeria Minivans Market Estimates and Forecasts, By Application (2020-2032) (USD Billion)
10.5.2.7.2 Nigeria Minivans Market Estimates and Forecasts, By Product Type (2020-2032) (USD Billion)
10.5.2.7.3 Nigeria Minivans Market Estimates and Forecasts, By Fuel Type (2020-2032) (USD Billion)
10.5.2.8 Rest of Africa
10.5.2.8.1 Rest of Africa Minivans Market Estimates and Forecasts, By Application (2020-2032) (USD Billion)
10.5.2.8.2 Rest of Africa Minivans Market Estimates and Forecasts, By Product Type (2020-2032) (USD Billion)
10.5.2.8.3 Rest of Africa Minivans Market Estimates and Forecasts, By Fuel Type (2020-2032) (USD Billion)
10.6 Latin America
10.6.1 Trends Analysis
10.6.2 Latin America Minivans Market Estimates and Forecasts, by Country (2020-2032) (USD Billion)
10.6.3 Latin America Minivans Market Estimates and Forecasts, By Application (2020-2032) (USD Billion)
10.6.4 Latin America Minivans Market Estimates and Forecasts, By Product Type (2020-2032) (USD Billion)
10.6.5 Latin America Minivans Market Estimates and Forecasts, By Fuel Type (2020-2032) (USD Billion)
10.6.6 Brazil
10.6.6.1 Brazil Minivans Market Estimates and Forecasts, By Application (2020-2032) (USD Billion)
10.6.6.2 Brazil Minivans Market Estimates and Forecasts, By Product Type (2020-2032) (USD Billion)
10.6.6.3 Brazil Minivans Market Estimates and Forecasts, By Fuel Type (2020-2032) (USD Billion)
10.6.7 Argentina
10.6.7.1 Argentina Minivans Market Estimates and Forecasts, By Application (2020-2032) (USD Billion)
10.6.7.2 Argentina Minivans Market Estimates and Forecasts, By Product Type (2020-2032) (USD Billion)
10.6.7.3 Argentina Minivans Market Estimates and Forecasts, By Fuel Type (2020-2032) (USD Billion)
10.6.8 Colombia
10.6.8.1 Colombia Minivans Market Estimates and Forecasts, By Application (2020-2032) (USD Billion)
10.6.8.2 Colombia Minivans Market Estimates and Forecasts, By Product Type (2020-2032) (USD Billion)
10.6.8.3 Colombia Minivans Market Estimates and Forecasts, By Fuel Type (2020-2032) (USD Billion)
10.6.9 Rest of Latin America
10.6.9.1 Rest of Latin America Minivans Market Estimates and Forecasts, By Application (2020-2032) (USD Billion)
10.6.9.2 Rest of Latin America Minivans Market Estimates and Forecasts, By Product Type (2020-2032) (USD Billion)
10.6.9.3 Rest of Latin America Minivans Market Estimates and Forecasts, By Fuel Type (2020-2032) (USD Billion)
11. Company Profiles
11.1 Toyota
11.1.1 Company Overview
11.1.2 Financial
11.1.3 Products/ Services Offered
11.1.4 SWOT Analysis
11.2 Honda
11.2.1 Company Overview
11.2.2 Financial
11.2.3 Products/ Services Offered
11.2.4 SWOT Analysis
11.3 Chrysler
11.3.1 Company Overview
11.3.2 Financial
11.3.3 Products/ Services Offered
11.3.4 SWOT Analysis
11.4 Kia
11.4.1 Company Overview
11.4.2 Financial
11.4.3 Products/ Services Offered
11.4.4 SWOT Analysis
11.5 Ford
11.5.1 Company Overview
11.5.2 Financial
11.5.3 Products/ Services Offered
11.5.4 SWOT Analysis
11.6 Mercedes-Benz
11.6.1 Company Overview
11.6.2 Financial
11.6.3 Products/ Services Offered
11.6.4 SWOT Analysis
11.7 Volkswagen
11.7.1 Company Overview
11.7.2 Financial
11.7.3 Products/ Services Offered
11.7.4 SWOT Analysis
11.8 Renault
11.8.1 Company Overview
11.8.2 Financial
11.8.3 Products/ Services Offered
11.8.4 SWOT Analysis
11.9 Nissan
11.9.1 Company Overview
11.9.2 Financial
11.9.3 Products/ Services Offered
11.9.4 SWOT Analysis
11.10 Peugeot
11.10.1 Company Overview
11.10.2 Financial
11.10.3 Products/ Services Offered
11.10.4 SWOT Analysis
12. Use Cases and Best Practices
13. Conclusion
An accurate research report requires proper strategizing as well as implementation. There are multiple factors involved in the completion of good and accurate research report and selecting the best methodology to compete the research is the toughest part. Since the research reports we provide play a crucial role in any company’s decision-making process, therefore we at SNS Insider always believe that we should choose the best method which gives us results closer to reality. This allows us to reach at a stage wherein we can provide our clients best and accurate investment to output ratio.
Each report that we prepare takes a timeframe of 350-400 business hours for production. Starting from the selection of titles through a couple of in-depth brain storming session to the final QC process before uploading our titles on our website we dedicate around 350 working hours. The titles are selected based on their current market cap and the foreseen CAGR and growth.
The 5 steps process:
Step 1: Secondary Research:
Secondary Research or Desk Research is as the name suggests is a research process wherein, we collect data through the readily available information. In this process we use various paid and unpaid databases which our team has access to and gather data through the same. This includes examining of listed companies’ annual reports, Journals, SEC filling etc. Apart from this our team has access to various associations across the globe across different industries. Lastly, we have exchange relationships with various university as well as individual libraries.
Step 2: Primary Research
When we talk about primary research, it is a type of study in which the researchers collect relevant data samples directly, rather than relying on previously collected data. This type of research is focused on gaining content specific facts that can be sued to solve specific problems. Since the collected data is fresh and first hand therefore it makes the study more accurate and genuine.
We at SNS Insider have divided Primary Research into 2 parts.
Part 1 wherein we interview the KOLs of major players as well as the upcoming ones across various geographic regions. This allows us to have their view over the market scenario and acts as an important tool to come closer to the accurate market numbers. As many as 45 paid and unpaid primary interviews are taken from both the demand and supply side of the industry to make sure we land at an accurate judgement and analysis of the market.
This step involves the triangulation of data wherein our team analyses the interview transcripts, online survey responses and observation of on filed participants. The below mentioned chart should give a better understanding of the part 1 of the primary interview.
Part 2: In this part of primary research the data collected via secondary research and the part 1 of the primary research is validated with the interviews from individual consultants and subject matter experts.
Consultants are those set of people who have at least 12 years of experience and expertise within the industry whereas Subject Matter Experts are those with at least 15 years of experience behind their back within the same space. The data with the help of two main processes i.e., FGDs (Focused Group Discussions) and IDs (Individual Discussions). This gives us a 3rd party nonbiased primary view of the market scenario making it a more dependable one while collation of the data pointers.
Step 3: Data Bank Validation
Once all the information is collected via primary and secondary sources, we run that information for data validation. At our intelligence centre our research heads track a lot of information related to the market which includes the quarterly reports, the daily stock prices, and other relevant information. Our data bank server gets updated every fortnight and that is how the information which we collected using our primary and secondary information is revalidated in real time.
Step 4: QA/QC Process
After all the data collection and validation our team does a final level of quality check and quality assurance to get rid of any unwanted or undesired mistakes. This might include but not limited to getting rid of the any typos, duplication of numbers or missing of any important information. The people involved in this process include technical content writers, research heads and graphics people. Once this process is completed the title gets uploader on our platform for our clients to read it.
Step 5: Final QC/QA Process:
This is the last process and comes when the client has ordered the study. In this process a final QA/QC is done before the study is emailed to the client. Since we believe in giving our clients a good experience of our research studies, therefore, to make sure that we do not lack at our end in any way humanly possible we do a final round of quality check and then dispatch the study to the client.
By Product Type
Plug-In Minivan
Hybrid Minivan
Mini MPV
Compact MPV
Large MPV
By Fuel Type
Diesel
Petrol
Electric
Other
By Application
Commercial Vehicle
Passenger Vehicle
Request for Segment Customization as per your Business Requirement: Segment Customization Request
Regional Coverage:
North America
US
Canada
Mexico
Europe
Eastern Europe
Poland
Romania
Hungary
Turkey
Rest of Eastern Europe
Western Europe
Germany
France
UK
Italy
Spain
Netherlands
Switzerland
Austria
Rest of Western Europe
Asia Pacific
China
India
Japan
South Korea
Vietnam
Singapore
Australia
Rest of Asia Pacific
Middle East & Africa
Middle East
UAE
Egypt
Saudi Arabia
Qatar
Rest of the Middle East
Africa
Nigeria
South Africa
Rest of Africa
Latin America
Brazil
Argentina
Colombia
Rest of Latin America
Request for Country Level Research Report: Country Level Customization Request
Available Customization
With the given market data, SNS Insider offers customization as per the company’s specific needs. The following customization options are available for the report:
Product Analysis
Criss-Cross segment analysis (e.g. Product X Application)
Product Matrix which gives a detailed comparison of product portfolio of each company
Geographic Analysis
Additional countries in any of the regions
Company Information
Detailed analysis and profiling of additional market players (Up to five)
The Freight Trucking Market size was recorded at USD 2670 Billion in 2023 and is expected to reach USD 3768.1 Billion in 2032, growing at a CAGR of 3.9 % over the forecast period of 2024-2032.
The Automotive Night Vision and Pedestrian Detection Technologies Market size was valued at $4.1 Bn in 2023 & will reach $46.3 Bn by 2032, with a CAGR of 30.94% over the forecast period of 2024-2032.
The Car Rental Market Size was valued at USD 130.45 billion in 2023 and will reach USD 311.63 billion by 2031 and grow at a CAGR of 11.5% by 2024-2031
The Automotive Telematics Market size was valued at USD 59 billion in 2023 & will reach USD 233.23 billion by 2032 and grow at a CAGR of 16.5% by 2024-2032
The Automotive Over-The-Air Updates Market Size was valued at USD 4.35 billion in 2023 and is expected to reach USD 19.29 billion by 2032 and grow at a CAGR of 18 % over the forecast period 2024-2032.
Automotive Heat Shield Market Size was valued at USD 12.83 billion in 2023 and is expected to reach USD 17.59 billion by 2031 and grow at a CAGR of 3.78% over the forecast period 2024-2031.
Hi! Click one of our member below to chat on Phone