Military Displays Market Report Scope & Overview:
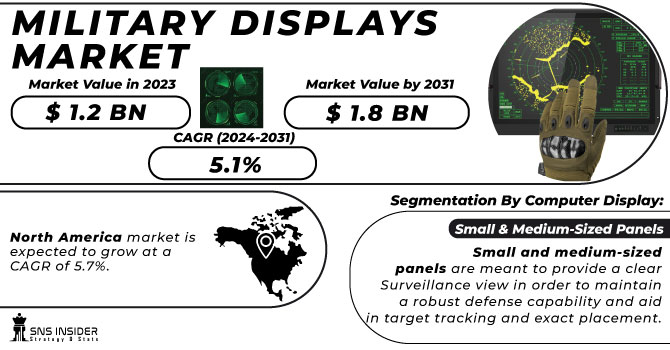
The Military Displays Market Size was valued at USD 1.2 billion in 2023 and is expected to reach USD 1.8 billion by 2031 with a growing CAGR of 5.1% over the forecast period 2024-2031.
Demonstration manufacturers are exploring new system structures to meet strict EMC rules and military specifications in developing security services demonstrations. Opportunities in the military exhibition market have grown as a result of rising investment in new digital video and communications.
To get more information on Military Displays Market - Request Free Sample Report
Advances in standard open systems and the emergence of new industrial electronic technologies enhance market opportunities for military displays. Hardness, lightweight, and poor weather resistance are some of the key product features that military exhibitors are focusing on to meet the needs of end-users in the military display market. Indeed, the adoption of new products and system structures for these displays has improved product capabilities in the military display market. In addition, the emergence of ergonomic designs to meet the needs of exhibitions in military shelters is improving the market. Some of the major application areas are ground control, maritime, and air traffic control stations.
MARKET DYNAMICS
KEY DRIVERS
-
High-profit margin
-
Technology enhancement
-
High investment in R&D
RESTRAINTS
-
Not much Ruggedness
OPPORTUNITIES
-
Easy attachment
-
lightweight
CHALLENGES
-
Support system
-
Long-lasting batteries
THE IMPACT OF COVID-19
Impact of COVID-19 supply chains in all regions. The defense industry saw the production industries shut down and the planning activities closed. The timeline for many major programs was disrupted as the temporary closure of F-35 production facilities in Japan and Italy in March 2020, and in April 2020, U.S. military officials suspended all operations, deployments, and exercises as they tried to control the situation. Although the plans were able to recover, most of the time in months, approximately USD 6 billion in government services and efforts to push for money from suppliers were spent. US industries have spent nearly $ 11 billion reorganizing production lines and building remote operating infrastructure. All the small industries have had a major impact on the epidemic as one in 7 companies is expected to be able to reach pre-epidemic levels. Many key players in the military exhibition market such as Lockheed Martin, Raytheon Technologies, and BAE programs have announced that the business has returned to normal but acknowledged the impact of costs and schedules on many programs.
By Computer Display
The global military displays market is divided into microdisplays, small and medium-sized panels, and large panels based on computer displays.
During the forecast period, the small and medium-sized panels segment is expected to lead the global military displays market in terms of revenue contribution.
Small and medium-sized panels are meant to provide a clear Surveillance view in order to maintain a robust defense capability and aid in target tracking and exact placement. The increased visibility of goals is attributable to the segment's growth.
By End-Use Market
The global military displays market is divided into three segments based on end-use: naval, airborne, and land. Over the projected period, the naval segment is expected to lead in terms of revenue contribution to the market. Military displays are intended to serve as surveillance systems and to aid in the launch of weapons at targets. In an emergency, these serve as situational awareness systems, connecting to the command room or center to enable the deployment of a better warfighting plan. Different display types can be coupled to provide superior video feeds from an external sensor. As a result, military shows help to increase a country's security. The growing use of military displays in maritime applications due to their high efficiency is likely to generate revenue. growth of this segment over the forecast period.
By Technology
The global military displays market is divided into Light Emitting Diode (LED), Liquid Crystal Display (LCD), Active-Matrix Organic Light-Emitting Diode (AMOLED), and Organic Light Emitting Diode (OLED) (OLED). During the forecast period, the LCD segment is likely to lead in terms of revenue contribution to the worldwide military displays market. Military has begun utilizing LCD displays because they are less expensive than other types of displays and can withstand harsh environments.
By Type
The global military displays market is divided into two types: smart displays and conventional displays. Because of rising demand for smart displays, the smart displays segment is expected to lead in terms of revenue contribution during the forecast period. As commands from the control room should be highly visible, smart displays are advantageous due to various benefits such as size and resolution. Because smart displays are designed to function outdoors, they are used in the military due to their lightweight and flexibility. As a result, rising demand for smart displays is expected to boost revenue growth in this segment in the coming years.
KEY MARKET SEGMENTATION
By Computer Display
-
Micro-displays
-
Small & Medium-Sized Panels
-
Large Panels
By Product Type
-
Handheld
-
Wearables
-
Vehicle Mounted
-
Simulators
-
Computer Displays
By End Market
-
Naval
-
Airborne
-
Land.
By Technology
-
LED
-
LCD
-
AMOLED
-
OLED
By Type
-
Conventional Displays
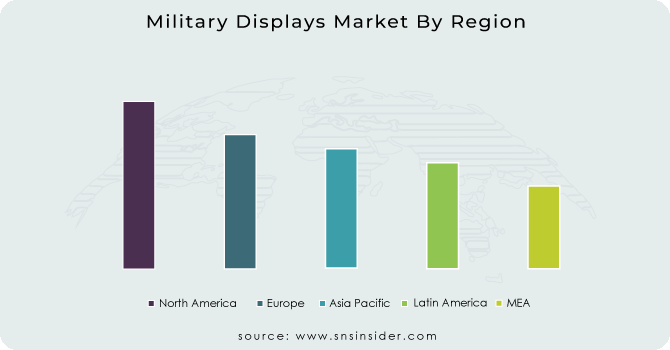
REGIONAL ANALYSIS:
During the forecast period, the North American market is expected to grow at a CAGR of 5.7%. The United States dominates this market, investing heavily in military displays to maintain its combat superiority, as well as displays for monitoring operations, identifying enemies, and a variety of other tactical options. The United States intends to increase its spending on military displays in order to gain a competitive advantage over other countries.
Due to increased investments and the adoption of advanced multifunctional displays in military technologies by countries in this region, this region is expected to lead the market from 2022 to 2028. The presence of prominent military display manufacturers and integrators such as Lockheed Martin, Northrop Grumman, L3Harris Technologies, Inc., and Raytheon Technologies, is also expected to drive the market in the region over the forecast period.
Need any customization research on Military Displays Market - Enquiry Now
REGIONAL COVERAGE:
-
North America
-
USA
-
Canada
-
Mexico
-
-
Europe
-
Germany
-
UK
-
France
-
Italy
-
Spain
-
The Netherlands
-
Rest of Europe
-
-
Asia-Pacific
-
Japan
-
south Korea
-
China
-
India
-
Australia
-
Rest of Asia-Pacific
-
-
The Middle East & Africa
-
Israel
-
UAE
-
South Africa
-
Rest of Middle East & Africa
-
-
Latin America
-
Brazil
-
Argentina
-
Rest of Latin America
-
Key Players
The Major players are Raytheon Technologies, Lockheed Martin Corporation, Elbit Systems, BAE Systems, Thales Group, Curtiss-Wright Corporation, Aselsan A.S., Advanced Embedded Solutions Ltd., L3 Harris Technologies Inc., and Other Players
Raytheon Technologies - Company Financial Analysis

| Report Attributes | Details |
|---|---|
| Market Size in 2023 | US$ 1.2 Billion |
| Market Size by 2031 | US$ 1.8 Billion |
| CAGR | CAGR of 5.1% From 2024 to 2031 |
| Base Year | 2023 |
| Forecast Period | 2024-2031 |
| Historical Data | 2020-2022 |
| Report Scope & Coverage | Market Size, Segments Analysis, Competitive Landscape, Regional Analysis, DROC & SWOT Analysis, Forecast Outlook |
| Key Segments | • By Computer Display (Micro-displays, Small, Medium-Sized Panels, Large Panels) • By Product Type (Handheld, Simulators, Wearables, Vehicle Mounted, Computer Displays) • By End Market (Naval, Land, Airborne) • By Technology (LED, OLED, LCD, AMOLED) • By Type (Smart Displays, Conventional Displays) |
| Regional Analysis/Coverage | North America (USA, Canada, Mexico), Europe (Germany, UK, France, Italy, Spain, Netherlands, Rest of Europe), Asia-Pacific (Japan, South Korea, China, India, Australia, Rest of Asia-Pacific), The Middle East & Africa (Israel, UAE, South Africa, Rest of Middle East & Africa), Latin America (Brazil, Argentina, Rest of Latin America) |
| Company Profiles | Raytheon Technologies, Lockheed Martin Corporation, Elbit Systems, BAE Systems, Thales Group, Curtiss-Wright Corporation, Aselsan A.S., Advanced Embeded Solutions Ltd., L3 Harris Technologies Inc. |
| DRIVERS | • High-profit margin • Technology enhancement • High investment in R&D |
| RESTRAINTS | • Not much Ruggedness |
