image

Microdisplay Market Size & Overview:

Microdisplay Market Revenue Analysis

Get More Information on Microdisplay Market - Request Sample Report

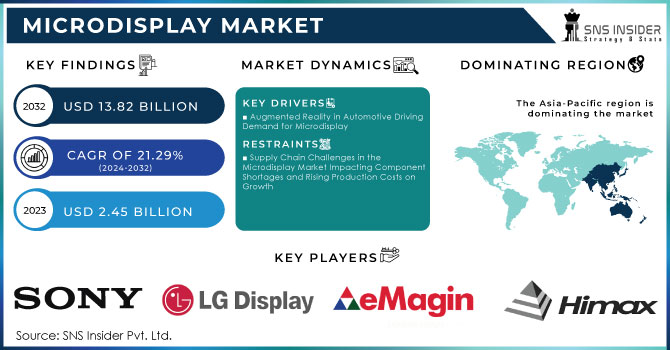
The Microdisplay Market Size was valued at USD 2.45 Billion in 2023 and it is expected to reach USD 13.82 Billion by 2032 with a growing CAGR of 21.29% over the forecast period 2024-2032.

The microdisplay market is experiencing significant growth, driven by the increasing demand for innovative wearable devices that enhance user experiences through technologies like eye-tracking, voice commands, and hand gestures. Key advancements in microdisplay types—such as micro OLEDs, liquid crystal on silicon (LCoS), and microLEDs—are expanding applications in sectors like military, medical, and consumer electronics. For example, high-performance head-mounted displays (HMDs) are crucial in military settings, exemplified by the USD 400,000 mixed reality helmet used by pilots. Major tech players like Apple and Google are pioneering developments, notably with products like Apple's Vision Pro, which integrates sophisticated microdisplay technology for augmented reality (AR) and virtual reality (VR) applications. Despite challenges such as high production costs, innovations in automotive microdisplay applications, like Head-Up Displays (HUDs) and Advanced Driver Assistance Systems (ADAS), signal strong market potential. Overall, the microdisplay market is set to thrive, shaping future display technologies across diverse industries.

Microdisplay Market Dynamics

Drivers

  • Augmented Reality in Automotive Driving Demand for Microdisplay

The integration of augmented reality (AR) in the automotive sector is a significant driver for the microdisplay market. As AR technologies enhance driver awareness and safety, the demand for advanced microdisplay solutions, particularly in Head-Up Displays (HUDs) and Advanced Driver Assistance Systems (ADAS), is surging. For instance, Volkswagen is at the forefront, employing high-resolution data glasses and planning to incorporate 3D HUDs that merge critical information with real-world environments. Similarly, DHL has reported a 15% productivity increase using AR "Vision Picking" smart glasses in its global warehouses, demonstrating AR's transformative potential. As companies increasingly recognize the value of AR in real-time data visualization and enhanced training, the microdisplay market is poised for substantial growth. This sector's evolution is vital for the seamless integration of digital elements into physical surroundings, thereby fostering innovation in safety features and operational efficiency. by leveraging advanced microdisplay technologies, the automotive industry can significantly improve driver engagement and safety outcomes, highlighting the essential role of microdisplay in the future of transportation.

Restraints

  • Supply Chain Challenges in the Microdisplay Market Impacting Component Shortages and Rising Production Costs on Growth

Effectively addressing the significant supply chain challenges in the microdisplay market is essential, as these issues can disrupt production schedules and lengthen lead times. A major concern is the shortage of critical components, particularly specialized materials such as semiconductors, OLED films, and MicroLED chips. The increasing demand for these components, coupled with limited manufacturing capacity, has caused notable production disruptions across various sectors. Furthermore, the manufacturing process for advanced microdisplays heavily depends on rare materials like indium and gallium. Variability in the availability of these raw materials can severely affect production capabilities, especially as the demand for high-performance displays continues to grow.

Logistical issues exacerbate the supply chain complications, with transportation disruptions stemming from geopolitical tensions and natural disasters causing delays in shipping vital components. These delays not only escalate costs but also extend lead times for manufacturers. The inherent volatility in the microdisplay market adds another layer of complexity, making accurate demand forecasting difficult and resulting in potential overstock or shortages. As a consequence, rising production costs emerge from these challenges, driving manufacturers to invest in more resilient supply chains or diversify their supplier networks. The increase in logistics costs has been particularly significant, with a 2021 report by the American Transportation Research Institute indicating a 21% rise in transportation expenses year-over-year. This surge further complicates manufacturers' ability to sustain profitability amidst ongoing supply chain disruptions. Addressing these challenges is critical for the microdisplay market to continue its growth trajectory and meet customer demands effectively.

Segment Analysis of Microdisplay Industry

by Product

In 2023, the microdisplay market experienced remarkable growth, particularly driven by the Near-To-Eye (NTE) segment, which captured approximately 57% of total revenue. This surge is attributed to significant advancements and product launches from key industry players in augmented reality (AR) and virtual reality (VR). Companies like Meta and Sony have been instrumental in this growth. Meta's Meta Quest 3, featuring advanced NTE microdisplay technology, enhances resolution and provides a more immersive experience for gaming and social interactions. In parallel, Sony's PlayStation VR2 incorporates a high-resolution OLED display that improves visual clarity and realism, securing a substantial share of the gaming market. Furthermore, MicroVision recently announced a new line of MicroLED displays specifically designed for NTE applications, promising enhanced brightness and energy efficiency. The rising consumer demand for AR glasses, particularly in gaming and training sectors, has prompted increased investments in this segment. As the appetite for immersive experiences continues to grow, ongoing research and development will likely drive further innovations across all microdisplay segments, ensuring sustained growth in this dynamic market.

by Technology

In 2023, the microdisplay market witnessed significant growth, with Liquid Crystal Displays (LCDs) capturing the largest revenue share, accounting for approximately 40% of the total market. This dominance can be attributed to several factors, including the widespread adoption of LCD technology across various applications, such as consumer electronics, automotive displays, and wearable devices.

LCDs are favored for their ability to provide high-quality images with excellent color reproduction and energy efficiency, making them ideal for a range of applications. Companies like Samsung, LG Display, and Sharp have been at the forefront of LCD technology, continuously enhancing display resolution and energy efficiency. For instance, LG Display's innovations in LCD technology have enabled the production of ultra-thin displays that are lightweight and suitable for portable devices, thus driving demand in sectors such as smartphones and tablets. In addition to traditional LCDs, advancements in specialized LCD technologies, such as IPS (In-Plane Switching) and VA (Vertical Alignment), have further enhanced viewing angles and contrast ratios, making these displays highly sought after in the gaming and professional markets. As consumer demand for high-performance displays continues to rise, manufacturers are investing in R&D to develop next-generation LCD technologies that will maintain their competitive edge in the microdisplay market. The expansion of applications in augmented reality (AR) and virtual reality (VR) has prompted innovations in LCD technology to improve refresh rates and reduce latency.

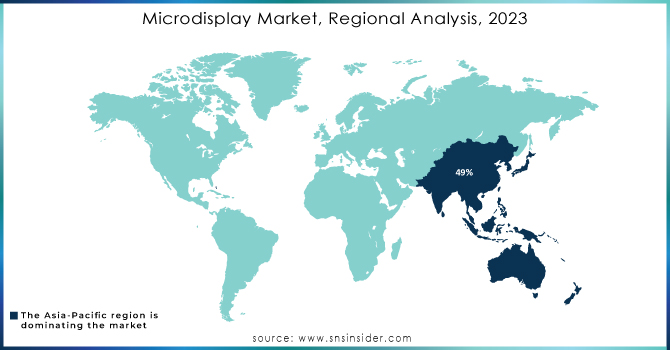
Microdisplay Market - Regional Outlook

In 2023, the Asia-Pacific region emerged as the dominant for microdisplay market, securing approximately 49% of the global revenue share. This significant growth is fueled by technological advancements, surging demand for consumer electronics, and noteworthy product developments across various countries. Major companies such as Sony, Samsung, and LG Display are at the forefront of innovation, with Sony introducing its Crystal LED microdisplay technology tailored for immersive entertainment experiences. Meanwhile, Samsung's innovations in MicroLED technology are enhancing display resolution and color accuracy, meeting consumer expectations for high-quality visuals.

Countries like China, Japan, and India are witnessing robust growth in their consumer electronics markets, prompting manufacturers to adopt advanced microdisplay solutions. Notable investments in augmented reality (AR) and virtual reality (VR) are evident in Japan, with companies like Panasonic developing AR glasses featuring high-performance microdisplay. The automotive sector in South Korea and Japan is rapidly integrating microdisplay technologies into advanced driver-assistance systems (ADAS) and head-up displays (HUDs). This regional focus on innovation and investment positions the Asia-Pacific region as a key player in the global microdisplay market, poised for sustained growth.

In 2023, North America established itself as the fastest-growing region in the microdisplay market, driven by the escalating demand for advanced display technologies across multiple sectors. This growth is primarily attributed to the rising popularity of augmented reality (AR) and virtual reality (VR) applications, particularly in head-mounted displays (HMDs) and head-up displays (HUDs) within the automotive industry. These innovations have significantly increased the need for compact, high-resolution, and energy-efficient microdisplays.

The United States and Canada are leading this expansion, with considerable investments in the consumer electronics market. Key industry players, such as eMagin Corporation and Kopin Corporation, are at the forefront of advancements in microdisplay technology, focusing on enhancing resolution and brightness tailored for AR and VR applications. Moreover, the growing adoption of wearable devices and smart glasses further propels market growth, as these technologies increasingly incorporate microdisplay solutions to elevate user experiences. With ongoing technological innovations and rising consumer demand, North America is poised for sustained growth in the microdisplay market.

Microdisplay-Market-Regional-Analysis-2023

Need Any Customization Research On Microdisplay Market - Inquiry Now

Key Players:

Some of the major key players in Microdisplay market who provide product and offering:

  • Sony Corporation (Micro OLED Displays, Head-Mounted Displays)

  • LG Display (OLED Panels, Tandem OLED Displays)

  • eMagin Corporation (OLED Microdisplay , Virtual Reality Headsets)

  • Kopin Corporation (Microdisplay  for AR/VR, Backplane Controllers)

  • Himax Technologies (LCOS Microdisplay , Driver ICs)

  • AU Optronics (LCD Panels, OLED Displays)

  • Seiko Epson Corporation (Micro OLED Displays, Smart Glasses)

  • Syndiant (LCOS Microdisplay , Pico Projectors)

  • MicroVision (Laser Scanning Displays, AR Technology)

  • Texas Instruments (Digital Light Processing (DLP) Chips)

  • Panasonic Corporation (OLED Displays, Projectors)

  • Universal Display Corporation (PHOLED Materials, OLED Technologies)

  • Oculus VR (VR Headsets, Oculus Quest Series)

  • Vuzix Corporation (Smart Glasses, AR Glasses)

  • Google LLC (Google Glass, AR/VR Technologies)

  • Apple Inc. (AR Glasses, VR Headsets)

  • Samsung Electronics (QLED Displays, MicroLED Displays)

  • Microchip Technology Inc. (Display Controllers, Microcontrollers for Displays)

  • Nikon Corporation (Micro OLED Displays, Optical Instruments)

  • Sharp Corporation (IGZO LCDs, OLED Panels)

List of Suppliers

  • Corning Incorporated

  • 3M

  • Materialise NV

  • LITE-ON Technology Corporation

  • Applied Materials

  • Nippon Electric Glass Co.

  • Avery Dennison Corporation

  • Sumitomo Chemical

  • Novaled GmbH

  • Sharp Electronics

Recent Development

  • In June 2024, LG Display, a leading organization in display technologies, announced the start of mass production for the world's first 13-inch Tandem OLED panel designed for laptops. The company is concentrating on the OLED market by leveraging the enhanced performance and lower power consumption offered by Tandem OLED technology.

  • In January 2024, Kopin Corporation and MICLEDI Microdisplay unveiled a collaborative initiative aimed at creating advanced micro-LED displays for an immersive augmented reality experience, even in high-brightness light conditions. This partnership merges MICLEDI's CMOS manufacturing process with Kopin's expertise in backplane control and driving capabilities to develop high-performance microLED displays.

  • In May 2024, VueReal introduced its groundbreaking ColourFusion microDisplay, marking a significant leap forward in augmented reality (AR) display technology. This new microDisplay employs VueReal's proprietary MicroSolid Printing technology, enabling the efficient manufacturing of full-color microLED displays.

  • In April 2024, researchers at the Fraunhofer Institute for Photonic Microsystems (IPMS) achieved noteworthy progress in the development of semi-transparent OLED microdisplay . They successfully enhanced the transparency of their OLED microdisplay  to 45%, resulting in a high-resolution microdisplay that is considerably lighter than conventional optical see-through systems used in augmented reality (AR) applications.

Microdisplay Market Report Scope:

Report Attributes Details
Market Size in 2023 USD 2.45 Billion
Market Size by 2032 USD 13.82 Billion
CAGR CAGR of 21.29%From 2024 to 2032
Base Year 2023
Forecast Period 2024-2032
Historical Data 2020-2022
Report Scope & Coverage Market Size, Segments Analysis, Competitive  Landscape, Regional Analysis, DROC & SWOT Analysis, Forecast Outlook
Key Segments • By Product (Near-To-Eye, Projection, Others)
• By Technology (Liquid Crystal Display (LCD), Organic Light-emitting Diode (OLED), Digital Light Processing (DLP), Liquid Crystal on Silicon (LCoS))
• By Application (Consumer Electronics, Military & Defense, Medical Applications, Industrial Systems, Automotive, Others)
Regional Analysis/Coverage North America (US, Canada, Mexico), Europe (Eastern Europe [Poland, Romania, Hungary, Turkey, Rest of Eastern Europe] Western Europe] Germany, France, UK, Italy, Spain, Netherlands, Switzerland, Austria, Rest of Western Europe]), Asia-Pacific (China, India, Japan, South Korea, Vietnam, Singapore, Australia, Rest of Asia-Pacific), Middle East & Africa (Middle East [UAE, Egypt, Saudi Arabia, Qatar, Rest of Middle East], Africa [Nigeria, South Africa, Rest of Africa], Latin America (Brazil, Argentina, Colombia, Rest of Latin America)
Company Profiles Sony Corporation, LG Display, eMagin Corporation, , Himax Technologies, AU Optronics, Seiko Epson Corporation, Syndiant, MicroVision, Texas Instruments, Panasonic Corporation, Universal Display Corporation, Oculus VR, Vuzix Corporation, Google LLC, Apple Inc., Samsung Electronics, Microchip Technology Inc., Nikon Corporation, Sharp Corporation.
Key Drivers • Augmented Reality in Automotive Driving Demand for Microdisplay 
RESTRAINTS • Supply Chain Challenges in the Microdisplay Market Impacting Component Shortages and Rising Production Costs on Growth

Frequently Asked Questions

Ans: The Microdisplay Market size was valued at USD 2.45 Billion in 2023 and it is expected to reach USD 13.82 Billion by 2032.

Ans:  The Microdisplay Market grow at a CAGR of 21.29% over the forecast period of 2024-2032.

Major growth sectors include AR/VR (for immersive experiences), automotive (HUDs), healthcare (medical imaging devices), defense (night vision and HUDs), and consumer electronics, especially wearables and smart glasses.

The microdisplay market is driven by the growing demand for AR/VR devices, advancements in automotive heads-up displays, and increasing use in medical devices and wearable tech. The trend towards smaller, more power-efficient, high-resolution displays fuels market growth

Ans: Sony Corporation, LG Display, eMagin Corporation, , Himax Technologies, AU Optronics, Seiko Epson Corporation, Syndiant, MicroVision, Texas Instruments, Panasonic Corporation, Universal Display Corporation, Oculus VR, Vuzix Corporation, Google LLC, Apple Inc., Samsung Electronics, Microchip Technology Inc., Nikon Corporation, Sharp Corporation.

Table of Content

1. Introduction

1.1 Market Definition

1.2 Scope (Inclusion and Exclusions)

1.3 Research Assumptions

2. Executive Summary

2.1 Market Overview

2.2 Regional Synopsis

2.3 Competitive Summary

3. Research Methodology

3.1 Top-Down Approach

3.2 Bottom-up Approach

3.3. Data Validation

3.4 Primary Interviews

4. Market Dynamics Impact Analysis

4.1 Market Driving Factors Analysis

4.1.1 Drivers

4.1.2 Restraints

4.1.3 Opportunities

4.1.4 Challenges

4.2 PESTLE Analysis

4.3 Porter’s Five Forces Model

5. Statistical Insights and Trends Reporting

5.1 Wafer Production Volumes, by Region (2023)

5.2 Chip Design Trends (Historic and Future)

5.3 Fab Capacity Utilization (2023)

5.4 Supply Chain Metrics

6. Competitive Landscape

6.1 List of Major Companies, by Region

6.2 Market Share Analysis, by Region

6.3 Product Benchmarking

6.3.1 Product specifications and features

6.3.2 Pricing

6.4 Strategic Initiatives

6.4.1 Marketing and promotional activities

6.4.2 Distribution and supply chain strategies

6.4.3 Expansion plans and new product launches

6.4.4 Strategic partnerships and collaborations

6.5 Technological Advancements

6.6 Market Positioning and Branding

7. Microdisplay Market Segmentation, by Product

7.1 Chapter Overview

7.2 Near-To-Eye

7.2.1 Near-To-Eye Market Trends Analysis (2020-2032)

7.2.2 Near-To-Eye Market Size Estimates and Forecasts to 2032 (USD Billion)

7.3 Projection

7.3.1 Projection Market Trends Analysis (2020-2032)

7.3.2 Projection Market Size Estimates and Forecasts to 2032 (USD Billion)

7.4 Others

7.4.1 Others Market Trends Analysis (2020-2032)

7.4.2 Others Market Size Estimates and Forecasts to 2032 (USD Billion)

8. Microdisplay Market Segmentation, by Technology

8.1 Chapter Overview

8.2 Liquid Crystal Display (LCD)

8.2.1 Liquid Crystal Display (LCD) Market Trends Analysis (2020-2032)

8.2.2 Liquid Crystal Display (LCD) Market Size Estimates and Forecasts to 2032 (USD Billion)

8.3 Organic Light-emitting Diode (OLED)

8.3.1 Organic Light-emitting Diode (OLED) Market Trends Analysis (2020-2032)

8.3.2 Organic Light-emitting Diode (OLED) Market Size Estimates and Forecasts to 2032 (USD Billion)

8.4 Digital Light Processing (DLP)

8.4.1 Digital Light Processing (DLP) Market Trends Analysis (2020-2032)

8.4.2 Digital Light Processing (DLP) Market Size Estimates and Forecasts to 2032 (USD Billion)

8.5 Liquid Crystal on Silicon (LCoS)

8.5.1 Liquid Crystal on Silicon (LCoS) Market Trends Analysis (2020-2032)

8.5.2 Liquid Crystal on Silicon (LCoS) Market Size Estimates and Forecasts to 2032 (USD Billion)

9. Microdisplay Market Segmentation, by Application

9.1 Chapter Overview

9.2 Consumer Electronics

9.2.1 Consumer Electronics Market Trends Analysis (2020-2032)

9.2.2 Consumer Electronics Market Size Estimates and Forecasts to 2032 (USD Billion)

9.3 Military & Defense

9.3.1 Military & Defense Market Trends Analysis (2020-2032)

9.3.2 Military & Defense Market Size Estimates and Forecasts to 2032 (USD Billion)

9.4 Medical Applications

9.4.1 Medical Applications Market Trends Analysis (2020-2032)

9.4.2 Medical Applications Market Size Estimates and Forecasts to 2032 (USD Billion)

9.5 Medical Applications

9.5.1 Medical Applications Market Trends Analysis (2020-2032)

9.5.2 Medical Applications Market Size Estimates and Forecasts to 2032 (USD Billion)

9.6 Automotive

9.6.1 Automotive Market Trends Analysis (2020-2032)

9.6.2 Automotive Market Size Estimates and Forecasts to 2032 (USD Billion)

9.7 Others

9.7.1 Others Market Trends Analysis (2020-2032)

9.7.2 Others Market Size Estimates and Forecasts to 2032 (USD Billion)

10. Regional Analysis

10.1 Chapter Overview

10.2 North America

10.2.1 Trends Analysis

10.2.2 North America Microdisplay Market Estimates and Forecasts, by Country (2020-2032) (USD Billion)

10.2.3 North America Microdisplay Market Estimates and Forecasts, by Product (2020-2032) (USD Billion)  

10.2.4 North America Microdisplay Market Estimates and Forecasts, by Technology (2020-2032) (USD Billion)

10.2.5 North America Microdisplay Market Estimates and Forecasts, by Application (2020-2032) (USD Billion)

10.2.6 USA

10.2.6.1 USA Microdisplay Market Estimates and Forecasts, by Product (2020-2032) (USD Billion)

10.2.6.2 USA Microdisplay Market Estimates and Forecasts, by Technology (2020-2032) (USD Billion)

10.2.6.3 USA Microdisplay Market Estimates and Forecasts, by Application (2020-2032) (USD Billion)

10.2.7 Canada

10.2.7.1 Canada Microdisplay Market Estimates and Forecasts, by Product (2020-2032) (USD Billion)

10.2.7.2 Canada Microdisplay Market Estimates and Forecasts, by Technology (2020-2032) (USD Billion)

10.2.7.3 Canada Microdisplay Market Estimates and Forecasts, by Application (2020-2032) (USD Billion)

10.2.8 Mexico

10.2.8.1 Mexico Microdisplay Market Estimates and Forecasts, by Product (2020-2032) (USD Billion)

10.2.8.2 Mexico Microdisplay Market Estimates and Forecasts, by Technology (2020-2032) (USD Billion)

10.2.8.3 Mexico Microdisplay Market Estimates and Forecasts, by Application (2020-2032) (USD Billion)

10.3 Europe

10.3.1 Eastern Europe

10.3.1.1 Trends Analysis

10.3.1.2 Eastern Europe Microdisplay Market Estimates and Forecasts, by Country (2020-2032) (USD Billion)

10.3.1.3 Eastern Europe Microdisplay Market Estimates and Forecasts, by Product (2020-2032) (USD Billion)  

10.3.1.4 Eastern Europe Microdisplay Market Estimates and Forecasts, by Technology (2020-2032) (USD Billion)

10.3.1.5 Eastern Europe Microdisplay Market Estimates and Forecasts, by Application (2020-2032) (USD Billion)

10.3.1.6 Poland

10.3.1.6.1 Poland Microdisplay Market Estimates and Forecasts, by Product (2020-2032) (USD Billion)

10.3.1.6.2 Poland Microdisplay Market Estimates and Forecasts, by Technology (2020-2032) (USD Billion)

10.3.1.6.3 Poland Microdisplay Market Estimates and Forecasts, by Application (2020-2032) (USD Billion)

10.3.1.7 Romania

10.3.1.7.1 Romania Microdisplay Market Estimates and Forecasts, by Product (2020-2032) (USD Billion)

10.3.1.7.2 Romania Microdisplay Market Estimates and Forecasts, by Technology (2020-2032) (USD Billion)

10.3.1.7.3 Romania Microdisplay Market Estimates and Forecasts, by Application (2020-2032) (USD Billion)

10.3.1.8 Hungary

10.3.1.8.1 Hungary Microdisplay Market Estimates and Forecasts, by Product (2020-2032) (USD Billion)

10.3.1.8.2 Hungary Microdisplay Market Estimates and Forecasts, by Technology (2020-2032) (USD Billion)

10.3.1.8.3 Hungary Microdisplay Market Estimates and Forecasts, by Application (2020-2032) (USD Billion)

10.3.1.9 Turkey

10.3.1.9.1 Turkey Microdisplay Market Estimates and Forecasts, by Product (2020-2032) (USD Billion)

10.3.1.9.2 Turkey Microdisplay Market Estimates and Forecasts, by Technology (2020-2032) (USD Billion)

10.3.1.9.3 Turkey Microdisplay Market Estimates and Forecasts, by Application (2020-2032) (USD Billion)

10.3.1.10 Rest of Eastern Europe

10.3.1.10.1 Rest of Eastern Europe Microdisplay Market Estimates and Forecasts, by Product (2020-2032) (USD Billion)

10.3.1.10.2 Rest of Eastern Europe Microdisplay Market Estimates and Forecasts, by Technology (2020-2032) (USD Billion)

10.3.1.10.3 Rest of Eastern Europe Microdisplay Market Estimates and Forecasts, by Application (2020-2032) (USD Billion)

10.3.2 Western Europe

10.3.2.1 Trends Analysis

10.3.2.2 Western Europe Microdisplay Market Estimates and Forecasts, by Country (2020-2032) (USD Billion)

10.3.2.3 Western Europe Microdisplay Market Estimates and Forecasts, by Product (2020-2032) (USD Billion)  

10.3.2.4 Western Europe Microdisplay Market Estimates and Forecasts, by Technology (2020-2032) (USD Billion)

10.3.2.5 Western Europe Microdisplay Market Estimates and Forecasts, by Application (2020-2032) (USD Billion)

10.3.2.6 Germany

10.3.2.6.1 Germany Microdisplay Market Estimates and Forecasts, by Product (2020-2032) (USD Billion)

10.3.2.6.2 Germany Microdisplay Market Estimates and Forecasts, by Technology (2020-2032) (USD Billion)

10.3.2.6.3 Germany Microdisplay Market Estimates and Forecasts, by Application (2020-2032) (USD Billion)

10.3.2.7 France

10.3.2.7.1 France Microdisplay Market Estimates and Forecasts, by Product (2020-2032) (USD Billion)

10.3.2.7.2 France Microdisplay Market Estimates and Forecasts, by Technology (2020-2032) (USD Billion)

10.3.2.7.3 France Microdisplay Market Estimates and Forecasts, by Application (2020-2032) (USD Billion)

10.3.2.8 UK

10.3.2.8.1 UK Microdisplay Market Estimates and Forecasts, by Product (2020-2032) (USD Billion)

10.3.2.8.2 UK Microdisplay Market Estimates and Forecasts, by Technology (2020-2032) (USD Billion)

10.3.2.8.3 UK Microdisplay Market Estimates and Forecasts, by Application (2020-2032) (USD Billion)

10.3.2.9 Italy

10.3.2.9.1 Italy Microdisplay Market Estimates and Forecasts, by Product (2020-2032) (USD Billion)

10.3.2.9.2 Italy Microdisplay Market Estimates and Forecasts, by Technology (2020-2032) (USD Billion)

10.3.2.9.3 Italy Microdisplay Market Estimates and Forecasts, by Application (2020-2032) (USD Billion)

10.3.2.10 Spain

10.3.2.10.1 Spain Microdisplay Market Estimates and Forecasts, by Product (2020-2032) (USD Billion)

10.3.2.10.2 Spain Microdisplay Market Estimates and Forecasts, by Technology (2020-2032) (USD Billion)

10.3.2.10.3 Spain Microdisplay Market Estimates and Forecasts, by Application (2020-2032) (USD Billion)

10.3.2.11 Netherlands

10.3.2.11.1 Netherlands Microdisplay Market Estimates and Forecasts, by Product (2020-2032) (USD Billion)

10.3.2.11.2 Netherlands Microdisplay Market Estimates and Forecasts, by Technology (2020-2032) (USD Billion)

10.3.2.11.3 Netherlands Microdisplay Market Estimates and Forecasts, by Application (2020-2032) (USD Billion)

10.3.2.12 Switzerland

10.3.2.12.1 Switzerland Microdisplay Market Estimates and Forecasts, by Product (2020-2032) (USD Billion)

10.3.2.12.2 Switzerland Microdisplay Market Estimates and Forecasts, by Technology (2020-2032) (USD Billion)

10.3.2.12.3 Switzerland Microdisplay Market Estimates and Forecasts, by Application (2020-2032) (USD Billion)

10.3.2.13 Austria

10.3.2.13.1 Austria Microdisplay Market Estimates and Forecasts, by Product (2020-2032) (USD Billion)

10.3.2.13.2 Austria Microdisplay Market Estimates and Forecasts, by Technology (2020-2032) (USD Billion)

10.3.2.13.3 Austria Microdisplay Market Estimates and Forecasts, by Application (2020-2032) (USD Billion)

10.3.2.14 Rest of Western Europe

10.3.2.14.1 Rest of Western Europe Microdisplay Market Estimates and Forecasts, by Product (2020-2032) (USD Billion)

10.3.2.14.2 Rest of Western Europe Microdisplay Market Estimates and Forecasts, by Technology (2020-2032) (USD Billion)

10.3.2.14.3 Rest of Western Europe Microdisplay Market Estimates and Forecasts, by Application (2020-2032) (USD Billion)

10.4 Asia-Pacific

10.4.1 Trends Analysis

10.4.2 Asia-Pacific Microdisplay Market Estimates and Forecasts, by Country (2020-2032) (USD Billion)

10.4.3 Asia-Pacific Microdisplay Market Estimates and Forecasts, by Product (2020-2032) (USD Billion)  

10.4.4 Asia-Pacific Microdisplay Market Estimates and Forecasts, by Technology (2020-2032) (USD Billion)

10.4.5 Asia-Pacific Microdisplay Market Estimates and Forecasts, by Application (2020-2032) (USD Billion)

10.4.6 China

10.4.6.1 China Microdisplay Market Estimates and Forecasts, by Product (2020-2032) (USD Billion)

10.4.6.2 China Microdisplay Market Estimates and Forecasts, by Technology (2020-2032) (USD Billion)

10.4.6.3 China Microdisplay Market Estimates and Forecasts, by Application (2020-2032) (USD Billion)

10.4.7 India

10.4.7.1 India Microdisplay Market Estimates and Forecasts, by Product (2020-2032) (USD Billion)

10.4.7.2 India Microdisplay Market Estimates and Forecasts, by Technology (2020-2032) (USD Billion)

10.4.7.3 India Microdisplay Market Estimates and Forecasts, by Application (2020-2032) (USD Billion)

10.4.8 Japan

10.4.8.1 Japan Microdisplay Market Estimates and Forecasts, by Product (2020-2032) (USD Billion)

10.4.8.2 Japan Microdisplay Market Estimates and Forecasts, by Technology (2020-2032) (USD Billion)

10.4.8.3 Japan Microdisplay Market Estimates and Forecasts, by Application (2020-2032) (USD Billion)

10.4.9 South Korea

10.4.9.1 South Korea Microdisplay Market Estimates and Forecasts, by Product (2020-2032) (USD Billion)

10.4.9.2 South Korea Microdisplay Market Estimates and Forecasts, by Technology (2020-2032) (USD Billion)

10.4.9.3 South Korea Microdisplay Market Estimates and Forecasts, by Application (2020-2032) (USD Billion)

10.4.10 Vietnam

10.4.10.1 Vietnam Microdisplay Market Estimates and Forecasts, by Product (2020-2032) (USD Billion)

10.4.10.2 Vietnam Microdisplay Market Estimates and Forecasts, by Technology (2020-2032) (USD Billion)

10.4.10.3 Vietnam Microdisplay Market Estimates and Forecasts, by Application (2020-2032) (USD Billion)

10.4.11 Singapore

10.4.11.1 Singapore Microdisplay Market Estimates and Forecasts, by Product (2020-2032) (USD Billion)

10.4.11.2 Singapore Microdisplay Market Estimates and Forecasts, by Technology (2020-2032) (USD Billion)

10.4.11.3 Singapore Microdisplay Market Estimates and Forecasts, by Application (2020-2032) (USD Billion)

10.4.12 Australia

10.4.12.1 Australia Microdisplay Market Estimates and Forecasts, by Product (2020-2032) (USD Billion)

10.4.12.2 Australia Microdisplay Market Estimates and Forecasts, by Technology (2020-2032) (USD Billion)

10.4.12.3 Australia Microdisplay Market Estimates and Forecasts, by Application (2020-2032) (USD Billion)

10.4.13 Rest of Asia-Pacific

10.4.13.1 Rest of Asia-Pacific Microdisplay Market Estimates and Forecasts, by Product (2020-2032) (USD Billion)

10.4.13.2 Rest of Asia-Pacific Microdisplay Market Estimates and Forecasts, by Technology (2020-2032) (USD Billion)

10.4.13.3 Rest of Asia-Pacific Microdisplay Market Estimates and Forecasts, by Application (2020-2032) (USD Billion)

10.5 Middle East and Africa

10.5.1 Middle East

10.5.1.1 Trends Analysis

10.5.1.2 Middle East Microdisplay Market Estimates and Forecasts, by Country (2020-2032) (USD Billion)

10.5.1.3 Middle East Microdisplay Market Estimates and Forecasts, by Product (2020-2032) (USD Billion)  

10.5.1.4 Middle East Microdisplay Market Estimates and Forecasts, by Technology (2020-2032) (USD Billion)

10.5.1.5 Middle East Microdisplay Market Estimates and Forecasts, by Application (2020-2032) (USD Billion)

10.5.1.6 UAE

10.5.1.6.1 UAE Microdisplay Market Estimates and Forecasts, by Product (2020-2032) (USD Billion)

10.5.1.6.2 UAE Microdisplay Market Estimates and Forecasts, by Technology (2020-2032) (USD Billion)

10.5.1.6.3 UAE Microdisplay Market Estimates and Forecasts, by Application (2020-2032) (USD Billion)

10.5.1.7 Egypt

10.5.1.7.1 Egypt Microdisplay Market Estimates and Forecasts, by Product (2020-2032) (USD Billion)

10.5.1.7.2 Egypt Microdisplay Market Estimates and Forecasts, by Technology (2020-2032) (USD Billion)

10.5.1.7.3 Egypt Microdisplay Market Estimates and Forecasts, by Application (2020-2032) (USD Billion)

10.5.1.8 Saudi Arabia

10.5.1.8.1 Saudi Arabia Microdisplay Market Estimates and Forecasts, by Product (2020-2032) (USD Billion)

10.5.1.8.2 Saudi Arabia Microdisplay Market Estimates and Forecasts, by Technology (2020-2032) (USD Billion)

10.5.1.8.3 Saudi Arabia Microdisplay Market Estimates and Forecasts, by Application (2020-2032) (USD Billion)

10.5.1.9 Qatar

10.5.1.9.1 Qatar Microdisplay Market Estimates and Forecasts, by Product (2020-2032) (USD Billion)

10.5.1.9.2 Qatar Microdisplay Market Estimates and Forecasts, by Technology (2020-2032) (USD Billion)

10.5.1.9.3 Qatar Microdisplay Market Estimates and Forecasts, by Application (2020-2032) (USD Billion)

10.5.1.10 Rest of Middle East

10.5.1.10.1 Rest of Middle East Microdisplay Market Estimates and Forecasts, by Product (2020-2032) (USD Billion)

10.5.1.10.2 Rest of Middle East Microdisplay Market Estimates and Forecasts, by Technology (2020-2032) (USD Billion)

10.5.1.10.3 Rest of Middle East Microdisplay Market Estimates and Forecasts, by Application (2020-2032) (USD Billion)

10.5.2 Africa

10.5.2.1 Trends Analysis

10.5.2.2 Africa Microdisplay Market Estimates and Forecasts, by Country (2020-2032) (USD Billion)

10.5.2.3 Africa Microdisplay Market Estimates and Forecasts, by Product (2020-2032) (USD Billion)  

10.5.2.4 Africa Microdisplay Market Estimates and Forecasts, by Technology (2020-2032) (USD Billion)

10.5.2.5 Africa Microdisplay Market Estimates and Forecasts, by Application (2020-2032) (USD Billion)

10.5.2.6 South Africa

10.5.2.6.1 South Africa Microdisplay Market Estimates and Forecasts, by Product (2020-2032) (USD Billion)

10.5.2.6.2 South Africa Microdisplay Market Estimates and Forecasts, by Technology (2020-2032) (USD Billion)

10.5.2.6.3 South Africa Microdisplay Market Estimates and Forecasts, by Application (2020-2032) (USD Billion)

10.5.2.7 Nigeria

10.5.2.7.1 Nigeria Microdisplay Market Estimates and Forecasts, by Product (2020-2032) (USD Billion)

10.5.2.7.2 Nigeria Microdisplay Market Estimates and Forecasts, by Technology (2020-2032) (USD Billion)

10.5.2.7.3 Nigeria Microdisplay Market Estimates and Forecasts, by Application (2020-2032) (USD Billion)

10.5.2.8 Rest of Africa

10.5.2.8.1 Rest of Africa Microdisplay Market Estimates and Forecasts, by Product (2020-2032) (USD Billion)

10.5.2.8.2 Rest of Africa Microdisplay Market Estimates and Forecasts, by Technology (2020-2032) (USD Billion)

10.5.2.8.3 Rest of Africa Microdisplay Market Estimates and Forecasts, by Application (2020-2032) (USD Billion)

10.6 Latin America

10.6.1 Trends Analysis

10.6.2 Latin America Microdisplay Market Estimates and Forecasts, by Country (2020-2032) (USD Billion)

10.6.3 Latin America Microdisplay Market Estimates and Forecasts, by Product (2020-2032) (USD Billion)  

10.6.4 Latin America Microdisplay Market Estimates and Forecasts, by Technology (2020-2032) (USD Billion)

10.6.5 Latin America Microdisplay Market Estimates and Forecasts, by Application (2020-2032) (USD Billion)

10.6.6 Brazil

10.6.6.1 Brazil Microdisplay Market Estimates and Forecasts, by Product (2020-2032) (USD Billion)

10.6.6.2 Brazil Microdisplay Market Estimates and Forecasts, by Technology (2020-2032) (USD Billion)

10.6.6.3 Brazil Microdisplay Market Estimates and Forecasts, by Application (2020-2032) (USD Billion)

10.6.7 Argentina

10.6.7.1 Argentina Microdisplay Market Estimates and Forecasts, by Product (2020-2032) (USD Billion)

10.6.7.2 Argentina Microdisplay Market Estimates and Forecasts, by Technology (2020-2032) (USD Billion)

10.6.7.3 Argentina Microdisplay Market Estimates and Forecasts, by Application (2020-2032) (USD Billion)

10.6.8 Colombia

10.6.8.1 Colombia Microdisplay Market Estimates and Forecasts, by Product (2020-2032) (USD Billion)

10.6.8.2 Colombia Microdisplay Market Estimates and Forecasts, by Technology (2020-2032) (USD Billion)

10.6.8.3 Colombia Microdisplay Market Estimates and Forecasts, by Application (2020-2032) (USD Billion)

10.6.9 Rest of Latin America

10.6.9.1 Rest of Latin America Microdisplay Market Estimates and Forecasts, by Product (2020-2032) (USD Billion)

10.6.9.2 Rest of Latin America Microdisplay Market Estimates and Forecasts, by Technology (2020-2032) (USD Billion)

10.6.9.3 Rest of Latin America Microdisplay Market Estimates and Forecasts, by Application (2020-2032) (USD Billion)

11. Company Profiles

11.1 Sony Corporation

11.1.1 Company Overview

11.1.2 Financial

11.1.3 Products/ Services Offered

11.1.4 SWOT Analysis

11.2 LG Display

11.2.1 Company Overview

11.2.2 Financial

11.2.3 Products/ Services Offered

11.2.4 SWOT Analysis

11.3 eMagin Corporation

11.3.1 Company Overview

11.3.2 Financial

11.3.3 Products/ Services Offered

11.3.4 SWOT Analysis

11.4 Himax Technologies

11.4.1 Company Overview

11.4.2 Financial

11.4.3 Products/ Services Offered

11.4.4 SWOT Analysis

11.5 AU Optronics

11.5.1 Company Overview

11.5.2 Financial

11.5.3 Products/ Services Offered

11.5.4 SWOT Analysis

11.6 Seiko Epson Corporation

11.6.1 Company Overview

11.6.2 Financial

11.6.3 Products/ Services Offered

11.6.4 SWOT Analysis

11.7 Syndiant

11.7.1 Company Overview

11.7.2 Financial

11.7.3 Products/ Services Offered

11.7.4 SWOT Analysis

11.8 MicroVision

11.8.1 Company Overview

11.8.2 Financial

11.8.3 Products/ Services Offered

11.8.4 SWOT Analysis

11.9 Texas Instruments

11.9.1 Company Overview

11.9.2 Financial

11.9.3 Products/ Services Offered

11.9.4 SWOT Analysis

11.10 Panasonic Corporation

11.10.1 Company Overview

11.10.2 Financial

11.10.3 Products/ Services Offered

11.10.4 SWOT Analysis

12. Use Cases and Best Practices

13. Conclusion

An accurate research report requires proper strategizing as well as implementation. There are multiple factors involved in the completion of good and accurate research report and selecting the best methodology to compete the research is the toughest part. Since the research reports we provide play a crucial role in any company’s decision-making process, therefore we at SNS Insider always believe that we should choose the best method which gives us results closer to reality. This allows us to reach at a stage wherein we can provide our clients best and accurate investment to output ratio.

Each report that we prepare takes a timeframe of 350-400 business hours for production. Starting from the selection of titles through a couple of in-depth brain storming session to the final QC process before uploading our titles on our website we dedicate around 350 working hours. The titles are selected based on their current market cap and the foreseen CAGR and growth.


The 5 steps process:

Step 1: Secondary Research:

Secondary Research or Desk Research is as the name suggests is a research process wherein, we collect data through the readily available information. In this process we use various paid and unpaid databases which our team has access to and gather data through the same. This includes examining of listed companies’ annual reports, Journals, SEC filling etc. Apart from this our team has access to various associations across the globe across different industries. Lastly, we have exchange relationships with various university as well as individual libraries.

Secondary Research

Step 2: Primary Research

When we talk about primary research, it is a type of study in which the researchers collect relevant data samples directly, rather than relying on previously collected data.  This type of research is focused on gaining content specific facts that can be sued to solve specific problems. Since the collected data is fresh and first hand therefore it makes the study more accurate and genuine.

We at SNS Insider have divided Primary Research into 2 parts.

Part 1 wherein we interview the KOLs of major players as well as the upcoming ones across various geographic regions. This allows us to have their view over the market scenario and acts as an important tool to come closer to the accurate market numbers. As many as 45 paid and unpaid primary interviews are taken from both the demand and supply side of the industry to make sure we land at an accurate judgement and analysis of the market.

This step involves the triangulation of data wherein our team analyses the interview transcripts, online survey responses and observation of on filed participants. The below mentioned chart should give a better understanding of the part 1 of the primary interview.

Primary Research

Part 2: In this part of primary research the data collected via secondary research and the part 1 of the primary research is validated with the interviews from individual consultants and subject matter experts.

Consultants are those set of people who have at least 12 years of experience and expertise within the industry whereas Subject Matter Experts are those with at least 15 years of experience behind their back within the same space. The data with the help of two main processes i.e., FGDs (Focused Group Discussions) and IDs (Individual Discussions). This gives us a 3rd party nonbiased primary view of the market scenario making it a more dependable one while collation of the data pointers.

Step 3: Data Bank Validation

Once all the information is collected via primary and secondary sources, we run that information for data validation. At our intelligence centre our research heads track a lot of information related to the market which includes the quarterly reports, the daily stock prices, and other relevant information. Our data bank server gets updated every fortnight and that is how the information which we collected using our primary and secondary information is revalidated in real time.

Data Bank Validation

Step 4: QA/QC Process

After all the data collection and validation our team does a final level of quality check and quality assurance to get rid of any unwanted or undesired mistakes. This might include but not limited to getting rid of the any typos, duplication of numbers or missing of any important information. The people involved in this process include technical content writers, research heads and graphics people. Once this process is completed the title gets uploader on our platform for our clients to read it.

Step 5: Final QC/QA Process:

This is the last process and comes when the client has ordered the study. In this process a final QA/QC is done before the study is emailed to the client. Since we believe in giving our clients a good experience of our research studies, therefore, to make sure that we do not lack at our end in any way humanly possible we do a final round of quality check and then dispatch the study to the client.

Key Segments:

By Product

  • Near-To-Eye

  • Projection

  • Others

By Technology

  • Liquid Crystal Display (LCD)

  • Organic Light-emitting Diode (OLED)

  • Digital Light Processing (DLP)

  • Liquid Crystal on Silicon (LCoS)

By Application

  • Consumer Electronics

  • Military & Defense

  • Medical Applications

  • Industrial Systems

  • Automotive

  • Others

 Request for Segment Customization as per your Business Requirement: Segment Customization Request

REGIONAL COVERAGE:

North America

  • US

  • Canada

  • Mexico

Europe

  • Eastern Europe

    • Poland

    • Romania

    • Hungary

    • Turkey

    • Rest of Eastern Europe

  • Western Europe

    • Germany

    • France

    • UK

    • Italy

    • Spain

    • Netherlands

    • Switzerland

    • Austria

    • Rest of Western Europe

Asia-Pacific

  • China

  • India

  • Japan

  • South Korea

  • Vietnam

  • Singapore

  • Australia

  • Rest of Asia Pacific

Middle East & Africa

  • Middle East

    • UAE

    • Egypt

    • Saudi Arabia

    • Qatar

    • Rest of the Middle East

  • Africa

    • Nigeria

    • South Africa

    • Rest of Africa

Latin America

  • Brazil

  • Argentina

  • Colombia

  • Rest of Latin America

Request for Country Level Research Report: Country Level Customization Request

Available Customization

With the given market data, SNS Insider offers customization as per the company’s specific needs. The following customization options are available for the report:

  • Product Analysis

  • Criss-Cross segment analysis (e.g. Product X Application)

  • Product Matrix which gives a detailed comparison of the product portfolio of each company

  • Geographic Analysis

  • Additional countries in any of the regions

  • Company Information

  • Detailed analysis and profiling of additional market players (Up to five)


  •            5000 (33% Discount)


  •            8950 (40% Discount)


  •            3050 (23% Discount)

Start a Conversation

Hi! Click one of our member below to chat on Phone