Get More Information on Micro Motor Market - Request Sample Report
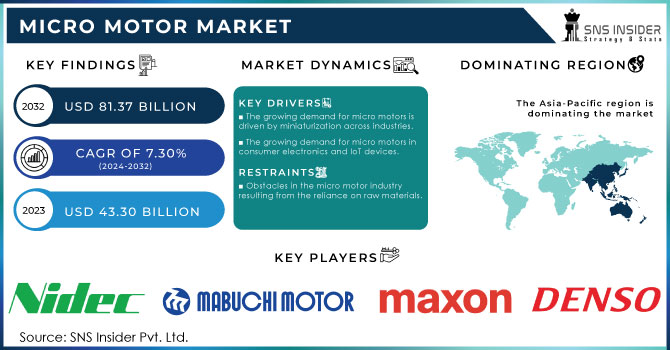
The Micro Motor Market was valued at USD 43.30 billion in 2023 and is expected to reach USD 81.37 billion by 2032, growing at a CAGR of 7.30% over the forecast period 2024-2032.
Recent advancements in technology and rising demand from diverse industries have led to substantial growth in the micro motor market. These small gadgets transform electrical power into kinetic energy and are used in various industries like automotive, consumer electronics, medical equipment, and robotics. Micro motors are essential for improving the functionality and performance of vehicles in the automotive industry. They are typically utilized in power windows, seat adjustments, and automated mirror movements. In the Asia-Pacific region, the uptake of electric vehicles (EVs) is rapidly expanding, with China at the forefront, responsible for around 65% of worldwide EV sales in 2023. The growth is mainly influenced by the rising emphasis on battery electric vehicles (BEVs), which made up 84.6% of the market share in 2023. 39 out of 49 member states in the APAC region are adopting strong government measures to promote the shift towards electric vehicles and achieve carbon neutrality. With the emergence of electric vehicles and smart technologies, the need for effective micro motors is projected to grow amidst the evolving automotive sector. Electric and hybrid vehicles, specifically need advanced systems to regulate different functions, with micro motors playing a crucial role in ensuring reliability and space-saving solutions.
Micro motors are essential in medical devices for their importance in precision and reliability within this application area. These motors are utilized in surgical instruments, dental tools, and devices for patient care, aiding in complex movements and procedures. In recent years, there has been a notable increase in the use of robotic-assisted surgeries and telemedicine in the United States. In 2024, about 15% of surgical procedures in the country are conducted with the help of robots, a significant rise from previous years when they were mainly used for specialized surgeries. At the same time, telemedicine use has surged significantly, particularly amidst and following the COVID-19 outbreak, with more than 75% of hospitals in the United States now incorporating some type of virtual care. Research suggests that 85% of patients are willing to use telemedicine for healthcare, indicating a change in patient perspectives on remote services. Telemedicine can potentially save over USD 100 billion per year in healthcare costs by decreasing the need for in-person appointments. With the rise of robotic-assisted surgeries and telemedicine in healthcare, there will be an increasing demand for advanced micro motors that can provide high performance in small sizes. Advances in this area, like brushless DC micro motors, provide improved effectiveness and durability, crucial for life-saving medical devices.
Drivers
The growing demand for micro motors is driven by miniaturization across industries.
The increasing demand for miniaturization in a wide range of industries is one of the key drivers identified for the Micro Motor Market as of 2020. Currently, consumers and various industries aim to employ relatively small, lighter, and more compact devices. Miniaturization leads to a gradual implementation of micro motors and the incorporation of these components into all industries. The convolution is particularly valid for consumer electronics, automotive, and medical devices. Miniaturization of smartphones, wearables, and other gadgets has already led to the creation of their slender design and facilitated the process of development of compact components. Micro motors, consequently, used for camera vibration, and haptic feedback have enabled enhanced usability and efficiency. Thereby, the pressure to create thinner and more powerful miniaturized products has led to an increased demand for better-performing micro motors. Vehicles require lightweight and compact differentiation which may be facilitated by micro motors, as well. The pressure to implement energy-efficient solutions by producing electric cars and vehicles with hybrid motors, requires the creation of miniaturized devices. Micro motors, thus, may be used for electric power steering, window lifts, and other minor car components.
The growing demand for micro motors in consumer electronics and IoT devices.
One of the key drivers of the Micro Motor Market is the increasing share of consumer electronics. As technology is advancing, the preferences of the customers are changing, and, currently, demand for high-performing and miniature motors is increasing accordingly. Having a compact and high-performance motor allows technology companies to develop more sophisticated and smaller gadgets that enhance users’ experience. As such, a variety of portable devices such as smartphones, tablets, wearables, and cameras utilize micro motors to include haptic feedback, stabilization, camera zoom, and more. Moreover, as with the rest of technologies, customers are demanding increasingly thinner and lightweight devices that have a limited capability to store and generate power, making a reliable and compact micro motor the best solution to this. As more homes and business become “smart”, such devices as smart locks and thermostats, automatic curtains, and the corresponding machinery are proliferating. Similar to the examples with personal technology, the miniaturization of devices and appliances in one’s home or office is a trend that is supported by the increasing reliance on IoT for automation. As a result, growing numbers of modern devices require a powerful, compact, and efficient motor.
Restraints
Obstacles in the micro motor industry resulting from the reliance on raw materials.
A crucial restraint for the Micro Motor Market is a dependence on raw materials. The production of micro motors in manufacturing processes is heavily reliant on specific materials essential to the undertaking, such as magnets, copper, and a plethora of alloys. Changes in the availability of said materials, as well as price fluctuations, can have adverse implications for production processes and related costs. Because supply chains can have disruptions that create shortages of required products, geopolitical tensions may lead to changes in the availability of materials, or alterations in demand and their relative percentage of new products in the market, manufacturers face significant uncertainty. Due to these conditions, manufacturing micro motors can present substantial challenges regarding managing costs and production schedules. Should uncertainties regarding the cost of the production of micro motors remain, it will positively affect relations between buyers and suppliers of the aforementioned products. Finally, manufacturers are likely to experience increased pressure on producing micro motors in an environmentally friendly way due to the adverse environmental effects of the extraction and processing of raw materials, a way which is supported by an increasing level of awareness and the adoption of green practices and which is likely to require significant investments.
By Type
DC motors held a market share of 65% in 2023 and eventually led the market because of their wide range of uses and effective power control. They provide superior speed regulation and high initial torque, which is perfect for tasks requiring precision. Sectors like automotive, robotics, and medical devices depend greatly on DC micro motors for efficient and dependable functioning. Johnson Electric, for example, utilizes DC motors in automotive parts such as window lifters and seat adjusters. Moreover, Nidec Corporation utilizes DC motors in robotics due to their precise control abilities, underscoring their widespread use in new technologies.
AC motors, renowned for their long-lasting quality and minimal upkeep, are experiencing a surge in CAGR during the forecast period 2024-2032. Demand is boosted by their utilization in household devices, HVAC units, and industrial settings. For instance, ABB uses AC motors in energy-saving industrial machinery, while Siemens incorporates them in HVAC systems to enhance energy efficiency. The increasing emphasis on saving energy and the popularity of smart home technology drive the use of AC micro motors. As industries move towards sustainability and energy efficiency, AC motors are projected to see rapid growth in the future.
By Power Consumption
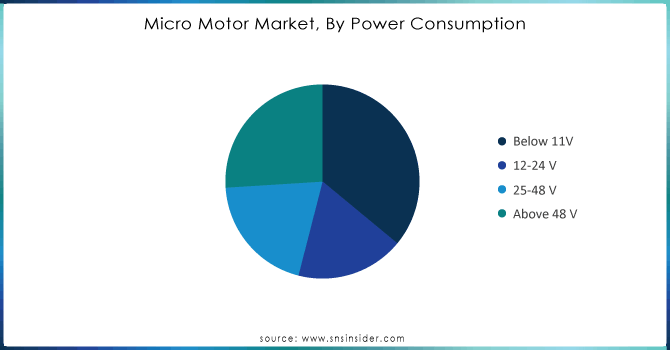
The below 11V segment held a major market share of 36% in 2023 and led the market because it is commonly used in low power applications like consumer electronics, small medical devices, and precision equipment. These small motors are popular for being small in size, consuming little energy, and for being cost-effective. Sectors such as healthcare, in which compact yet effective motors are essential for devices like insulin pumps and dental tools, depend greatly on these motors. For instance, Johnson Electric provides micro motors for home appliances and electronic gadgets.
The segment above 48V is experiencing a rapid growth rate during 2024-2032 in the micro motor market, spurred by the rising popularity of electric vehicles (EVs), industrial automation, and heavy machinery. These high-capacity motors provide improved functionality for jobs that demand increased torque and power. They are essential components of electric vehicles' powertrain systems, contributing to improved energy usage and overall performance. For instance, Maxon Motor offers high-voltage micro motors for robotics, while Faulhaber provides motors above 48V for advanced EV applications.
Need any customization research on Micro Motor Market - Enquiry Now
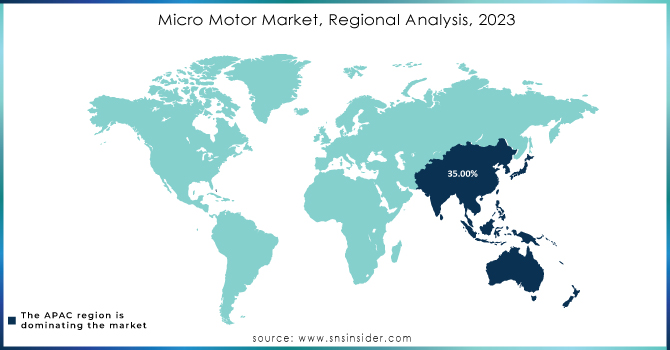
APAC dominated the market in 2023 with a 35% market share because of its robust industrial foundation and fast urban growth. Nations such as China, Japan, and South Korea have strong manufacturing industries that create a need for micro motors in automation, consumer electronics, and automotive fields. Key sectors like electric vehicle production and robotics are major factors driving growth. For example, businesses such as Nidec Corporation and Mabuchi Motors have large manufacturing plants in the area, serving the automotive, healthcare, and industrial industries. The market in APAC is being further boosted by the rise of smart homes and the growing popularity of electric vehicles.
North America is accounted to have a rapid growth rate of 7.82% during 2024-2032, due to progress in aerospace, healthcare, and electric vehicles. The area is experiencing substantial investments in automation and defense, resulting in a strong need for precision micro motors. Maxon Motor and Johnson Electric are providing micro motors for use in medical tools, drones, and robotics. North America's market expansion is being sped up by the fast technological progress and the use of smart devices in fields such as healthcare and automotive.
The major key players in the market are:
Nidec Corporation (DC Brushless Motors, Stepping Motors)
Mabuchi Motor Co., Ltd. (Coreless Motors, Brushed DC Motors)
Johnson Electric Holdings Limited (Brushless DC Motors, Actuators)
Maxon Group (ECX Speed Motors, A-Max DC Motors)
Faulhaber Group (BX4 Series Brushless Motors, SR Flat DC Micromotors)
ABB Ltd. (AC Servo Motors, NEMA Frame Motors)
Allied Motion Technologies, Inc. (Brushless Motors, Gimbal Motors)
Denso Corporation (Electric Power Steering Motors, HVAC Motors)
Portescap (Disc Magnet Motors, Ultra EC Brushless Motors)
Moog Inc. (Fractional Horsepower Motors, Torque Motors)
Siemens AG (SIMOTICS Micro Drives, Synchronous Motors)
MinebeaMitsumi Inc. (Vibration Motors, Precision Brushless Motors)
Yaskawa Electric Corporation (Sigma Series Servo Motors, Rotary Servo Motors)
Shinano Kenshi Co., Ltd. (Hybrid Stepping Motors, Coreless DC Motors)
Oriental Motor Co., Ltd. (Stepper Motors, Brushless DC Motors)
Asmo Co., Ltd. (Window Lift Motors, Wiper Motors)
Mitsuba Corporation (Starter Motors, Blower Motors)
AMETEK, Inc. (Pittman Brush DC Motors, Haydon Kerk Linear Actuators)
Parvalux Electric Motors Ltd. (PMDC Motors, Planetary Gear Motors)
Koford Engineering LLC (High-Speed Brushless Motors, Slotless Motors)
March 2024 – Faulhaber introduced a new line of micro motors with a metal planetary gearhead. The product is specifically designed for a broad range of compact industrial applications. The gearheads can improve the torque capacity and rigidity, making the motors suitable for highly precise medical and industrial tasks requiring stable and durable components.
January 2024 – Maxon developed a flat DC micro motor series improved for ultra-compact applications, such as wearable technology and medical devices. The design of the new series allowed for high power efficiency in minimal space.
September 2023 – A new brushless DC micro motor with an integrated encoder was developed by Portescap. The product was integrated into robotics and medical applications with innovative performance requirements. Similarly, the unique component design allowed for more precise control and a longer product lifespan.. In this way, the absence of brushes at high speeds created less friction and generated less heat.
February 2023 – Nidec developed a micro motor solution with high comparative torque for the needs of the electric vehicle market. The increased capacity was achieved through a unique and lightweight design, allowing electric vehicles to fulfill the requirements of additional power and efficiency, maintaining a lower total weight.
June 2023 – Johnson Electric created a new generation of high-efficiency micro motors, intended for high-power household appliances, such as industrial vacuum cleaners and coffee machines. The product decreased the overall noise generated by the appliances and improved energy efficiency with the geometry of the components.
Report Attributes | Details |
---|---|
Market Size in 2023 | USD 43.30 Billion |
Market Size by 2032 | USD 81.37 Billion |
CAGR | CAGR of 7.30% From 2024 to 2032 |
Base Year | 2023 |
Forecast Period | 2024-2032 |
Historical Data | 2020-2022 |
Report Scope & Coverage | Market Size, Segments Analysis, Competitive Landscape, Regional Analysis, DROC & SWOT Analysis, Forecast Outlook |
Key Segments | • By Type (AC Motor, DC Motor) • By Power Consumption (Below 11V, 12-24V, 24-48V, Above 48V) • By Application (Automotive, Industrial Automation, Electronic Appliances, Healthcare, Aerospace, Others) |
Regional Analysis/Coverage | North America (US, Canada, Mexico), Europe (Eastern Europe [Poland, Romania, Hungary, Turkey, Rest of Eastern Europe] Western Europe] Germany, France, UK, Italy, Spain, Netherlands, Switzerland, Austria, Rest of Western Europe]), Asia Pacific (China, India, Japan, South Korea, Vietnam, Singapore, Australia, Rest of Asia Pacific), Middle East & Africa (Middle East [UAE, Egypt, Saudi Arabia, Qatar, Rest of Middle East], Africa [Nigeria, South Africa, Rest of Africa], Latin America (Brazil, Argentina, Colombia, Rest of Latin America) |
Company Profiles | Nidec Corporation, Mabuchi Motor Co., Ltd., Johnson Electric Holdings Limited, Maxon Group, Faulhaber Group, ABB Ltd., Allied Motion Technologies, Inc., Denso Corporation, Portescap, Moog Inc., Siemens AG, MinebeaMitsumi Inc., Yaskawa Electric Corporation, Shinano Kenshi Co., Ltd., Oriental Motor Co., Ltd., Asmo Co., Ltd., Mitsuba Corporation, AMETEK, Inc., Parvalux Electric Motors Ltd., Koford Engineering LLC |
Key Drivers | • The growing demand for micro motors is driven by miniaturization across industries. • The growing demand for micro motors in consumer electronics and IoT devices. |
RESTRAINTS | • Obstacles in the micro motor industry resulting from the reliance on raw materials. |
Ans: The Micro Motor Market is expected to grow at a CAGR of 7.30% during 2024-2032.
Ans: The Micro Motor Market was USD 43.30 billion in 2023 and is expected to Reach USD 81.37 Billion by 2032.
Ans: The growing demand for micro motors is driven by miniaturization across industries.
Ans: The Automotive segment dominated the Micro Motor Market.
Ans: APAC dominated the Micro Motor Market in 2023.
Table of Content
1. Introduction
1.1 Market Definition
1.2 Scope (Inclusion and Exclusions)
1.3 Research Assumptions
2. Executive Summary
2.1 Market Overview
2.2 Regional Synopsis
2.3 Competitive Summary
3. Research Methodology
3.1 Top-Down Approach
3.2 Bottom-up Approach
3.3. Data Validation
3.4 Primary Interviews
4. Market Dynamics Impact Analysis
4.1 Market Driving Factors Analysis
4.1.1 Drivers
4.1.2 Restraints
4.1.3 Opportunities
4.1.4 Challenges
4.2 PESTLE Analysis
4.3 Porter’s Five Forces Model
5. Statistical Insights and Trends Reporting
5.1 Micro Motor Adoption Rate, 2023
5.2 Micro Motor Performance Benchmarks, 2023
5.3 Micro Motor Integration Capabilities
5.4 Usage Statistics, 2023
6. Competitive Landscape
6.1 List of Major Companies, By Region
6.2 Market Share Analysis, By Region
6.3 Product Benchmarking
6.3.1 Product specifications and features
6.3.2 Pricing
6.4 Strategic Initiatives
6.4.1 Marketing and promotional activities
6.4.2 Distribution and Supply Chain Strategies
6.4.3 Expansion plans and new product launches
6.4.4 Strategic partnerships and collaborations
6.5 Technological Advancements
6.6 Market Positioning and Branding
7. Micro Motor Market Segmentation, By Type
7.1 Chapter Overview
7.2 AC Motor
7.2.1 AC Motor Market Trends Analysis (2020-2032)
7.2.2 AC Motor Market Size Estimates and Forecasts to 2032 (USD Billion)
7.3 DC Motor
7.3.1 DC Motor Market Trends Analysis (2020-2032)
7.3.2 DC Motor Market Size Estimates and Forecasts to 2032 (USD Billion)
7.3.1.1 Brushed Market Trends Analysis (2020-2032)
7.3.1.2 Brushed Market Size Estimates and Forecasts to 2032 (USD Billion)
7.3.1.3 Brushless Market Trends Analysis (2020-2032)
7.3.1.4 Brushless Market Size Estimates and Forecasts to 2032 (USD Billion)
8. Micro Motor Market Segmentation, By Power Consumption
8.1 Chapter Overview
8.3 Below 11V
8.3.1 Below 11V Market Trends Analysis (2020-2032)
8.3.2 Below 11V Market Size Estimates and Forecasts to 2032 (USD Billion)
8.4 12-24 V
8.4.1 12-24 V Market Trends Analysis (2020-2032)
8.4.2 12-24 V Market Size Estimates and Forecasts to 2032 (USD Billion)
8.5 25-48 V
8.5.1 25-48 V Market Trends Analysis (2020-2032)
8.5.2 25-48 V Market Size Estimates and Forecasts to 2032 (USD Billion)
8.6 Above 48 V
8.6.1 Above 48 V Market Trends Analysis (2020-2032)
8.6.2 Above 48 V Market Size Estimates and Forecasts to 2032 (USD Billion)
9. Micro Motor Market Segmentation, by Application
9.1 Chapter Overview
9.2 Automotive
9.2.1 Automotive Market Trends Analysis (2020-2032)
9.2.2 Automotive Market Size Estimates and Forecasts to 2032 (USD Billion)
9.3 Industrial Automation
9.3.1 Industrial Automation Market Trends Analysis (2020-2032)
9.3.2 Industrial Automation Market Size Estimates and Forecasts to 2032 (USD Billion)
9.4 Electronic Appliances
9.4.1 Electronic Appliances Market Trends Analysis (2020-2032)
9.4.2 Electronic Appliances Market Size Estimates and Forecasts to 2032 (USD Billion)
9.5 Healthcare
9.5.1 Healthcare Market Trends Analysis (2020-2032)
9.5.2 Healthcare Market Size Estimates and Forecasts to 2032 (USD Billion)
9.6 Aerospace
9.6.1 Aerospace Market Trends Analysis (2020-2032)
9.6.2 Aerospace Market Size Estimates and Forecasts to 2032 (USD Billion)
9.7 Others
9.7.1 Others Market Trends Analysis (2020-2032)
9.7.2 Others Market Size Estimates and Forecasts to 2032 (USD Billion)
10. Regional Analysis
10.1 Chapter Overview
10.2 North America
10.2.1 Trends Analysis
10.2.2 North America Micro Motor Market Estimates and Forecasts, by Country (2020-2032) (USD Billion)
10.2.3 North America Micro Motor Market Estimates and Forecasts, By Type (2020-2032) (USD Billion)
10.2.4 North America Micro Motor Market Estimates and Forecasts, By Power Consumption (2020-2032) (USD Billion)
10.2.5 North America Micro Motor Market Estimates and Forecasts, by Application (2020-2032) (USD Billion)
10.2.6 USA
10.2.6.1 USA Micro Motor Market Estimates and Forecasts, By Type (2020-2032) (USD Billion)
10.2.6.2 USA Micro Motor Market Estimates and Forecasts, By Power Consumption (2020-2032) (USD Billion)
10.2.6.3 USA Micro Motor Market Estimates and Forecasts, by Application (2020-2032) (USD Billion)
10.2.7 Canada
10.2.7.1 Canada Micro Motor Market Estimates and Forecasts, By Type (2020-2032) (USD Billion)
10.2.7.2 Canada Micro Motor Market Estimates and Forecasts, By Power Consumption (2020-2032) (USD Billion)
10.2.7.3 Canada Micro Motor Market Estimates and Forecasts, by Application (2020-2032) (USD Billion)
10.2.8 Mexico
10.2.8.1 Mexico Micro Motor Market Estimates and Forecasts, By Type (2020-2032) (USD Billion)
10.2.8.2 Mexico Micro Motor Market Estimates and Forecasts, By Power Consumption (2020-2032) (USD Billion)
10.2.8.3 Mexico Micro Motor Market Estimates and Forecasts, by Application (2020-2032) (USD Billion)
10.3 Europe
10.3.1 Eastern Europe
10.3.1.1 Trends Analysis
10.3.1.2 Eastern Europe Micro Motor Market Estimates and Forecasts, by Country (2020-2032) (USD Billion)
10.3.1.3 Eastern Europe Micro Motor Market Estimates and Forecasts, By Type (2020-2032) (USD Billion)
10.3.1.4 Eastern Europe Micro Motor Market Estimates and Forecasts, By Power Consumption (2020-2032) (USD Billion)
10.3.1.5 Eastern Europe Micro Motor Market Estimates and Forecasts, by Application (2020-2032) (USD Billion)
10.3.1.6 Poland
10.3.1.6.1 Poland Micro Motor Market Estimates and Forecasts, By Type (2020-2032) (USD Billion)
10.3.1.6.2 Poland Micro Motor Market Estimates and Forecasts, By Power Consumption (2020-2032) (USD Billion)
10.3.1.6.3 Poland Micro Motor Market Estimates and Forecasts, by Application (2020-2032) (USD Billion)
10.3.1.7 Romania
10.3.1.7.1 Romania Micro Motor Market Estimates and Forecasts, By Type (2020-2032) (USD Billion)
10.3.1.7.2 Romania Micro Motor Market Estimates and Forecasts, By Power Consumption (2020-2032) (USD Billion)
10.3.1.7.3 Romania Micro Motor Market Estimates and Forecasts, by Application (2020-2032) (USD Billion)
10.3.1.8 Hungary
10.3.1.8.1 Hungary Micro Motor Market Estimates and Forecasts, By Type (2020-2032) (USD Billion)
10.3.1.8.2 Hungary Micro Motor Market Estimates and Forecasts, By Power Consumption (2020-2032) (USD Billion)
10.3.1.8.3 Hungary Micro Motor Market Estimates and Forecasts, by Application (2020-2032) (USD Billion)
10.3.1.9 Turkey
10.3.1.9.1 Turkey Micro Motor Market Estimates and Forecasts, By Type (2020-2032) (USD Billion)
10.3.1.9.2 Turkey Micro Motor Market Estimates and Forecasts, By Power Consumption (2020-2032) (USD Billion)
10.3.1.9.3 Turkey Micro Motor Market Estimates and Forecasts, by Application (2020-2032) (USD Billion)
10.3.1.10 Rest of Eastern Europe
10.3.1.10.1 Rest of Eastern Europe Micro Motor Market Estimates and Forecasts, By Type (2020-2032) (USD Billion)
10.3.1.10.2 Rest of Eastern Europe Micro Motor Market Estimates and Forecasts, By Power Consumption (2020-2032) (USD Billion)
10.3.1.10.3 Rest of Eastern Europe Micro Motor Market Estimates and Forecasts, by Application (2020-2032) (USD Billion)
10.3.2 Western Europe
10.3.2.1 Trends Analysis
10.3.2.2 Western Europe Micro Motor Market Estimates and Forecasts, by Country (2020-2032) (USD Billion)
10.3.2.3 Western Europe Micro Motor Market Estimates and Forecasts, By Type (2020-2032) (USD Billion)
10.3.2.4 Western Europe Micro Motor Market Estimates and Forecasts, By Power Consumption (2020-2032) (USD Billion)
10.3.2.5 Western Europe Micro Motor Market Estimates and Forecasts, by Application (2020-2032) (USD Billion)
10.3.2.6 Germany
10.3.2.6.1 Germany Micro Motor Market Estimates and Forecasts, By Type (2020-2032) (USD Billion)
10.3.2.6.2 Germany Micro Motor Market Estimates and Forecasts, By Power Consumption (2020-2032) (USD Billion)
10.3.2.6.3 Germany Micro Motor Market Estimates and Forecasts, by Application (2020-2032) (USD Billion)
10.3.2.7 France
10.3.2.7.1 France Micro Motor Market Estimates and Forecasts, By Type (2020-2032) (USD Billion)
10.3.2.7.2 France Micro Motor Market Estimates and Forecasts, By Power Consumption (2020-2032) (USD Billion)
10.3.2.7.3 France Micro Motor Market Estimates and Forecasts, by Application (2020-2032) (USD Billion)
10.3.2.8 UK
10.3.2.8.1 UK Micro Motor Market Estimates and Forecasts, By Type (2020-2032) (USD Billion)
10.3.2.8.2 UK Micro Motor Market Estimates and Forecasts, By Power Consumption (2020-2032) (USD Billion)
10.3.2.8.3 UK Micro Motor Market Estimates and Forecasts, by Application (2020-2032) (USD Billion)
10.3.2.9 Italy
10.3.2.9.1 Italy Micro Motor Market Estimates and Forecasts, By Type (2020-2032) (USD Billion)
10.3.2.9.2 Italy Micro Motor Market Estimates and Forecasts, By Power Consumption (2020-2032) (USD Billion)
10.3.2.9.3 Italy Micro Motor Market Estimates and Forecasts, by Application (2020-2032) (USD Billion)
10.3.2.10 Spain
10.3.2.10.1 Spain Micro Motor Market Estimates and Forecasts, By Type (2020-2032) (USD Billion)
10.3.2.10.2 Spain Micro Motor Market Estimates and Forecasts, By Power Consumption (2020-2032) (USD Billion)
10.3.2.10.3 Spain Micro Motor Market Estimates and Forecasts, by Application (2020-2032) (USD Billion)
10.3.2.11 Netherlands
10.3.2.11.1 Netherlands Micro Motor Market Estimates and Forecasts, By Type (2020-2032) (USD Billion)
10.3.2.11.2 Netherlands Micro Motor Market Estimates and Forecasts, By Power Consumption (2020-2032) (USD Billion)
10.3.2.11.3 Netherlands Micro Motor Market Estimates and Forecasts, by Application (2020-2032) (USD Billion)
10.3.2.12 Switzerland
10.3.2.12.1 Switzerland Micro Motor Market Estimates and Forecasts, By Type (2020-2032) (USD Billion)
10.3.2.12.2 Switzerland Micro Motor Market Estimates and Forecasts, By Power Consumption (2020-2032) (USD Billion)
10.3.2.12.3 Switzerland Micro Motor Market Estimates and Forecasts, by Application (2020-2032) (USD Billion)
10.3.2.13 Austria
10.3.2.13.1 Austria Micro Motor Market Estimates and Forecasts, By Type (2020-2032) (USD Billion)
10.3.2.13.2 Austria Micro Motor Market Estimates and Forecasts, By Power Consumption (2020-2032) (USD Billion)
10.3.2.13.3 Austria Micro Motor Market Estimates and Forecasts, by Application (2020-2032) (USD Billion)
10.3.2.14 Rest of Western Europe
10.3.2.14.1 Rest of Western Europe Micro Motor Market Estimates and Forecasts, By Type (2020-2032) (USD Billion)
10.3.2.14.2 Rest of Western Europe Micro Motor Market Estimates and Forecasts, By Power Consumption (2020-2032) (USD Billion)
10.3.2.14.3 Rest of Western Europe Micro Motor Market Estimates and Forecasts, by Application (2020-2032) (USD Billion)
10.4 Asia-Pacific
10.4.1 Trends Analysis
10.4.2 Asia-Pacific Micro Motor Market Estimates and Forecasts, by Country (2020-2032) (USD Billion)
10.4.3 Asia-Pacific Micro Motor Market Estimates and Forecasts, By Type (2020-2032) (USD Billion)
10.4.4 Asia-Pacific Micro Motor Market Estimates and Forecasts, By Power Consumption (2020-2032) (USD Billion)
10.4.5 Asia-Pacific Micro Motor Market Estimates and Forecasts, by Application (2020-2032) (USD Billion)
10.4.6 China
10.4.6.1 China Micro Motor Market Estimates and Forecasts, By Type (2020-2032) (USD Billion)
10.4.6.2 China Micro Motor Market Estimates and Forecasts, By Power Consumption (2020-2032) (USD Billion)
10.4.6.3 China Micro Motor Market Estimates and Forecasts, by Application (2020-2032) (USD Billion)
10.4.7 India
10.4.7.1 India Micro Motor Market Estimates and Forecasts, By Type (2020-2032) (USD Billion)
10.4.7.2 India Micro Motor Market Estimates and Forecasts, By Power Consumption (2020-2032) (USD Billion)
10.4.7.3 India Micro Motor Market Estimates and Forecasts, by Application (2020-2032) (USD Billion)
10.4.8 Japan
10.4.8.1 Japan Micro Motor Market Estimates and Forecasts, By Type (2020-2032) (USD Billion)
10.4.8.2 Japan Micro Motor Market Estimates and Forecasts, By Power Consumption (2020-2032) (USD Billion)
10.4.8.3 Japan Micro Motor Market Estimates and Forecasts, by Application (2020-2032) (USD Billion)
10.4.9 South Korea
10.4.9.1 South Korea Micro Motor Market Estimates and Forecasts, By Type (2020-2032) (USD Billion)
10.4.9.2 South Korea Micro Motor Market Estimates and Forecasts, By Power Consumption (2020-2032) (USD Billion)
10.4.9.3 South Korea Micro Motor Market Estimates and Forecasts, by Application (2020-2032) (USD Billion)
10.4.10 Vietnam
10.4.10.1 Vietnam Micro Motor Market Estimates and Forecasts, By Type (2020-2032) (USD Billion)
10.4.10.2 Vietnam Micro Motor Market Estimates and Forecasts, By Power Consumption (2020-2032) (USD Billion)
10.4.10.3 Vietnam Micro Motor Market Estimates and Forecasts, by Application (2020-2032) (USD Billion)
10.4.11 Singapore
10.4.11.1 Singapore Micro Motor Market Estimates and Forecasts, By Type (2020-2032) (USD Billion)
10.4.11.2 Singapore Micro Motor Market Estimates and Forecasts, By Power Consumption (2020-2032) (USD Billion)
10.4.11.3 Singapore Micro Motor Market Estimates and Forecasts, by Application (2020-2032) (USD Billion)
10.4.12 Australia
10.4.12.1 Australia Micro Motor Market Estimates and Forecasts, By Type (2020-2032) (USD Billion)
10.4.12.2 Australia Micro Motor Market Estimates and Forecasts, By Power Consumption (2020-2032) (USD Billion)
10.4.12.3 Australia Micro Motor Market Estimates and Forecasts, by Application (2020-2032) (USD Billion)
10.4.13 Rest of Asia-Pacific
10.4.13.1 Rest of Asia-Pacific Micro Motor Market Estimates and Forecasts, By Type (2020-2032) (USD Billion)
10.4.13.2 Rest of Asia-Pacific Micro Motor Market Estimates and Forecasts, By Power Consumption (2020-2032) (USD Billion)
10.4.13.3 Rest of Asia-Pacific Micro Motor Market Estimates and Forecasts, by Application (2020-2032) (USD Billion)
10.5 Middle East and Africa
10.5.1 Middle East
10.5.1.1 Trends Analysis
10.5.1.2 Middle East Micro Motor Market Estimates and Forecasts, by Country (2020-2032) (USD Billion)
10.5.1.3 Middle East Micro Motor Market Estimates and Forecasts, By Type (2020-2032) (USD Billion)
10.5.1.4 Middle East Micro Motor Market Estimates and Forecasts, By Power Consumption (2020-2032) (USD Billion)
10.5.1.5 Middle East Micro Motor Market Estimates and Forecasts, by Application (2020-2032) (USD Billion)
10.5.1.6 UAE
10.5.1.6.1 UAE Micro Motor Market Estimates and Forecasts, By Type (2020-2032) (USD Billion)
10.5.1.6.2 UAE Micro Motor Market Estimates and Forecasts, By Power Consumption (2020-2032) (USD Billion)
10.5.1.6.3 UAE Micro Motor Market Estimates and Forecasts, by Application (2020-2032) (USD Billion)
10.5.1.7 Egypt
10.5.1.7.1 Egypt Micro Motor Market Estimates and Forecasts, By Type (2020-2032) (USD Billion)
10.5.1.7.2 Egypt Micro Motor Market Estimates and Forecasts, By Power Consumption (2020-2032) (USD Billion)
10.5.1.7.3 Egypt Micro Motor Market Estimates and Forecasts, by Application (2020-2032) (USD Billion)
10.5.1.8 Saudi Arabia
10.5.1.8.1 Saudi Arabia Micro Motor Market Estimates and Forecasts, By Type (2020-2032) (USD Billion)
10.5.1.8.2 Saudi Arabia Micro Motor Market Estimates and Forecasts, By Power Consumption (2020-2032) (USD Billion)
10.5.1.8.3 Saudi Arabia Micro Motor Market Estimates and Forecasts, by Application (2020-2032) (USD Billion)
10.5.1.9 Qatar
10.5.1.9.1 Qatar Micro Motor Market Estimates and Forecasts, By Type (2020-2032) (USD Billion)
10.5.1.9.2 Qatar Micro Motor Market Estimates and Forecasts, By Power Consumption (2020-2032) (USD Billion)
10.5.1.9.3 Qatar Micro Motor Market Estimates and Forecasts, by Application (2020-2032) (USD Billion)
10.5.1.10 Rest of Middle East
10.5.1.10.1 Rest of Middle East Micro Motor Market Estimates and Forecasts, By Type (2020-2032) (USD Billion)
10.5.1.10.2 Rest of Middle East Micro Motor Market Estimates and Forecasts, By Power Consumption (2020-2032) (USD Billion)
10.5.1.10.3 Rest of Middle East Micro Motor Market Estimates and Forecasts, by Application (2020-2032) (USD Billion)
10.5.2 Africa
10.5.2.1 Trends Analysis
10.5.2.2 Africa Micro Motor Market Estimates and Forecasts, by Country (2020-2032) (USD Billion)
10.5.2.3 Africa Micro Motor Market Estimates and Forecasts, By Type (2020-2032) (USD Billion)
10.5.2.4 Africa Micro Motor Market Estimates and Forecasts, By Power Consumption (2020-2032) (USD Billion)
10.5.2.5 Africa Micro Motor Market Estimates and Forecasts, by Application (2020-2032) (USD Billion)
10.5.2.6 South Africa
10.5.2.6.1 South Africa Micro Motor Market Estimates and Forecasts, By Type (2020-2032) (USD Billion)
10.5.2.6.2 South Africa Micro Motor Market Estimates and Forecasts, By Power Consumption (2020-2032) (USD Billion)
10.5.2.6.3 South Africa Micro Motor Market Estimates and Forecasts, by Application (2020-2032) (USD Billion)
10.5.2.7 Nigeria
10.5.2.7.1 Nigeria Micro Motor Market Estimates and Forecasts, By Type (2020-2032) (USD Billion)
10.5.2.7.2 Nigeria Micro Motor Market Estimates and Forecasts, By Power Consumption (2020-2032) (USD Billion)
10.5.2.7.3 Nigeria Micro Motor Market Estimates and Forecasts, by Application (2020-2032) (USD Billion)
10.5.2.8 Rest of Africa
10.5.2.8.1 Rest of Africa Micro Motor Market Estimates and Forecasts, By Type (2020-2032) (USD Billion)
10.5.2.8.2 Rest of Africa Micro Motor Market Estimates and Forecasts, By Power Consumption (2020-2032) (USD Billion)
10.5.2.8.3 Rest of Africa Micro Motor Market Estimates and Forecasts, by Application (2020-2032) (USD Billion)
10.6 Latin America
10.6.1 Trends Analysis
10.6.2 Latin America Micro Motor Market Estimates and Forecasts, by Country (2020-2032) (USD Billion)
10.6.3 Latin America Micro Motor Market Estimates and Forecasts, By Type (2020-2032) (USD Billion)
10.6.4 Latin America Micro Motor Market Estimates and Forecasts, By Power Consumption (2020-2032) (USD Billion)
10.6.5 Latin America Micro Motor Market Estimates and Forecasts, by Application (2020-2032) (USD Billion)
10.6.6 Brazil
10.6.6.1 Brazil Micro Motor Market Estimates and Forecasts, By Type (2020-2032) (USD Billion)
10.6.6.2 Brazil Micro Motor Market Estimates and Forecasts, By Power Consumption (2020-2032) (USD Billion)
10.6.6.3 Brazil Micro Motor Market Estimates and Forecasts, by Application (2020-2032) (USD Billion)
10.6.7 Argentina
10.6.7.1 Argentina Micro Motor Market Estimates and Forecasts, By Type (2020-2032) (USD Billion)
10.6.7.2 Argentina Micro Motor Market Estimates and Forecasts, By Power Consumption (2020-2032) (USD Billion)
10.6.7.3 Argentina Micro Motor Market Estimates and Forecasts, by Application (2020-2032) (USD Billion)
10.6.8 Colombia
10.6.8.1 Colombia Micro Motor Market Estimates and Forecasts, By Type (2020-2032) (USD Billion)
10.6.8.2 Colombia Micro Motor Market Estimates and Forecasts, By Power Consumption (2020-2032) (USD Billion)
10.6.8.3 Colombia Micro Motor Market Estimates and Forecasts, by Application (2020-2032) (USD Billion)
10.6.9 Rest of Latin America
10.6.9.1 Rest of Latin America Micro Motor Market Estimates and Forecasts, By Type (2020-2032) (USD Billion)
10.6.9.2 Rest of Latin America Micro Motor Market Estimates and Forecasts, By Power Consumption (2020-2032) (USD Billion)
10.6.9.3 Rest of Latin America Micro Motor Market Estimates and Forecasts, by Application (2020-2032) (USD Billion)
11. Company Profiles
11.1 Nidec Corporation
11.1.1 Company Overview
11.1.2 Financial
11.1.3 Products/ Services Offered
11.1.4 SWOT Analysis
11.2 Mabuchi Motor Co., Ltd.
11.2.1 Company Overview
11.2.2 Financial
11.2.3 Products/ Services Offered
11.2.4 SWOT Analysis
11.3 Johnson Electric Holdings Limited
11.3.1 Company Overview
11.3.2 Financial
11.3.3 Products/ Services Offered
11.3.4 SWOT Analysis
11.4 Maxon Group
11.4.1 Company Overview
11.4.2 Financial
11.4.3 Products/ Services Offered
11.4.4 SWOT Analysis
11.5 Faulhaber Group
11.5.1 Company Overview
11.5.2 Financial
11.5.3 Products/ Services Offered
11.5.4 SWOT Analysis
11.6 ABB Ltd.
11.6.1 Company Overview
11.6.2 Financial
11.6.3 Products/ Services Offered
11.6.4 SWOT Analysis
11.7 Allied Motion Technologies, Inc.
11.7.1 Company Overview
11.7.2 Financial
11.7.3 Products/ Services Offered
11.7.4 SWOT Analysis
11.8 Denso Corporation
11.8.1 Company Overview
11.8.2 Financial
11.8.3 Products/ Services Offered
11.8.4 SWOT Analysis
11.9 Siemens AG
11.9.1 Company Overview
11.9.2 Financial
11.9.3 Products/ Services Offered
11.9.4 SWOT Analysis
11.10 Yaskawa Electric Corporation
11.10.1 Company Overview
11.10.2 Financial
11.10.3 Products/ Services Offered
11.10.4 SWOT Analysis
12. Use Cases and Best Practices
13. Conclusion
An accurate research report requires proper strategizing as well as implementation. There are multiple factors involved in the completion of good and accurate research report and selecting the best methodology to compete the research is the toughest part. Since the research reports we provide play a crucial role in any company’s decision-making process, therefore we at SNS Insider always believe that we should choose the best method which gives us results closer to reality. This allows us to reach at a stage wherein we can provide our clients best and accurate investment to output ratio.
Each report that we prepare takes a timeframe of 350-400 business hours for production. Starting from the selection of titles through a couple of in-depth brain storming session to the final QC process before uploading our titles on our website we dedicate around 350 working hours. The titles are selected based on their current market cap and the foreseen CAGR and growth.
The 5 steps process:
Step 1: Secondary Research:
Secondary Research or Desk Research is as the name suggests is a research process wherein, we collect data through the readily available information. In this process we use various paid and unpaid databases which our team has access to and gather data through the same. This includes examining of listed companies’ annual reports, Journals, SEC filling etc. Apart from this our team has access to various associations across the globe across different industries. Lastly, we have exchange relationships with various university as well as individual libraries.
Step 2: Primary Research
When we talk about primary research, it is a type of study in which the researchers collect relevant data samples directly, rather than relying on previously collected data. This type of research is focused on gaining content specific facts that can be sued to solve specific problems. Since the collected data is fresh and first hand therefore it makes the study more accurate and genuine.
We at SNS Insider have divided Primary Research into 2 parts.
Part 1 wherein we interview the KOLs of major players as well as the upcoming ones across various geographic regions. This allows us to have their view over the market scenario and acts as an important tool to come closer to the accurate market numbers. As many as 45 paid and unpaid primary interviews are taken from both the demand and supply side of the industry to make sure we land at an accurate judgement and analysis of the market.
This step involves the triangulation of data wherein our team analyses the interview transcripts, online survey responses and observation of on filed participants. The below mentioned chart should give a better understanding of the part 1 of the primary interview.
Part 2: In this part of primary research the data collected via secondary research and the part 1 of the primary research is validated with the interviews from individual consultants and subject matter experts.
Consultants are those set of people who have at least 12 years of experience and expertise within the industry whereas Subject Matter Experts are those with at least 15 years of experience behind their back within the same space. The data with the help of two main processes i.e., FGDs (Focused Group Discussions) and IDs (Individual Discussions). This gives us a 3rd party nonbiased primary view of the market scenario making it a more dependable one while collation of the data pointers.
Step 3: Data Bank Validation
Once all the information is collected via primary and secondary sources, we run that information for data validation. At our intelligence centre our research heads track a lot of information related to the market which includes the quarterly reports, the daily stock prices, and other relevant information. Our data bank server gets updated every fortnight and that is how the information which we collected using our primary and secondary information is revalidated in real time.
Step 4: QA/QC Process
After all the data collection and validation our team does a final level of quality check and quality assurance to get rid of any unwanted or undesired mistakes. This might include but not limited to getting rid of the any typos, duplication of numbers or missing of any important information. The people involved in this process include technical content writers, research heads and graphics people. Once this process is completed the title gets uploader on our platform for our clients to read it.
Step 5: Final QC/QA Process:
This is the last process and comes when the client has ordered the study. In this process a final QA/QC is done before the study is emailed to the client. Since we believe in giving our clients a good experience of our research studies, therefore, to make sure that we do not lack at our end in any way humanly possible we do a final round of quality check and then dispatch the study to the client.
Key Segments:
By Type
AC Motor
DC Motor
Brushed
Brushless
By Power Consumption
Below 11V
12-24 V
25-48 V
Above 48 V
By Application
Automotive
Industrial Automation
Electronic Appliances
Healthcare
Aerospace
Others
Request for Segment Customization as per your Business Requirement: Segment Customization Request
REGIONAL COVERAGE:
North America
US
Canada
Mexico
Europe
Eastern Europe
Poland
Romania
Hungary
Turkey
Rest of Eastern Europe
Western Europe
Germany
France
UK
Italy
Spain
Netherlands
Switzerland
Austria
Rest of Western Europe
Asia Pacific
China
India
Japan
South Korea
Vietnam
Singapore
Australia
Rest of Asia Pacific
Middle East & Africa
Middle East
UAE
Egypt
Saudi Arabia
Qatar
Rest of the Middle East
Africa
Nigeria
South Africa
Rest of Africa
Latin America
Brazil
Argentina
Colombia
Request for Country Level Research Report: Country Level Customization Request
Available Customization
With the given market data, SNS Insider offers customization as per the company’s specific needs. The following customization options are available for the report:
Product Analysis
Criss-Cross segment analysis (e.g. Product X Application)
Product Matrix which gives a detailed comparison of the product portfolio of each company
Geographic Analysis
Additional countries in any of the regions
Company Information
Detailed analysis and profiling of additional market players (Up to five)
The Fire Alarm and Detection Market size was valued at USD 34.00 billion in 2023 and is expected to grow to USD 65.18 billion by 2032 and grow at a CAGR of 7.5% over the forecast period of 2024-2032.
Smart Set-Top Box Market Size was valued at USD 32.79 billion in 2023 and is expected to reach USD 66.30 billion by 2031, and grow at a CAGR of 9.2% over the forecast period 2024-2031.
Magnetic Sensor Market Size was valued at USD 4.73 billion in 2023 and is expected to reach USD 9.16 billion by 2032 and grow at a CAGR of 7.65% over the forecast period 2024-2032.
The Crystal Oscillators Market Size was valued at USD 3.35 billion in 2023 and is expected to reach USD 4.07 billion by 2032 and grow at a CAGR of 2.01% over the forecast period 2024-2032.
Humidity Sensors Market size was valued at USD 1299.3 Million in 2023 and is expected to grow to USD 2522.527 Million by 2032 and grow at a CAGR Of 7.65 % over the forecast period of 2024-2032.
The ReRAM Market size was valued at USD 670.73 million in 2023 and is expected to grow to USD 3997.53 million by 2032 and grow at a CAGR of 21.94% over the forecast period of 2024-2032.
Hi! Click one of our member below to chat on Phone