The Micro Fulfillment Market was valued at USD 4.86 billion in 2023 and is expected to reach USD 69.59 billion by 2032, growing at a CAGR of 34.46% over the forecast period 2024-2032. Micro-fulfillment centers aim to maximize capacity utilization by using very limited space in small-scale, urban full-fulfillment centers. Their automation prowess brings down costs due to reduced human input costs & quicker order fulfillment too! Robotics automating tasks like picking and sorting is an obvious contributor, but advanced software and integration of artificial intelligence led to improvements in these metrics by optimizing inventory management, order routing, and demand forecasting. These two together make it much quicker, more accurate, and also flexible in meeting customer requirements. With more than 1,000 micro-fulfillment centers (MFCs) currently spread across the U.S., the state of MFCs is rapidly growing. There are companies like Amazon that have made a radical increase in their robotics-based work, with reports of more than 750,000 robots deployed to their fulfillment center to boost efficiency and cut costs. It is part of a trend of automation. MFCs use shuttle-based and cube-storage technologies and use automated mobile robots (AMRs) for picking and sorting. Such a transition towards automated systems is anticipated to provide hefty savings as well as better delivery duration.
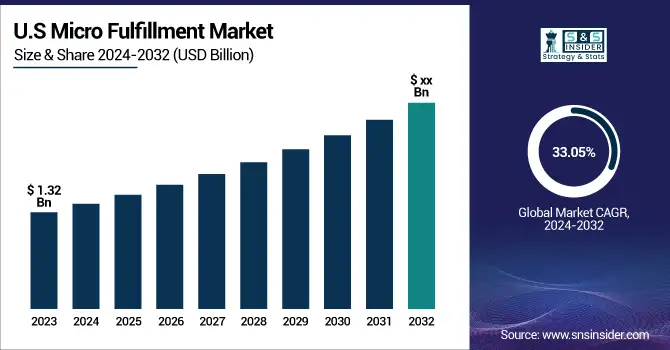
The U.S. Micro Fulfillment Market is estimated to be USD 1.32 billion in 2023 and is projected to grow at a CAGR of 33.05%. The U.S. micro-fulfillment market is expanding, driven primarily by the growing demand for quicker delivery times, escalating e-commerce, and continual advancements in automation technologies. Moving to local, automated warehouses allows your company to fill orders faster and at a lower cost. Consumer demand for ever-faster, same-day deliveries also fuels micro-fulfillment investments.
Key Drivers:
Accelerating Growth of Micro-Fulfillment Centers Driven by E-commerce Demand Automation and Urban Consumer Expectations
Growing demand for faster and more efficient delivery systems, especially in the e-commerce and grocery sectors. The growth of e-commerce has made quick delivery possible, so businesses have invested in micro-fulfillment centers to offer delivery times of just a few hours. Automation, robotics, and AI advancements have also made these centers even more powerful, increasing their speed and accuracy while lowering costs. The increasing expectations from consumers are the need for faster delivery, which triggers the growth spiral of the market, particularly in densely populated urban cities.
Restrain:
Overcoming Last-Mile Logistics Challenges in Micro-Fulfillment with Scalable Technologies and Real-Time Inventory
The last-mile logistics for micro-fulfillment, especially in urban areas, is a highly complex challenge. Quick deliveries entail a tight coupling between fulfilment centres, inventory, and transportation–hard to achieve at scale. Scalable technologies and processes are usually needed for accurate and real-time inventory updates in fast-moving consumer goods or groceries. Other impediments include keeping high automation levels while orders rise and fall, and the lack of an appropriate inventory, which can break efficiencies.
Opportunity:
Unlocking Growth Opportunities in Micro-Fulfillment Through Dark Stores Software Solutions and E-commerce Evolution
There are significant opportunities available in the micro-fulfillment market, especially within dark stores and software solutions. This demand for small-scale, urban fulfillment centers dedicated to logistics offers growth potential for operators to participate in the ever-growing e-grocery and consumer goods sectors. In addition to that, software solutions for warehouse management and automation are becoming indispensable as they can greatly improve the performance and efficiency of these centres. Utilization of services like consulting, cloud, and systems integration is also rising, providing further growth opportunities for service providers. Furthermore, as traditional retailers evolve to e-commerce, they provide additional opportunities for micro-fulfillment models to improve existing distribution and delivery systems.
Challenges:
Overcoming Challenges of Integrating Micro-Fulfillment Centers in Retail Infrastructure Through Strategic Solutions and Partnerships
One such impediment is the addition of a micro-fulfillment center into the current infrastructure of retail. However, the set-up of the average brick-and-mortar outlet or a retailer-owned warehouse cannot be easily reverted to a micro-fulfillment model due to space restrictions, unmatched tech capability, and much-needed change management in culture. Adopting observation-based automation is not an overnight transformation; it requires a change in operations, re-training staff, and piecing together disparate systems, all of which can delay the adoption process. Not to mention, smaller retailers that want to compete in the same playing field as larger e-commerce giants, such as Amazon, that have already created extremely efficient systems for fulfillment. Firms will need creative solutions and strategic partnerships to remove these obstacles and create economies of scale.
By Type
Store-integrated/in-store micro-fulfillment centers dominated the market in 2023 and accounted for a revenue share of 51.2%. Retail dominance by store-based e-fulfillment providers is due in part to the locational efficiencies of operating fulfillment in-store and in part to the fact that most of these providers initially only need to build out their operational capabilities, which allow them to benefit from existing in-store foot traffic at little marginal cost. Such a model is ideal for retailers looking to respond to the demand of fast delivery but do not wish to majorly turn the current operation of their retail core business upside down and out of control, especially in the grocery and e-commerce sectors.
Dark stores will witness the highest CAGR during 2024-2032. Those non-retail, fulfilment-first centers enable the entire fulfilment journey to be automated for ultra-efficient processing of online orders. The trend to dark stores is fueled by an increased need for quicker and cheaper last-mile delivery in cities. Amidst the growth of e-commerce, dark stores provide a scalable solution that can help in delivering products faster, which in turn meets the rising need among consumers for same-day or next-day delivery.
By Component
The micro-fulfillment market was mainly dominated by hardware components, accounting for a share of 47.5% in 2023. By far, this dominance is a result of the enormous dependence on hardware · automation systems, robots, conveyor racks, and so on that are critical for successfully running micro-fulfillment centers. Some of the most crucial hardware solutions required for order fulfillment, increased workflow efficiency, and reduced human intervention are contributing to the growth of the market significantly.
From 2024 to 2032, services are projected to have the highest CAGR. Micro-fulfillment and hyper-local delivery systems are expected to lead to major services such as consulting, integration, and maintenance of complex operating systems, already taking to back-end infrastructures of large-scale e-commerce, write management experts. Fulfillment centers require cloud-based solutions, AI-driven optimization, and end-to-end service harnessing, now more than ever. A growing promotion of these private label offerings suits the customized needs of the customers, has driven the market to ensure the fulfillment of business, and to enhance service scalability.
By End-user
The share of e-commerce in the micro-fulfillment market was 53.7% in 2023. A lot of this is the result of the explosion in e-commerce, with the pandemic only exacerbating the need for speedy, high-performance delivery options. As consumers demand same-day or next-day deliveries across all e-commerce platforms, businesses have to make huge investments in micro-fulfillment centers to maximize the speed and cost-effectiveness of their logistics operations.
The highest CAGR from 2024 to 2032 is anticipated for the traditional retailers & distributors segment. With the move towards omnichannel, where online orders are fulfilled in-store as much as possible, retailers are looking at micro-fulfillment as a supply chain upgrade. By switching, this allows them to increase last-mile delivery efficiency while bringing down their inventory spending. As more retailers move to optimize their logistics to compete with e-commerce, traditional retailers will quickly adopt micro-fulfillments in the coming years.
Regional Analysis
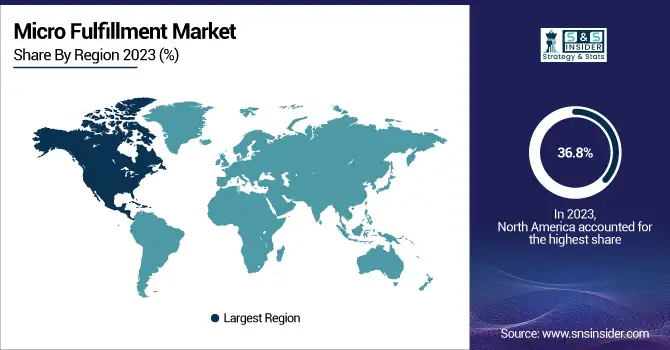
North America led the micro-fulfillment market, holding a share of 36.8% in 2023. The growth of e-commerce and the demand for fast delivery will continue to be the driving force behind the leadership of the region. Similarly, Walmart and Amazon are the ones that invest huge efforts in putting micro-fulfillment centers within urban areas to satisfy the customers who want their goods delivered on the same day or the next day. For example, automation and robotics at fulfillment centers at Amazon speed up order processing, while Walmart is integrating store-based models to simplify the process and improve efficiency. Such investments highlight the region's focus on innovation and technology in logistics.
The Asia Pacific region is anticipated to hold the fastest CAGR from 2024 to 2032 due to rapid urbanization, increasing adoption of e-commerce, and demand for last-mile delivery solutions. Leading the pack are Chinese Alibaba and Japanese Rakuten. Alibaba has unveiled its plans to build “smart warehouses” to optimize the supply chain over the last mile in urban cities, while Rakuten is researching increasingly micro-fulfillment solutions to speed up delivery tasks. High potential territory for micro-fulfillment providers: With booming e-commerce across densely populated countries such as China and India, the Asia Pacific region offers great potential for strengthening demand for efficient micro-fulfillment logistics solutions.
Some of the major players in the Micro Fulfillment Market are:
Takeoff Technologies (Automated Micro Fulfillment Centers),
Fabric (Robotic Fulfillment Solutions),
Locus Robotics (Autonomous Mobile Robots),
Exotec (Skypod System),
Attabotics (3D Robotics System),
Dematic (Automated Storage and Retrieval System),
Swisslog (AutoStore),
GreyOrange (Butler Robots),
Zebra Technologies (Robotic Picking Solutions),
6 River Systems (Chuck Robot),
RightHand Robotics (RightPick),
Vanderlande (Smart Automated Warehouse Solutions),
OCADO Solutions (Ocado Smart Platform),
Honeywell Intelligrated (Automated Conveyor Systems),
Manhattan Associates (Manhattan Active Warehouse Management).
In February 2025, Dematic and Transcend Retail Solutions partnered to enhance grocery picking through advanced micro-fulfillment technologies, aiming to improve productivity and customer experience.
In January 2025, Finland's leading grocery chain, Osuuskauppa Arina, is set to build its third micro-fulfillment center in Oulu with Swisslog, featuring advanced automation systems to double delivery capacity.
Report Attributes | Details |
Market Size in 2023 | USD 4.86 Billion |
Market Size by 2032 | USD 69.59 Billion |
CAGR | CAGR of 34.46% From 2024 to 2032 |
Base Year | 2023 |
Forecast Period | 2024-2032 |
Historical Data | 2020-2022 |
Report Scope & Coverage | Market Size, Segments Analysis, Competitive Landscape, Regional Analysis, DROC & SWOT Analysis, Forecast Outlook |
Key Segments | • By Type (Standalone, Store-integrated/in Store, Dark Stores) • By Component (Hardware, Software, Services) • By End-user (E-commerce, Traditional Retailers & Distributors, Manufacturers) |
Regional Analysis/Coverage | North America (US, Canada, Mexico), Europe (Eastern Europe [Poland, Romania, Hungary, Turkey, Rest of Eastern Europe] Western Europe] Germany, France, UK, Italy, Spain, Netherlands, Switzerland, Austria, Rest of Western Europe]), Asia Pacific (China, India, Japan, South Korea, Vietnam, Singapore, Australia, Rest of Asia Pacific), Middle East & Africa (Middle East [UAE, Egypt, Saudi Arabia, Qatar, Rest of Middle East], Africa [Nigeria, South Africa, Rest of Africa], Latin America (Brazil, Argentina, Colombia, Rest of Latin America) |
Company Profiles | Takeoff Technologies, Fabric, Locus Robotics, Exotec, Attabotics, Dematic, Swisslog, GreyOrange, Zebra Technologies, 6 River Systems, RightHand Robotics, Vanderlande, OCADO Solutions, Honeywell Intelligrated, Manhattan Associates. |
Ans: The Micro Fulfillment Market is expected to grow at a CAGR of 34.46% from 2024-2032.
Ans: The Micro Fulfillment Market size was USD 4.86 billion in 2023 and is expected to reach USD 69.59 billion by 2032.
Ans: The major growth factor of the Micro-Fulfillment Market is the increasing demand for faster, more efficient last-mile delivery solutions driven by e-commerce growth.
Ans: The Store-integrated/in-store segment dominated the Micro Fulfillment Market in 2023.
Ans: North America dominated the Micro Fulfillment Market in 2023.
Table of Contents
1. Introduction
1.1 Market Definition
1.2 Scope (Inclusion and Exclusions)
1.3 Research Assumptions
2. Executive Summary
2.1 Market Overview
2.2 Regional Synopsis
2.3 Competitive Summary
3. Research Methodology
3.1 Top-Down Approach
3.2 Bottom-up Approach
3.3. Data Validation
3.4 Primary Interviews
4. Market Dynamics Impact Analysis
4.1 Market Driving Factors Analysis
4.1.1 Drivers
4.1.2 Restraints
4.1.3 Opportunities
4.1.4 Challenges
4.2 PESTLE Analysis
4.3 Porter’s Five Forces Model
5. Statistical Insights and Trends Reporting
5.1 Micro-Fulfillment Center Capacity Utilization
5.2 Cost-Efficiency and Operational Metrics
5.3 Automation and Robotics in Micro-Fulfillment
5.4 Advanced Software and AI Integration
6. Competitive Landscape
6.1 List of Major Companies, By Region
6.2 Market Share Analysis, By Region
6.3 Product Benchmarking
6.3.1 Product specifications and features
6.3.2 Pricing
6.4 Strategic Initiatives
6.4.1 Marketing and Promotional Activities
6.4.2 Distribution and Supply Chain Strategies
6.4.3 Expansion plans and new product launches
6.4.4 Strategic partnerships and collaborations
6.5 Technological Advancements
6.6 Market Positioning and Branding
7. Micro Fulfillment Market Segmentation, By Type
7.1 Chapter Overview
7.2 Standalone
7.2.1 Standalone Market Trends Analysis (2020-2032)
7.2.2 Standalone Market Size Estimates and Forecasts to 2032 (USD Billion)
7.3 Store-integrated/in Store
7.3.1 Store-integrated/in Store Market Trends Analysis (2020-2032)
7.3.2 Store-integrated/in Store Market Size Estimates and Forecasts to 2032 (USD Billion)
7.4 Dark Stores
7.4.1 Dark Stores Market Trends Analysis (2020-2032)
7.4.2 Dark Stores Market Size Estimates and Forecasts to 2032 (USD Billion)
8. Micro Fulfillment Market Segmentation, By Component
8.1 Chapter Overview
8.2 Hardware
8.2.1 Hardware Market Trends Analysis (2020-2032)
8.2.2 Hardware Market Size Estimates and Forecasts to 2032 (USD Billion)
8.3 Software
8.3.1 Software Market Trends Analysis (2020-2032)
8.3.2 Software Market Size Estimates and Forecasts to 2032 (USD Billion)
8.4 Services
8.4.1 Services Market Trends Analysis (2020-2032)
8.4.2 Services Market Size Estimates and Forecasts to 2032 (USD Billion)
9. Micro Fulfillment Market Segmentation, By End-user
9.1 Chapter Overview
9.2 E-commerce
9.2.1 E-commerce Market Trends Analysis (2020-2032)
9.2.2 E-commerce Market Size Estimates and Forecasts to 2032 (USD Billion)
9.3 Traditional Retailers & Distributors
9.3.1 Traditional Retailers & Distributors Market Trends Analysis (2020-2032)
9.3.2 Traditional Retailers & Distributors Market Size Estimates and Forecasts to 2032 (USD Billion)
9.4 Manufacturers
9.4.1 Manufacturers Market Trends Analysis (2020-2032)
9.4.2 Manufacturers Market Size Estimates and Forecasts to 2032 (USD Billion)
10. Regional Analysis
10.1 Chapter Overview
10.2 North America
10.2.1 Trends Analysis
10.2.2 North America Micro Fulfillment Market Estimates and Forecasts, by Country (2020-2032) (USD Billion)
10.2.3 North America Micro Fulfillment Market Estimates and Forecasts, By Type (2020-2032) (USD Billion)
10.2.4 North America Micro Fulfillment Market Estimates and Forecasts, By Component (2020-2032) (USD Billion)
10.2.5 North America Micro Fulfillment Market Estimates and Forecasts, By End-user (2020-2032) (USD Billion)
10.2.6 USA
10.2.6.1 USA Micro Fulfillment Market Estimates and Forecasts, By Type (2020-2032) (USD Billion)
10.2.6.2 USA Micro Fulfillment Market Estimates and Forecasts, By Component (2020-2032) (USD Billion)
10.2.6.3 USA Micro Fulfillment Market Estimates and Forecasts, By End-user (2020-2032) (USD Billion)
10.2.7 Canada
10.2.7.1 Canada Micro Fulfillment Market Estimates and Forecasts, By Type (2020-2032) (USD Billion)
10.2.7.2 Canada Micro Fulfillment Market Estimates and Forecasts, By Component (2020-2032) (USD Billion)
10.2.7.3 Canada Micro Fulfillment Market Estimates and Forecasts, By End-user (2020-2032) (USD Billion)
10.2.8 Mexico
10.2.8.1 Mexico Micro Fulfillment Market Estimates and Forecasts, By Type (2020-2032) (USD Billion)
10.2.8.2 Mexico Micro Fulfillment Market Estimates and Forecasts, By Component (2020-2032) (USD Billion)
10.2.8.3 Mexico Micro Fulfillment Market Estimates and Forecasts, By End-user (2020-2032) (USD Billion)
10.3 Europe
10.3.1 Eastern Europe
10.3.1.1 Trends Analysis
10.3.1.2 Eastern Europe Micro Fulfillment Market Estimates and Forecasts, by Country (2020-2032) (USD Billion)
10.3.1.3 Eastern Europe Micro Fulfillment Market Estimates and Forecasts, By Type (2020-2032) (USD Billion)
10.3.1.4 Eastern Europe Micro Fulfillment Market Estimates and Forecasts, By Component (2020-2032) (USD Billion)
10.3.1.5 Eastern Europe Micro Fulfillment Market Estimates and Forecasts, By End-user (2020-2032) (USD Billion)
10.3.1.6 Poland
10.3.1.6.1 Poland Micro Fulfillment Market Estimates and Forecasts, By Type (2020-2032) (USD Billion)
10.3.1.6.2 Poland Micro Fulfillment Market Estimates and Forecasts, By Component (2020-2032) (USD Billion)
10.3.1.6.3 Poland Micro Fulfillment Market Estimates and Forecasts, By End-user (2020-2032) (USD Billion)
10.3.1.7 Romania
10.3.1.7.1 Romania Micro Fulfillment Market Estimates and Forecasts, By Type (2020-2032) (USD Billion)
10.3.1.7.2 Romania Micro Fulfillment Market Estimates and Forecasts, By Component (2020-2032) (USD Billion)
10.3.1.7.3 Romania Micro Fulfillment Market Estimates and Forecasts, By End-user (2020-2032) (USD Billion)
10.3.1.8 Hungary
10.3.1.8.1 Hungary Micro Fulfillment Market Estimates and Forecasts, By Type (2020-2032) (USD Billion)
10.3.1.8.2 Hungary Micro Fulfillment Market Estimates and Forecasts, By Component (2020-2032) (USD Billion)
10.3.1.8.3 Hungary Micro Fulfillment Market Estimates and Forecasts, By End-user (2020-2032) (USD Billion)
10.3.1.9 Turkey
10.3.1.9.1 Turkey Micro Fulfillment Market Estimates and Forecasts, By Type (2020-2032) (USD Billion)
10.3.1.9.2 Turkey Micro Fulfillment Market Estimates and Forecasts, By Component (2020-2032) (USD Billion)
10.3.1.9.3 Turkey Micro Fulfillment Market Estimates and Forecasts, By End-user (2020-2032) (USD Billion)
10.3.1.10 Rest of Eastern Europe
10.3.1.10.1 Rest of Eastern Europe Micro Fulfillment Market Estimates and Forecasts, By Type (2020-2032) (USD Billion)
10.3.1.10.2 Rest of Eastern Europe Micro Fulfillment Market Estimates and Forecasts, By Component (2020-2032) (USD Billion)
10.3.1.10.3 Rest of Eastern Europe Micro Fulfillment Market Estimates and Forecasts, By End-user (2020-2032) (USD Billion)
10.3.2 Western Europe
10.3.2.1 Trends Analysis
10.3.2.2 Western Europe Micro Fulfillment Market Estimates and Forecasts, by Country (2020-2032) (USD Billion)
10.3.2.3 Western Europe Micro Fulfillment Market Estimates and Forecasts, By Type (2020-2032) (USD Billion)
10.3.2.4 Western Europe Micro Fulfillment Market Estimates and Forecasts, By Component (2020-2032) (USD Billion)
10.3.2.5 Western Europe Micro Fulfillment Market Estimates and Forecasts, By End-user (2020-2032) (USD Billion)
10.3.2.6 Germany
10.3.2.6.1 Germany Micro Fulfillment Market Estimates and Forecasts, By Type (2020-2032) (USD Billion)
10.3.2.6.2 Germany Micro Fulfillment Market Estimates and Forecasts, By Component (2020-2032) (USD Billion)
10.3.2.6.3 Germany Micro Fulfillment Market Estimates and Forecasts, By End-user (2020-2032) (USD Billion)
10.3.2.7 France
10.3.2.7.1 France Micro Fulfillment Market Estimates and Forecasts, By Type (2020-2032) (USD Billion)
10.3.2.7.2 France Micro Fulfillment Market Estimates and Forecasts, By Component (2020-2032) (USD Billion)
10.3.2.7.3 France Micro Fulfillment Market Estimates and Forecasts, By End-user (2020-2032) (USD Billion)
10.3.2.8 UK
10.3.2.8.1 UK Micro Fulfillment Market Estimates and Forecasts, By Type (2020-2032) (USD Billion)
10.3.2.8.2 UK Micro Fulfillment Market Estimates and Forecasts, By Component (2020-2032) (USD Billion)
10.3.2.8.3 UK Micro Fulfillment Market Estimates and Forecasts, By End-user (2020-2032) (USD Billion)
10.3.2.9 Italy
10.3.2.9.1 Italy Micro Fulfillment Market Estimates and Forecasts, By Type (2020-2032) (USD Billion)
10.3.2.9.2 Italy Micro Fulfillment Market Estimates and Forecasts, By Component (2020-2032) (USD Billion)
10.3.2.9.3 Italy Micro Fulfillment Market Estimates and Forecasts, By End-user (2020-2032) (USD Billion)
10.3.2.10 Spain
10.3.2.10.1 Spain Micro Fulfillment Market Estimates and Forecasts, By Type (2020-2032) (USD Billion)
10.3.2.10.2 Spain Micro Fulfillment Market Estimates and Forecasts, By Component (2020-2032) (USD Billion)
10.3.2.10.3 Spain Micro Fulfillment Market Estimates and Forecasts, By End-user (2020-2032) (USD Billion)
10.3.2.11 Netherlands
10.3.2.11.1 Netherlands Micro Fulfillment Market Estimates and Forecasts, By Type (2020-2032) (USD Billion)
10.3.2.11.2 Netherlands Micro Fulfillment Market Estimates and Forecasts, By Component (2020-2032) (USD Billion)
10.3.2.11.3 Netherlands Micro Fulfillment Market Estimates and Forecasts, By End-user (2020-2032) (USD Billion)
10.3.2.12 Switzerland
10.3.2.12.1 Switzerland Micro Fulfillment Market Estimates and Forecasts, By Type (2020-2032) (USD Billion)
10.3.2.12.2 Switzerland Micro Fulfillment Market Estimates and Forecasts, By Component (2020-2032) (USD Billion)
10.3.2.12.3 Switzerland Micro Fulfillment Market Estimates and Forecasts, By End-user (2020-2032) (USD Billion)
10.3.2.13 Austria
10.3.2.13.1 Austria Micro Fulfillment Market Estimates and Forecasts, By Type (2020-2032) (USD Billion)
10.3.2.13.2 Austria Micro Fulfillment Market Estimates and Forecasts, By Component (2020-2032) (USD Billion)
10.3.2.13.3 Austria Micro Fulfillment Market Estimates and Forecasts, By End-user (2020-2032) (USD Billion)
10.3.2.14 Rest of Western Europe
10.3.2.14.1 Rest of Western Europe Micro Fulfillment Market Estimates and Forecasts, By Type (2020-2032) (USD Billion)
10.3.2.14.2 Rest of Western Europe Micro Fulfillment Market Estimates and Forecasts, By Component (2020-2032) (USD Billion)
10.3.2.14.3 Rest of Western Europe Micro Fulfillment Market Estimates and Forecasts, By End-user (2020-2032) (USD Billion)
10.4 Asia Pacific
10.4.1 Trends Analysis
10.4.2 Asia Pacific Micro Fulfillment Market Estimates and Forecasts, by Country (2020-2032) (USD Billion)
10.4.3 Asia Pacific Micro Fulfillment Market Estimates and Forecasts, By Type (2020-2032) (USD Billion)
10.4.4 Asia Pacific Micro Fulfillment Market Estimates and Forecasts, By Component (2020-2032) (USD Billion)
10.4.5 Asia Pacific Micro Fulfillment Market Estimates and Forecasts, By End-user (2020-2032) (USD Billion)
10.4.6 China
10.4.6.1 China Micro Fulfillment Market Estimates and Forecasts, By Type (2020-2032) (USD Billion)
10.4.6.2 China Micro Fulfillment Market Estimates and Forecasts, By Component (2020-2032) (USD Billion)
10.4.6.3 China Micro Fulfillment Market Estimates and Forecasts, By End-user (2020-2032) (USD Billion)
10.4.7 India
10.4.7.1 India Micro Fulfillment Market Estimates and Forecasts, By Type (2020-2032) (USD Billion)
10.4.7.2 India Micro Fulfillment Market Estimates and Forecasts, By Component (2020-2032) (USD Billion)
10.4.7.3 India Micro Fulfillment Market Estimates and Forecasts, By End-user (2020-2032) (USD Billion)
10.4.8 Japan
10.4.8.1 Japan Micro Fulfillment Market Estimates and Forecasts, By Type (2020-2032) (USD Billion)
10.4.8.2 Japan Micro Fulfillment Market Estimates and Forecasts, By Component (2020-2032) (USD Billion)
10.4.8.3 Japan Micro Fulfillment Market Estimates and Forecasts, By End-user (2020-2032) (USD Billion)
10.4.9 South Korea
10.4.9.1 South Korea Micro Fulfillment Market Estimates and Forecasts, By Type (2020-2032) (USD Billion)
10.4.9.2 South Korea Micro Fulfillment Market Estimates and Forecasts, By Component (2020-2032) (USD Billion)
10.4.9.3 South Korea Micro Fulfillment Market Estimates and Forecasts, By End-user (2020-2032) (USD Billion)
10.4.10 Vietnam
10.4.10.1 Vietnam Micro Fulfillment Market Estimates and Forecasts, By Type (2020-2032) (USD Billion)
10.4.10.2 Vietnam Micro Fulfillment Market Estimates and Forecasts, By Component (2020-2032) (USD Billion)
10.4.10.3 Vietnam Micro Fulfillment Market Estimates and Forecasts, By End-user (2020-2032) (USD Billion)
10.4.11 Singapore
10.4.11.1 Singapore Micro Fulfillment Market Estimates and Forecasts, By Type (2020-2032) (USD Billion)
10.4.11.2 Singapore Micro Fulfillment Market Estimates and Forecasts, By Component (2020-2032) (USD Billion)
10.4.11.3 Singapore Micro Fulfillment Market Estimates and Forecasts, By End-user (2020-2032) (USD Billion)
10.4.12 Australia
10.4.12.1 Australia Micro Fulfillment Market Estimates and Forecasts, By Type (2020-2032) (USD Billion)
10.4.12.2 Australia Micro Fulfillment Market Estimates and Forecasts, By Component (2020-2032) (USD Billion)
10.4.12.3 Australia Micro Fulfillment Market Estimates and Forecasts, By End-user (2020-2032) (USD Billion)
10.4.13 Rest of Asia Pacific
10.4.13.1 Rest of Asia Pacific Micro Fulfillment Market Estimates and Forecasts, By Type (2020-2032) (USD Billion)
10.4.13.2 Rest of Asia Pacific Micro Fulfillment Market Estimates and Forecasts, By Component (2020-2032) (USD Billion)
10.4.13.3 Rest of Asia Pacific Micro Fulfillment Market Estimates and Forecasts, By End-user (2020-2032) (USD Billion)
10.5 Middle East and Africa
10.5.1 Middle East
10.5.1.1 Trends Analysis
10.5.1.2 Middle East Micro Fulfillment Market Estimates and Forecasts, by Country (2020-2032) (USD Billion)
10.5.1.3 Middle East Micro Fulfillment Market Estimates and Forecasts, By Type (2020-2032) (USD Billion)
10.5.1.4 Middle East Micro Fulfillment Market Estimates and Forecasts, By Component (2020-2032) (USD Billion)
10.5.1.5 Middle East Micro Fulfillment Market Estimates and Forecasts, By End-user (2020-2032) (USD Billion)
10.5.1.6 UAE
10.5.1.6.1 UAE Micro Fulfillment Market Estimates and Forecasts, By Type (2020-2032) (USD Billion)
10.5.1.6.2 UAE Micro Fulfillment Market Estimates and Forecasts, By Component (2020-2032) (USD Billion)
10.5.1.6.3 UAE Micro Fulfillment Market Estimates and Forecasts, By End-user (2020-2032) (USD Billion)
10.5.1.7 Egypt
10.5.1.7.1 Egypt Micro Fulfillment Market Estimates and Forecasts, By Type (2020-2032) (USD Billion)
10.5.1.7.2 Egypt Micro Fulfillment Market Estimates and Forecasts, By Component (2020-2032) (USD Billion)
10.5.1.7.3 Egypt Micro Fulfillment Market Estimates and Forecasts, By End-user (2020-2032) (USD Billion)
10.5.1.8 Saudi Arabia
10.5.1.8.1 Saudi Arabia Micro Fulfillment Market Estimates and Forecasts, By Type (2020-2032) (USD Billion)
10.5.1.8.2 Saudi Arabia Micro Fulfillment Market Estimates and Forecasts, By Component (2020-2032) (USD Billion)
10.5.1.8.3 Saudi Arabia Micro Fulfillment Market Estimates and Forecasts, By End-user (2020-2032) (USD Billion)
10.5.1.9 Qatar
10.5.1.9.1 Qatar Micro Fulfillment Market Estimates and Forecasts, By Type (2020-2032) (USD Billion)
10.5.1.9.2 Qatar Micro Fulfillment Market Estimates and Forecasts, By Component (2020-2032) (USD Billion)
10.5.1.9.3 Qatar Micro Fulfillment Market Estimates and Forecasts, By End-user (2020-2032) (USD Billion)
10.5.1.10 Rest of Middle East
10.5.1.10.1 Rest of Middle East Micro Fulfillment Market Estimates and Forecasts, By Type (2020-2032) (USD Billion)
10.5.1.10.2 Rest of Middle East Micro Fulfillment Market Estimates and Forecasts, By Component (2020-2032) (USD Billion)
10.5.1.10.3 Rest of Middle East Micro Fulfillment Market Estimates and Forecasts, By End-user (2020-2032) (USD Billion)
10.5.2 Africa
10.5.2.1 Trends Analysis
10.5.2.2 Africa Micro Fulfillment Market Estimates and Forecasts, by Country (2020-2032) (USD Billion)
10.5.2.3 Africa Micro Fulfillment Market Estimates and Forecasts, By Type (2020-2032) (USD Billion)
10.5.2.4 Africa Micro Fulfillment Market Estimates and Forecasts, By Component (2020-2032) (USD Billion)
10.5.2.5 Africa Micro Fulfillment Market Estimates and Forecasts, By End-user (2020-2032) (USD Billion)
10.5.2.6 South Africa
10.5.2.6.1 South Africa Micro Fulfillment Market Estimates and Forecasts, By Type (2020-2032) (USD Billion)
10.5.2.6.2 South Africa Micro Fulfillment Market Estimates and Forecasts, By Component (2020-2032) (USD Billion)
10.5.2.6.3 South Africa Micro Fulfillment Market Estimates and Forecasts, By End-user (2020-2032) (USD Billion)
10.5.2.7 Nigeria
10.5.2.7.1 Nigeria Micro Fulfillment Market Estimates and Forecasts, By Type (2020-2032) (USD Billion)
10.5.2.7.2 Nigeria Micro Fulfillment Market Estimates and Forecasts, By Component (2020-2032) (USD Billion)
10.5.2.7.3 Nigeria Micro Fulfillment Market Estimates and Forecasts, By End-user (2020-2032) (USD Billion)
10.5.2.8 Rest of Africa
10.5.2.8.1 Rest of Africa Micro Fulfillment Market Estimates and Forecasts, By Type (2020-2032) (USD Billion)
10.5.2.8.2 Rest of Africa Micro Fulfillment Market Estimates and Forecasts, By Component (2020-2032) (USD Billion)
10.5.2.8.3 Rest of Africa Micro Fulfillment Market Estimates and Forecasts, By End-user (2020-2032) (USD Billion)
10.6 Latin America
10.6.1 Trends Analysis
10.6.2 Latin America Micro Fulfillment Market Estimates and Forecasts, by Country (2020-2032) (USD Billion)
10.6.3 Latin America Micro Fulfillment Market Estimates and Forecasts, By Type (2020-2032) (USD Billion)
10.6.4 Latin America Micro Fulfillment Market Estimates and Forecasts, By Component (2020-2032) (USD Billion)
10.6.5 Latin America Micro Fulfillment Market Estimates and Forecasts, By End-user (2020-2032) (USD Billion)
10.6.6 Brazil
10.6.6.1 Brazil Micro Fulfillment Market Estimates and Forecasts, By Type (2020-2032) (USD Billion)
10.6.6.2 Brazil Micro Fulfillment Market Estimates and Forecasts, By Component (2020-2032) (USD Billion)
10.6.6.3 Brazil Micro Fulfillment Market Estimates and Forecasts, By End-user (2020-2032) (USD Billion)
10.6.7 Argentina
10.6.7.1 Argentina Micro Fulfillment Market Estimates and Forecasts, By Type (2020-2032) (USD Billion)
10.6.7.2 Argentina Micro Fulfillment Market Estimates and Forecasts, By Component (2020-2032) (USD Billion)
10.6.7.3 Argentina Micro Fulfillment Market Estimates and Forecasts, By End-user (2020-2032) (USD Billion)
10.6.8 Colombia
10.6.8.1 Colombia Micro Fulfillment Market Estimates and Forecasts, By Type (2020-2032) (USD Billion)
10.6.8.2 Colombia Micro Fulfillment Market Estimates and Forecasts, By Component (2020-2032) (USD Billion)
10.6.8.3 Colombia Micro Fulfillment Market Estimates and Forecasts, By End-user (2020-2032) (USD Billion)
10.6.9 Rest of Latin America
10.6.9.1 Rest of Latin America Micro Fulfillment Market Estimates and Forecasts, By Type (2020-2032) (USD Billion)
10.6.9.2 Rest of Latin America Micro Fulfillment Market Estimates and Forecasts, By Component (2020-2032) (USD Billion)
10.6.9.3 Rest of Latin America Micro Fulfillment Market Estimates and Forecasts, By End-user (2020-2032) (USD Billion)
11. Company Profiles
11.1 Takeoff Technologies.
11.1.1 Company Overview
11.1.2 Financial
11.1.3 Products/ Services Offered
11.1.4 SWOT Analysis
11.2 Fabric.
11.2.1 Company Overview
11.2.2 Financial
11.2.3 Products/ Services Offered
11.2.4 SWOT Analysis
11.3 Locus Robotics.
11.3.1 Company Overview
11.3.2 Financial
11.3.3 Products/ Services Offered
11.3.4 SWOT Analysis
11.4 Exotec.
11.4.1 Company Overview
11.4.2 Financial
11.4.3 Products/ Services Offered
11.4.4 SWOT Analysis
11.5 Attabotics
11.5.1 Company Overview
11.5.2 Financial
11.5.3 Products/ Services Offered
11.5.4 SWOT Analysis
11.6 Dematic
11.6.1 Company Overview
11.6.2 Financial
11.6.3 Products/ Services Offered
11.6.4 SWOT Analysis
11.7 Swisslog.
11.7.1 Company Overview
11.7.2 Financial
11.7.3 Products/ Services Offered
11.7.4 SWOT Analysis
11.8 GreyOrange
11.8.1 Company Overview
11.8.2 Financial
11.8.3 Products/ Services Offered
11.8.4 SWOT Analysis
11.9 Zebra Technologies
11.9.1 Company Overview
11.9.2 Financial
11.9.3 Products/ Services Offered
11.9.4 SWOT Analysis
11.10 6 River Systems
11.10.1 Company Overview
11.10.2 Financial
11.10.3 Products/ Services Offered
11.10.4 SWOT Analysis
12. Use Cases and Best Practices
13. Conclusion
An accurate research report requires proper strategizing as well as implementation. There are multiple factors involved in the completion of good and accurate research report and selecting the best methodology to compete the research is the toughest part. Since the research reports we provide play a crucial role in any company’s decision-making process, therefore we at SNS Insider always believe that we should choose the best method which gives us results closer to reality. This allows us to reach at a stage wherein we can provide our clients best and accurate investment to output ratio.
Each report that we prepare takes a timeframe of 350-400 business hours for production. Starting from the selection of titles through a couple of in-depth brain storming session to the final QC process before uploading our titles on our website we dedicate around 350 working hours. The titles are selected based on their current market cap and the foreseen CAGR and growth.
The 5 steps process:
Step 1: Secondary Research:
Secondary Research or Desk Research is as the name suggests is a research process wherein, we collect data through the readily available information. In this process we use various paid and unpaid databases which our team has access to and gather data through the same. This includes examining of listed companies’ annual reports, Journals, SEC filling etc. Apart from this our team has access to various associations across the globe across different industries. Lastly, we have exchange relationships with various university as well as individual libraries.
Step 2: Primary Research
When we talk about primary research, it is a type of study in which the researchers collect relevant data samples directly, rather than relying on previously collected data. This type of research is focused on gaining content specific facts that can be sued to solve specific problems. Since the collected data is fresh and first hand therefore it makes the study more accurate and genuine.
We at SNS Insider have divided Primary Research into 2 parts.
Part 1 wherein we interview the KOLs of major players as well as the upcoming ones across various geographic regions. This allows us to have their view over the market scenario and acts as an important tool to come closer to the accurate market numbers. As many as 45 paid and unpaid primary interviews are taken from both the demand and supply side of the industry to make sure we land at an accurate judgement and analysis of the market.
This step involves the triangulation of data wherein our team analyses the interview transcripts, online survey responses and observation of on filed participants. The below mentioned chart should give a better understanding of the part 1 of the primary interview.
Part 2: In this part of primary research the data collected via secondary research and the part 1 of the primary research is validated with the interviews from individual consultants and subject matter experts.
Consultants are those set of people who have at least 12 years of experience and expertise within the industry whereas Subject Matter Experts are those with at least 15 years of experience behind their back within the same space. The data with the help of two main processes i.e., FGDs (Focused Group Discussions) and IDs (Individual Discussions). This gives us a 3rd party nonbiased primary view of the market scenario making it a more dependable one while collation of the data pointers.
Step 3: Data Bank Validation
Once all the information is collected via primary and secondary sources, we run that information for data validation. At our intelligence centre our research heads track a lot of information related to the market which includes the quarterly reports, the daily stock prices, and other relevant information. Our data bank server gets updated every fortnight and that is how the information which we collected using our primary and secondary information is revalidated in real time.
Step 4: QA/QC Process
After all the data collection and validation our team does a final level of quality check and quality assurance to get rid of any unwanted or undesired mistakes. This might include but not limited to getting rid of the any typos, duplication of numbers or missing of any important information. The people involved in this process include technical content writers, research heads and graphics people. Once this process is completed the title gets uploader on our platform for our clients to read it.
Step 5: Final QC/QA Process:
This is the last process and comes when the client has ordered the study. In this process a final QA/QC is done before the study is emailed to the client. Since we believe in giving our clients a good experience of our research studies, therefore, to make sure that we do not lack at our end in any way humanly possible we do a final round of quality check and then dispatch the study to the client.
Key Segments:
By Type
Standalone
Store-integrated/in Store
Dark Stores
By Component
Hardware
Software
Services
By End-user
E-commerce
Traditional Retailers & Distributors
Manufacturers
Request for Segment Customization as per your Business Requirement: Segment Customization Request
Regional Coverage:
North America
US
Canada
Mexico
Europe
Eastern Europe
Poland
Romania
Hungary
Turkey
Rest of Eastern Europe
Western Europe
Germany
France
UK
Italy
Spain
Netherlands
Switzerland
Austria
Rest of Western Europe
Asia Pacific
China
India
Japan
South Korea
Vietnam
Singapore
Australia
Rest of Asia Pacific
Middle East & Africa
Middle East
UAE
Egypt
Saudi Arabia
Qatar
Rest of Middle East
Africa
Nigeria
South Africa
Rest of Africa
Latin America
Brazil
Argentina
Colombia
Rest of Latin America
Request for Country Level Research Report: Country Level Customization Request
Available Customization
With the given market data, SNS Insider offers customization as per the company’s specific needs. The following customization options are available for the report:
Detailed Volume Analysis
Criss-Cross segment analysis (e.g. Product X Application)
Competitive Product Benchmarking
Geographic Analysis
Additional countries in any of the regions
Customized Data Representation
Detailed analysis and profiling of additional market players
The Commercial Printing Market Size was valued at USD 524.92 Billion in 2023 and is expected to grow at 2.59% CAGR to reach USD 659.39 Billion by 2032
The Gas Sensor Market was valued at USD 1.9 Billion in 2023 and is expected to reach USD 4.2 Billion by 2032, growing at a CAGR of 9.05% from 2024-2032.
The Semiconductor Back-End Equipment Market Size was valued at USD 17.32 Billion in 2023 and is expected to grow at a CAGR of 8.76% by 2032.
The Nanowire Battery Market was valued at USD 76.39 million in 2023 and is expected to reach USD 1111.61 million by 2032, growing at a CAGR of 34.71% over the forecast period 2024-2032.
The Autonomous Last Mile Delivery Market size was valued at USD 1.10 Billion in 2023. It is estimated to reach USD 7.10 Billion by 2032, growing at a CAGR of 23.06% during 2024-2032.
The Blockchain Devices Market Size was valued at USD 0.90 Billion in 2023 and is expected to grow at a CAGR of 38.44% to reach USD 16.81 Billion by 2032.
Hi! Click one of our member below to chat on Phone