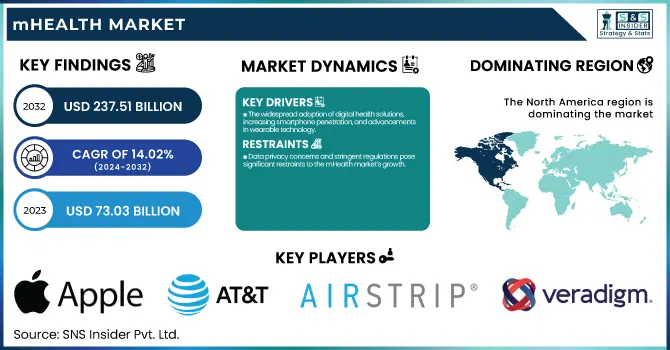
The mHealth Market was valued at USD 73.03 billion in 2023 and is expected to reach USD 237.51 billion by 2032, growing at a CAGR of 14.02% over the forecast period of 2024-2032. This report showcases user adoption and engagement patterns by region driven by rising smartphone penetration, digital health literacy, and regulatory facilitation of telemedicine. Prescription and usage patterns of mHealth solutions are studied where healthcare practitioners incorporated mobile apps in managing chronic diseases and remote monitoring of patients. Furthermore, it delves into wearable devices and mobile health application adoption, with AI analytics advances and real-time health monitoring driving market growth. mHealth expenditure in healthcare is examined by region, with private, commercial, and government investments influencing affordability and accessibility.
Get More Information on mHealth Market - Request Sample Report
The U.S. mHealth Market was valued at USD 21.52 billion in 2023 and is expected to reach USD 63.28 billion by 2032, growing at a CAGR of 12.75% over the forecast period of 2024-2032. The U.S. is experiencing a high-growth mHealth market on the back of enhanced telehealth usage, heightened digital health services' reimbursement policies, and aggressive investment in AI-backed remote monitoring offerings to boost the quality of care and contain medical expenses.
Market Dynamics
Drivers
The widespread adoption of digital health solutions, increasing smartphone penetration, and advancements in wearable technology.
With more than 6.8 billion smartphone users worldwide, mobile health apps have emerged as an important self-health management tool, remote consultation tool, and chronic disease monitoring tool. The increasing popularity of AI-based diagnostic tools and telemedicine platforms is also accelerating market growth. For instance, AI-based health chatbots and virtual assistants such as Babylon Health and Ada Health are facilitating patient engagement and diagnosis. The growing incidence of chronic diseases like diabetes and cardiovascular diseases has become a driving factor for remote patient monitoring solutions. In 2023, over 537 million adults worldwide lived with diabetes, further emphasizing the need for digital health management solutions. The interoperability of mHealth platforms with EHRs has also facilitated access to patient data and instant healthcare decision-making. Government efforts to encourage digital health, including the FDA's Digital Health Innovation Action Plan, also contribute to market expansion. The rollout of 5G networks is also a major impetus, optimizing the efficiency of telehealth services through low-latency, high-speed connectivity for smooth video consultations and remote diagnosis, increasing mHealth accessibility and efficacy.
Restraints
Data privacy concerns and stringent regulations pose significant restraints to the mHealth market’s growth.
The growing dependency on electronic health solutions creates fears about breaches in data and illegal entry into confidential patient data. A total of more than 133 million health records were leaked in cyberattacks in 2023, projecting the vulnerability of electronic health platforms. Most users are reluctant to embrace mHealth apps owing to threats of data leakage and noncompliance with international data protection legislation, including HIPAA (United States), GDPR (Europe), and PDPA (Asia). Regulatory issues further hinder mHealth solution adoption because digital health apps must comply with complicated and changing healthcare regulations. For example, the FDA's clearance of mobile medical applications is slow and costly, and it can inhibit the speedy roll-out of novel solutions. Secondly, most developing nations do not have uniform mHealth regulatory mechanisms, resulting in variations in the compliance process. The interoperability of mHealth solutions with installed healthcare IT systems is also an issue, given that hospitals and clinics use varying electronic health record (EHR) systems, causing integration challenges. These factors all impede market growth and retard the mass adoption of mobile health technologies.
Opportunities
The growing integration of AI, big data, and remote patient monitoring (RPM) technologies in mHealth presents vast opportunities for market expansion.
AI-based diagnostics and customized health guidance are revolutionizing healthcare delivery through the improvement of early disease diagnosis and preventive treatments. For instance, AI-based applications such as SkinVision support the early detection of skin cancer, which has drastically improved patient outcomes. The expansion of RPM technology, particularly in chronic condition management such as hypertension and diabetes, is another substantial opportunity. Remote patient monitoring has been effective in preventing hospital readmissions and long-term patient improvements. Research by the American Heart Association discovered that RPM lowered hospitalization rates among heart failure patients by 38%. Furthermore, collaborations between health providers and technology giants are pushing innovation. Tech companies such as Apple, Google, and Amazon are heavily investing in digital health, with examples like Apple's HealthKit and Google's integration with Fitbit making mHealth solutions more readily available. The increasing emphasis on patient-centric healthcare models and personalized medicine is also driving the demand for telehealth services and AI-led insights. Increased healthcare applications through 5G also augment the opportunities by supporting real-time remote monitoring and effective virtual consultations with minimal latency.
Challenges
The lack of digital literacy and inadequate healthcare infrastructure, particularly in low- and middle-income countries.
As smartphone penetration expands, few consumers, particularly elderly and rural citizens, are too technologically incompetent to leverage mHealth tools. Research by the WHO established that more than 35% of the older population fails to embrace digital health solutions as a result of issues. Other inhibiting factors against market growth are poor internet connections and inadequate availability of inexpensive smart devices in far-flung areas. In addition, most developing countries also lack adequate numbers of skilled healthcare workers properly trained to adopt and coordinate mHealth solutions efficiently. Without training, healthcare workers can resist embracing digital tools, so their full potential in enhancing patient results will not be utilized. Additionally, the urban-rural digital divide issue persists. As much as urban places enjoy fast-speed internet and modern digital health infrastructure, rural places lack basic connections, rendering telemedicine and remote patient monitoring a luxury. Redressing these deficits calls for the intervention of governments, public-private collaborations, and investments in digital health training to address the disparities and provide universal access to mHealth solutions.
By Component
The mHealth Apps category led the market in 2023, capturing 48.9% of the overall revenue share. The extensive use of mobile health applications is driven by rising smartphone penetration, the surge in demand for remote healthcare, and the use of AI-based health monitoring platforms. The ease of real-time monitoring, drug reminders, and virtual consultations has also boosted the growth of the segment.
The mHealth Services segment is anticipated to grow the fastest between 2024 and 2032. Growth in demand for telemedicine, remote patient monitoring, and digital health consulting services is propelling its high growth. Greater investments in digital infrastructure and government efforts in promoting virtual access to healthcare are major drivers of this growth.
By End-use
The Patient segment contributed the highest share in 2023, boosted by a very high rate of adoption of mobile health solutions by consumers. Awareness of self-health management, growth in cases of chronic diseases, and increased usage of digital healthcare solutions by patients have all propelled it to market leadership. mHealth apps and wearable devices have also been enabled to empower consumers with real-time health information and remote consultations. The patient segment is also likely to experience the fastest growth between 2024 and 2032. Growth of consumer-oriented healthcare models, combined with the growing trend towards personalized and preventive care, is driving adoption at a faster pace. Additionally, increasing smartphone penetration and improved access to mobile-based healthcare solutions are among the most influential factors driving the segment's aggressive growth.
Regional Analysis
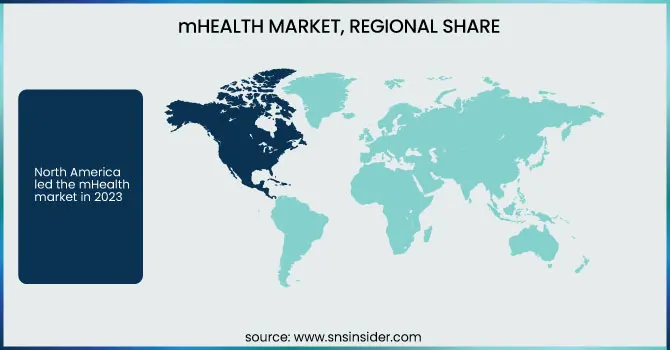
North America led the mHealth market in 2023 due to extensive smartphone penetration, extensive use of telemedicine, and robust healthcare infrastructure. The presence of key players in digital health, such as Apple, Google, and Teladoc Health, has heavily fueled market growth. The U.S. dominates digital health investments, with more than USD 15 billion of funding for health tech startups in 2023, driving innovations in AI-powered diagnostics, remote monitoring, and digital therapeutics. Government efforts, including the FDA's Digital Health Center of Excellence, also drive market growth by facilitating regulatory pathways for mobile health solutions.
The Asia-Pacific region is the most rapidly growing market, expected to grow extensively as a result of smartphone adoption, rising digital literacy, and health digitization programs led by governments. China and India together have more than 2 billion smartphone users and are experiencing rapid growth in mHealth adoption, especially in teleconsultation services and remote patient monitoring. The Indian Ayushman Bharat Digital Mission (ABDM) and China's Healthy China 2030 initiative are fueling digital health infrastructure. Also, increasing healthcare expenses and the lack of medical personnel in rural regions are compelling governments to embrace mobile health solutions for broader healthcare access. The rapid urbanization of the region and the growing emphasis on AI-based healthcare solutions also drive market growth.
Get Customized Report as per Your Business Requirement - Enquiry Now
Apple, Inc. – Apple Health, Apple Watch, HealthKit
AT&T Intellectual Property – AT&T mHealth Solutions, AT&T Connected Health
AirStrip Technologies, Inc. – AirStrip ONE, AirStrip RPM
Veradigm LLC (formerly Allscripts Healthcare Solutions) – Veradigm EHR, Veradigm FollowMyHealth
Qualcomm Technologies, Inc. – Qualcomm 2net, Qualcomm HealthyCircles
Vodafone Group PLC – Vodafone Health Solutions, mHealth Connect
Google LLC – Google Fit, Fitbit Health Solutions, Google Health
Telefonica S.A. – Movistar Salud, Telefonica Telemedicine Solutions
SoftServe, Inc. – SoftServe Digital Health Platform, SoftServe mHealth Solutions
Samsung Electronics Co., Ltd. – Samsung Health, Galaxy Watch Health Features
Orange – Orange mHealth Solutions, Future4Care Digital Health Hub
SeekMed – SeekMed Telemedicine Platform, SeekMed Virtual Consultation
Recent Developments
In May 2024, the Novo Nordisk Foundation, Wellcome Trust, and Gates Foundation launched a USD 300 million global health partnership to tackle major health challenges affecting low-income communities. The three-year initiative will focus on climate-related health impacts, infectious diseases, antimicrobial resistance, and the link between nutrition, immunity, and disease outcomes.
| Report Attributes | Details |
| Market Size in 2023 | USD 73.03 billion |
| Market Size by 2032 | USD 237.51 billion |
| CAGR | CAGR of 14.02% From 2024 to 2032 |
| Base Year | 2023 |
| Forecast Period | 2024-2032 |
| Historical Data | 2020-2022 |
| Report Scope & Coverage | Market Size, Segments Analysis, Competitive Landscape, Regional Analysis, DROC & SWOT Analysis, Forecast Outlook |
| Key Segments | • By Component [Wearables & Connected Medical Devices, mHealth Apps, Services] • By End-Use [Patients, Providers, Payers, Others] |
| Regional Analysis/Coverage | North America (US, Canada, Mexico), Europe (Eastern Europe [Poland, Romania, Hungary, Turkey, Rest of Eastern Europe] Western Europe] Germany, France, UK, Italy, Spain, Netherlands, Switzerland, Austria, Rest of Western Europe]), Asia Pacific (China, India, Japan, South Korea, Vietnam, Singapore, Australia, Rest of Asia Pacific), Middle East & Africa (Middle East [UAE, Egypt, Saudi Arabia, Qatar, Rest of Middle East], Africa [Nigeria, South Africa, Rest of Africa], Latin America (Brazil, Argentina, Colombia, Rest of Latin America) |
| Company Profiles | Apple, Inc., AT&T Intellectual Property, AirStrip Technologies, Inc., Veradigm LLC (formerly Allscripts Healthcare Solutions), Qualcomm Technologies, Inc., Vodafone Group PLC, Google, LLC, Telefonica S.A., SoftServe, Inc., Samsung Electronics Co., Ltd., Orange, SeekMed. |
Ans: The mHealth Market is expected to grow at a CAGR of 14.02 %.
Ans: The mHealth Market was valued at USD 73.03 billion in 2023 and is expected to reach USD 237.51 billion by 2032, growing at a CAGR of 14.02% over the forecast period of 2024-2032.
Ans: The rise in use of mobile phones and technology in the emerging and the developed countries
Ans: For healthcare data and technology, different areas and nations have different laws and requirements. It can be difficult for mHealth app developers and healthcare providers to manoeuvre through these complicated regulatory settings.
Ans: North America overtook other regional markets as the largest market for mHealth, with the highest revenue share.
Table of contents
1. Introduction
1.1 Market Definition
1.2 Scope (Inclusion and Exclusions)
1.3 Research Assumptions
2. Executive Summary
2.1 Market Overview
2.2 Regional Synopsis
2.3 Competitive Summary
3. Research Methodology
3.1 Top-Down Approach
3.2 Bottom-up Approach
3.3. Data Validation
3.4 Primary Interviews
4. Market Dynamics Impact Analysis
4.1 Market Driving Factors Analysis
4.1.2 Drivers
4.1.2 Restraints
4.1.3 Opportunities
4.1.4 Challenges
4.2 PESTLE Analysis
4.3 Porter’s Five Forces Model
5. Statistical Insights and Trends Reporting
5.1 User Adoption and Engagement Trends (2023), by Region
5.2 Prescription and Usage Trends of mHealth Solutions (2023), by Region
5.3 Wearable Device and Mobile App Adoption, by Region (2020-2032)
5.4 Healthcare Spending on mHealth, by Region (Government, Commercial, Private, Out-of-Pocket), 2023
6. Competitive Landscape
6.1 List of Major Companies, By Region
6.2 Market Share Analysis, By Region
6.3 Service Benchmarking
6.3.1 Service specifications and features
6.3.2 Pricing
6.4 Strategic Initiatives
6.4.1 Marketing and promotional activities
6.4.2 Distribution and Supply Chain Strategies
6.4.3 Expansion plans and new Service launches
6.4.4 Strategic partnerships and collaborations
6.5 Technological Advancements
6.6 Market Positioning and Branding
7. mHealth Market Segmentation, by Component
7.1 Chapter Overview
7.2 Wearables & Connected Medical Devices
7.2.1 Wearables & Connected Medical Devices Market Trends Analysis (2020-2032)
7.2.2 Wearables & Connected Medical Devices Market Size Estimates and Forecasts to 2032 (USD Billion)
7.3 mHealth Apps
7.3.1 mHealth Apps Market Trends Analysis (2020-2032)
7.3.2 mHealth Apps Market Size Estimates and Forecasts to 2032 (USD Billion)
7.4 Services
7.4.1 Services Market Trends Analysis (2020-2032)
7.4.2 Services Market Size Estimates and Forecasts to 2032 (USD Billion)
8. mHealth Market Segmentation, by End-Use
8.1 Chapter Overview
8.2 Patients
8.2.1 Patients Market Trends Analysis (2020-2032)
8.2.2 Patients Market Size Estimates and Forecasts to 2032 (USD Billion)
8.3 Providers
8.3.1 Providers Market Trends Analysis (2020-2032)
8.3.2 Providers Market Size Estimates and Forecasts to 2032 (USD Billion)
8.4 Payers
8.4.1 Payers Market Trends Analysis (2020-2032)
8.4.2 Payers Market Size Estimates and Forecasts to 2032 (USD Billion)
8.5 Others
8.5.1 Others Market Trends Analysis (2020-2032)
8.5.2 Others Market Size Estimates and Forecasts to 2032 (USD Billion)
9. Regional Analysis
9.1 Chapter Overview
9.2 North America
9.2.1 Trends Analysis
9.2.2 North America mHealth Market Estimates and Forecasts, by Country (2020-2032) (USD Billion)
9.2.3 North America mHealth Market Estimates and Forecasts, by Component (2020-2032) (USD Billion)
9.2.4 North America mHealth Market Estimates and Forecasts, by End-Use (2020-2032) (USD Billion)
9.2.5 USA
9.2.5.1 USA mHealth Market Estimates and Forecasts, by Component (2020-2032) (USD Billion)
9.2.5.2 USA mHealth Market Estimates and Forecasts, by End-Use (2020-2032) (USD Billion)
9.2.6 Canada
9.2.6.1 Canada mHealth Market Estimates and Forecasts, by Component (2020-2032) (USD Billion)
9.2.6.2 Canada mHealth Market Estimates and Forecasts, by End-Use (2020-2032) (USD Billion)
9.2.7 Mexico
9.2.7.1 Mexico mHealth Market Estimates and Forecasts, by Component (2020-2032) (USD Billion)
9.2.7.2 Mexico mHealth Market Estimates and Forecasts, by End-Use (2020-2032) (USD Billion)
9.3 Europe
9.3.1 Eastern Europe
9.3.1.1 Trends Analysis
9.3.1.2 Eastern Europe mHealth Market Estimates and Forecasts, by Country (2020-2032) (USD Billion)
9.3.1.3 Eastern Europe mHealth Market Estimates and Forecasts, by Component (2020-2032) (USD Billion)
9.3.1.4 Eastern Europe mHealth Market Estimates and Forecasts, by End-Use (2020-2032) (USD Billion)
9.3.1.5 Poland
9.3.1.5.1 Poland mHealth Market Estimates and Forecasts, by Component (2020-2032) (USD Billion)
9.3.1.5.2 Poland mHealth Market Estimates and Forecasts, by End-Use (2020-2032) (USD Billion)
9.3.1.6 Romania
9.3.1.6.1 Romania mHealth Market Estimates and Forecasts, by Component (2020-2032) (USD Billion)
9.3.1.6.2 Romania mHealth Market Estimates and Forecasts, by End-Use (2020-2032) (USD Billion)
9.3.1.7 Hungary
9.3.1.7.1 Hungary mHealth Market Estimates and Forecasts, by Component (2020-2032) (USD Billion)
9.3.1.7.2 Hungary mHealth Market Estimates and Forecasts, by End-Use (2020-2032) (USD Billion)
9.3.1.8 Turkey
9.3.1.8.1 Turkey mHealth Market Estimates and Forecasts, by Component (2020-2032) (USD Billion)
9.3.1.8.2 Turkey mHealth Market Estimates and Forecasts, by End-Use (2020-2032) (USD Billion)
9.3.1.9 Rest of Eastern Europe
9.3.1.9.1 Rest of Eastern Europe mHealth Market Estimates and Forecasts, by Component (2020-2032) (USD Billion)
9.3.1.9.2 Rest of Eastern Europe mHealth Market Estimates and Forecasts, by End-Use (2020-2032) (USD Billion)
9.3.2 Western Europe
9.3.2.1 Trends Analysis
9.3.2.2 Western Europe mHealth Market Estimates and Forecasts, by Country (2020-2032) (USD Billion)
9.3.2.3 Western Europe mHealth Market Estimates and Forecasts, by Component (2020-2032) (USD Billion)
9.3.2.4 Western Europe mHealth Market Estimates and Forecasts, by End-Use (2020-2032) (USD Billion)
9.3.2.5 Germany
9.3.2.5.1 Germany mHealth Market Estimates and Forecasts, by Component (2020-2032) (USD Billion)
9.3.2.5.2 Germany mHealth Market Estimates and Forecasts, by End-Use (2020-2032) (USD Billion)
9.3.2.6 France
9.3.2.6.1 France mHealth Market Estimates and Forecasts, by Component (2020-2032) (USD Billion)
9.3.2.6.2 France mHealth Market Estimates and Forecasts, by End-Use (2020-2032) (USD Billion)
9.3.2.7 UK
9.3.2.7.1 UK mHealth Market Estimates and Forecasts, by Component (2020-2032) (USD Billion)
9.3.2.7.2 UK mHealth Market Estimates and Forecasts, by End-Use (2020-2032) (USD Billion)
9.3.2.8 Italy
9.3.2.8.1 Italy mHealth Market Estimates and Forecasts, by Component (2020-2032) (USD Billion)
9.3.2.8.2 Italy mHealth Market Estimates and Forecasts, by End-Use (2020-2032) (USD Billion)
9.3.2.9 Spain
9.3.2.9.1 Spain mHealth Market Estimates and Forecasts, by Component (2020-2032) (USD Billion)
9.3.2.9.2 Spain mHealth Market Estimates and Forecasts, by End-Use (2020-2032) (USD Billion)
9.3.2.10 Netherlands
9.3.2.10.1 Netherlands mHealth Market Estimates and Forecasts, by Component (2020-2032) (USD Billion)
9.3.2.10.2 Netherlands mHealth Market Estimates and Forecasts, by End-Use (2020-2032) (USD Billion)
9.3.2.11 Switzerland
9.3.2.11.1 Switzerland mHealth Market Estimates and Forecasts, by Component (2020-2032) (USD Billion)
9.3.2.11.2 Switzerland mHealth Market Estimates and Forecasts, by End-Use (2020-2032) (USD Billion)
9.3.2.12 Austria
9.3.2.12.1 Austria mHealth Market Estimates and Forecasts, by Component (2020-2032) (USD Billion)
9.3.2.12.2 Austria mHealth Market Estimates and Forecasts, by End-Use (2020-2032) (USD Billion)
9.3.2.13 Rest of Western Europe
9.3.2.13.1 Rest of Western Europe mHealth Market Estimates and Forecasts, by Component (2020-2032) (USD Billion)
9.3.2.13.2 Rest of Western Europe mHealth Market Estimates and Forecasts, by End-Use (2020-2032) (USD Billion)
9.4 Asia Pacific
9.4.1 Trends Analysis
9.4.2 Asia Pacific mHealth Market Estimates and Forecasts, by Country (2020-2032) (USD Billion)
9.4.3 Asia Pacific mHealth Market Estimates and Forecasts, by Component (2020-2032) (USD Billion)
9.4.4 Asia Pacific mHealth Market Estimates and Forecasts, by End-Use (2020-2032) (USD Billion)
9.4.5 China
9.4.5.1 China mHealth Market Estimates and Forecasts, by Component (2020-2032) (USD Billion)
9.4.5.2 China mHealth Market Estimates and Forecasts, by End-Use (2020-2032) (USD Billion)
9.4.6 India
9.4.5.1 India mHealth Market Estimates and Forecasts, by Component (2020-2032) (USD Billion)
9.4.5.2 India mHealth Market Estimates and Forecasts, by End-Use (2020-2032) (USD Billion)
9.4.5 Japan
9.4.5.1 Japan mHealth Market Estimates and Forecasts, by Component (2020-2032) (USD Billion)
9.4.5.2 Japan mHealth Market Estimates and Forecasts, by End-Use (2020-2032) (USD Billion)
9.4.6 South Korea
9.4.6.1 South Korea mHealth Market Estimates and Forecasts, by Component (2020-2032) (USD Billion)
9.4.6.2 South Korea mHealth Market Estimates and Forecasts, by End-Use (2020-2032) (USD Billion)
9.4.7 Vietnam
9.4.7.1 Vietnam mHealth Market Estimates and Forecasts, by Component (2020-2032) (USD Billion)
9.2.7.2 Vietnam mHealth Market Estimates and Forecasts, by End-Use (2020-2032) (USD Billion)
9.4.8 Singapore
9.4.8.1 Singapore mHealth Market Estimates and Forecasts, by Component (2020-2032) (USD Billion)
9.4.8.2 Singapore mHealth Market Estimates and Forecasts, by End-Use (2020-2032) (USD Billion)
9.4.9 Australia
9.4.9.1 Australia mHealth Market Estimates and Forecasts, by Component (2020-2032) (USD Billion)
9.4.9.2 Australia mHealth Market Estimates and Forecasts, by End-Use (2020-2032) (USD Billion)
9.4.10 Rest of Asia Pacific
9.4.10.1 Rest of Asia Pacific mHealth Market Estimates and Forecasts, by Component (2020-2032) (USD Billion)
9.4.10.2 Rest of Asia Pacific mHealth Market Estimates and Forecasts, by End-Use (2020-2032) (USD Billion)
9.5 Middle East and Africa
9.5.1 Middle East
9.5.1.1 Trends Analysis
9.5.1.2 Middle East mHealth Market Estimates and Forecasts, by Country (2020-2032) (USD Billion)
9.5.1.3 Middle East mHealth Market Estimates and Forecasts, by Component (2020-2032) (USD Billion)
9.5.1.4 Middle East mHealth Market Estimates and Forecasts, by End-Use (2020-2032) (USD Billion)
9.5.1.5 UAE
9.5.1.5.1 UAE mHealth Market Estimates and Forecasts, by Component (2020-2032) (USD Billion)
9.5.1.5.2 UAE mHealth Market Estimates and Forecasts, by End-Use (2020-2032) (USD Billion)
9.5.1.6 Egypt
9.5.1.6.1 Egypt mHealth Market Estimates and Forecasts, by Component (2020-2032) (USD Billion)
9.5.1.6.2 Egypt mHealth Market Estimates and Forecasts, by End-Use (2020-2032) (USD Billion)
9.5.1.7 Saudi Arabia
9.5.1.7.1 Saudi Arabia mHealth Market Estimates and Forecasts, by Component (2020-2032) (USD Billion)
9.5.1.7.2 Saudi Arabia mHealth Market Estimates and Forecasts, by End-Use (2020-2032) (USD Billion)
9.5.1.8 Qatar
9.5.1.8.1 Qatar mHealth Market Estimates and Forecasts, by Component (2020-2032) (USD Billion)
9.5.1.8.2 Qatar mHealth Market Estimates and Forecasts, by End-Use (2020-2032) (USD Billion)
9.5.1.9 Rest of Middle East
9.5.1.9.1 Rest of Middle East mHealth Market Estimates and Forecasts, by Component (2020-2032) (USD Billion)
9.5.1.9.2 Rest of Middle East mHealth Market Estimates and Forecasts, by End-Use (2020-2032) (USD Billion)
9.5.2 Africa
9.5.2.1 Trends Analysis
9.5.2.2 Africa mHealth Market Estimates and Forecasts, by Country (2020-2032) (USD Billion)
9.5.2.3 Africa mHealth Market Estimates and Forecasts, by Component (2020-2032) (USD Billion)
9.5.2.4 Africa mHealth Market Estimates and Forecasts, by End-Use (2020-2032) (USD Billion)
9.5.2.5 South Africa
9.5.2.5.1 South Africa mHealth Market Estimates and Forecasts, by Component (2020-2032) (USD Billion)
9.5.2.5.2 South Africa mHealth Market Estimates and Forecasts, by End-Use (2020-2032) (USD Billion)
9.5.2.6 Nigeria
9.5.2.6.1 Nigeria mHealth Market Estimates and Forecasts, by Component (2020-2032) (USD Billion)
9.5.2.6.2 Nigeria mHealth Market Estimates and Forecasts, by End-Use (2020-2032) (USD Billion)
9.6 Latin America
9.6.1 Trends Analysis
9.6.2 Latin America mHealth Market Estimates and Forecasts, by Country (2020-2032) (USD Billion)
9.6.3 Latin America mHealth Market Estimates and Forecasts, by Component (2020-2032) (USD Billion)
9.6.4 Latin America mHealth Market Estimates and Forecasts, by End-Use (2020-2032) (USD Billion)
9.6.5 Brazil
9.6.5.1 Brazil mHealth Market Estimates and Forecasts, by Component (2020-2032) (USD Billion)
9.6.5.2 Brazil mHealth Market Estimates and Forecasts, by End-Use (2020-2032) (USD Billion)
9.6.6 Argentina
9.6.6.1 Argentina mHealth Market Estimates and Forecasts, by Component (2020-2032) (USD Billion)
9.6.6.2 Argentina mHealth Market Estimates and Forecasts, by End-Use (2020-2032) (USD Billion)
9.6.7 Colombia
9.6.7.1 Colombia mHealth Market Estimates and Forecasts, by Component (2020-2032) (USD Billion)
9.6.7.2 Colombia mHealth Market Estimates and Forecasts, by End-Use (2020-2032) (USD Billion)
9.6.8 Rest of Latin America
9.6.8.1 Rest of Latin America mHealth Market Estimates and Forecasts, by Component (2020-2032) (USD Billion)
9.6.8.2 Rest of Latin America mHealth Market Estimates and Forecasts, by End-Use (2020-2032) (USD Billion)
10. Company Profiles
10.1 Apple, Inc.
10.1.1 Company Overview
10.1.2 Financial
10.1.3 Products/ Services Offered
10.1.4 SWOT Analysis
10.2 AT&T Intellectual Property
10.2.1 Company Overview
10.2.2 Financial
10.2.3 Products/ Services Offered
10.2.4 SWOT Analysis
10.3 AirStrip Technologies, Inc.
10.3.1 Company Overview
10.3.2 Financial
10.3.3 Products/ Services Offered
10.3.4 SWOT Analysis
10.4 Veradigm LLC (formerly Allscripts Healthcare Solutions)
10.4.1 Company Overview
10.4.2 Financial
10.4.3 Products/ Services Offered
10.4.4 SWOT Analysis
10.5 Qualcomm Technologies, Inc.
10.5.1 Company Overview
10.5.2 Financial
10.5.3 Products/ Services Offered
10.5.4 SWOT Analysis
10.6 Vodafone Group PLC
10.6.1 Company Overview
10.6.2 Financial
10.6.3 Products/ Services Offered
10.6.4 SWOT Analysis
10.7 Google, LLC
10.7.1 Company Overview
10.7.2 Financial
10.7.3 Products/ Services Offered
10.7.4 SWOT Analysis
10.8 Telefonica S.A.
10.8.1 Company Overview
10.8.2 Financial
10.8.3 Products/ Services Offered
10.8.4 SWOT Analysis
10.9 SoftServe, Inc.
10.9.1 Company Overview
10.9.2 Financial
10.9.3 Products/ Services Offered
10.9.4 SWOT Analysis
10.10 Samsung Electronics Co., Ltd.
10.10.1 Company Overview
10.10.2 Financial
10.10.3 Products/ Services Offered
10.10.4 SWOT Analysis
11. Use Cases and Best Practices
12. Conclusion
An accurate research report requires proper strategizing as well as implementation. There are multiple factors involved in the completion of good and accurate research report and selecting the best methodology to compete the research is the toughest part. Since the research reports we provide play a crucial role in any company’s decision-making process, therefore we at SNS Insider always believe that we should choose the best method which gives us results closer to reality. This allows us to reach at a stage wherein we can provide our clients best and accurate investment to output ratio.
Each report that we prepare takes a timeframe of 350-400 business hours for production. Starting from the selection of titles through a couple of in-depth brain storming session to the final QC process before uploading our titles on our website we dedicate around 350 working hours. The titles are selected based on their current market cap and the foreseen CAGR and growth.
The 5 steps process:
Step 1: Secondary Research:
Secondary Research or Desk Research is as the name suggests is a research process wherein, we collect data through the readily available information. In this process we use various paid and unpaid databases which our team has access to and gather data through the same. This includes examining of listed companies’ annual reports, Journals, SEC filling etc. Apart from this our team has access to various associations across the globe across different industries. Lastly, we have exchange relationships with various university as well as individual libraries.

Step 2: Primary Research
When we talk about primary research, it is a type of study in which the researchers collect relevant data samples directly, rather than relying on previously collected data. This type of research is focused on gaining content specific facts that can be sued to solve specific problems. Since the collected data is fresh and first hand therefore it makes the study more accurate and genuine.
We at SNS Insider have divided Primary Research into 2 parts.
Part 1 wherein we interview the KOLs of major players as well as the upcoming ones across various geographic regions. This allows us to have their view over the market scenario and acts as an important tool to come closer to the accurate market numbers. As many as 45 paid and unpaid primary interviews are taken from both the demand and supply side of the industry to make sure we land at an accurate judgement and analysis of the market.
This step involves the triangulation of data wherein our team analyses the interview transcripts, online survey responses and observation of on filed participants. The below mentioned chart should give a better understanding of the part 1 of the primary interview.

Part 2: In this part of primary research the data collected via secondary research and the part 1 of the primary research is validated with the interviews from individual consultants and subject matter experts.
Consultants are those set of people who have at least 12 years of experience and expertise within the industry whereas Subject Matter Experts are those with at least 15 years of experience behind their back within the same space. The data with the help of two main processes i.e., FGDs (Focused Group Discussions) and IDs (Individual Discussions). This gives us a 3rd party nonbiased primary view of the market scenario making it a more dependable one while collation of the data pointers.
Step 3: Data Bank Validation
Once all the information is collected via primary and secondary sources, we run that information for data validation. At our intelligence centre our research heads track a lot of information related to the market which includes the quarterly reports, the daily stock prices, and other relevant information. Our data bank server gets updated every fortnight and that is how the information which we collected using our primary and secondary information is revalidated in real time.

Step 4: QA/QC Process
After all the data collection and validation our team does a final level of quality check and quality assurance to get rid of any unwanted or undesired mistakes. This might include but not limited to getting rid of the any typos, duplication of numbers or missing of any important information. The people involved in this process include technical content writers, research heads and graphics people. Once this process is completed the title gets uploader on our platform for our clients to read it.
Step 5: Final QC/QA Process:
This is the last process and comes when the client has ordered the study. In this process a final QA/QC is done before the study is emailed to the client. Since we believe in giving our clients a good experience of our research studies, therefore, to make sure that we do not lack at our end in any way humanly possible we do a final round of quality check and then dispatch the study to the client.
Key Segments
By Component
Wearables & Connected Medical Devices
mHealth Apps
Services
By End-Use
Patients
Providers
Payers
Others
Request for Segment Customization as per your Business Requirement: Segment Customization Request
Regional Coverage:
North America
US
Canada
Mexico
Europe
Eastern Europe
Poland
Romania
Hungary
Turkey
Rest of Eastern Europe
Western Europe
Germany
France
UK
Italy
Spain
Netherlands
Switzerland
Austria
Rest of Western Europe
Asia Pacific
China
India
Japan
South Korea
Vietnam
Singapore
Australia
Rest of Asia Pacific
Middle East & Africa
Middle East
UAE
Egypt
Saudi Arabia
Qatar
Rest of Middle East
Africa
Nigeria
South Africa
Rest of Africa
Latin America
Brazil
Argentina
Colombia
Rest of Latin America
Request for Country Level Research Report: Country Level Customization Request
Available Customization
With the given market data, SNS Insider offers customization as per the company’s specific needs. The following customization options are available for the report:
Detailed Volume Analysis
Criss-Cross segment analysis (e.g. Product X Application)
Competitive Product Benchmarking
Geographic Analysis
Additional countries in any of the regions
Customized Data Representation
Detailed analysis and profiling of additional market players
Veterinary Infusion Pumps Market Size was valued at USD 325.1 million in 2023 and is expected to reach USD 623.8 million by 2032, growing at a CAGR of 7.52% over the forecast period 2024-2032.
The Smart Bandages Market was valued at USD 767.6 million in 2023 and is expected to reach USD 2111.5 million in 2032 and grow at a CAGR of 11.9% over the forecast period of 2024-2032.
The Plasma Fractionation Market Size was valued at USD 29.0 Billion in 2023, and is expected to reach USD 48.58 Billion by 2032, and grow at a CAGR of 6.16% over the forecast period 2024-2032.
The Cryoablation Devices Market size will reach $1295.34 Mn by 2032, was valued at $489.53 Mn in 2023 & growing at a CAGR of 10.26% over 2024-2032.
The Cancer Stem Cells Market Size was USD 4.06 billion in 2023 and is expected to reach USD 8.41 billion by 2032, growing at a CAGR of 8.43% by 2024-2032.
The Healthcare Cold Chain Monitoring Market Size was valued at USD 2.29 billion in 2023 and is expected to reach USD 5.68 billion by 2032 and grow at a CAGR of 10.64% over the forecast period 2024-2032.

Hi! Click one of our member below to chat on Phone
© 2025 All Rights Reserved by SNS Insider Pvt Ltd


