image

Metrology Services Market Report Scope & Overview:

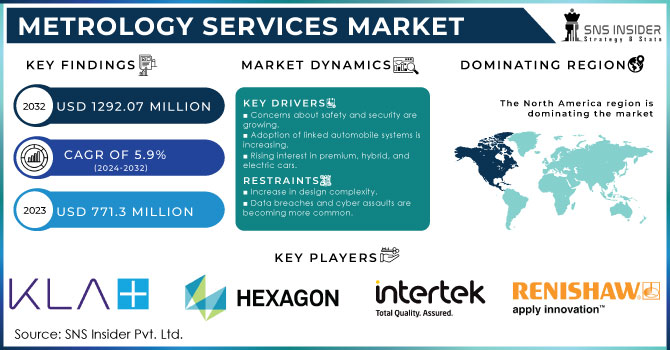
The Metrology Services Market was valued at USD 817.77 million in 2023 and is expected to reach USD 1370.14 million by 2032, growing at a CAGR of 5.95% over the forecast period 2025-2032. The increasing adoption of Metrology Services across various industries, from automotive, and aerospace to manufacturing, is attributed to the growing need for precision and regulatory compliance. Prices tend to vary with the nature of service and technology advancement, and hence the complexity of a given service. Lead time and turnaround time are important metrics, as most industries are focused on getting things done quickly and providing service at the right time to keep the production schedules on track. With the need of demand driven by the evolution of the industry, technology-based performance indicators such as AI, digital twin, and automation ensure that metrology services provide accuracy, efficiency, and reliability.

Metrology Services Market Revenue Analysis

To get more information on Metrology Services Market - Request Sample Report

Market Dynamics

Key Drivers: 

  • Precision Measurement and Industry Advancements Drive Growth in Metrology Services Market with Automation and Innovation

The increasing requirement for precision measurement in industries such as automotive, aerospace, and electronics is fuelling the metrology services market growth. Increasing mergers and acquisitions due to market consolidation and implementation of Industry 4.0 along with advancements in automation and 3D scanning are anticipated to drive the X-ray inspection market expansion. Increasing complexity in manufacturing processes and stringent quality control regulations are pressuring businesses to adopt sophisticated metrology solutions. Findings also note inline inspection and the use of cloud-based metrology software increase data efficiency and accuracy.

Restrain: 

  • Overcoming Challenges in Extreme Environments Data Security and Accuracy in Advanced Metrology Solutions for Industries

For many industries including aerospace and power generation, conventional metrology tools will not work under extreme conditions requiring precision measurement in high-temperature, high-pressure, or corrosive environments. In addition, although the utilization of non-contact measurement technologies is ever-present achieving high accuracy on complex geometries and reflective surfaces is notoriously challenging. Another issue is the data security in digital metrology because this kind of service needs to transfer and/or store sensitive manufacturing information. Cybersecurity and data breach prevention are still a must even among companies that leverage cloud-based or AI-assisted metrology solutions.

Opportunity:

  • Cloud-Based AI Technologies and Emerging Applications Drive Growth in Metrology Services for High-Precision Markets

With the proliferation of cloud-based metrology services and the increased adoption of AI-powered capabilities that guide predictive maintenance and data-based decision-making, opportunities within the market are increasing. Various applications using optical and noncontact measurement technologies are rapidly growing in high-precision markets, particularly for medical devices and renewable energy, which offers substantial growth opportunities. Rapid industrialization and infrastructure development needs in emerging markets, especially in the Asia-Pacific, are also fueling demand. In addition, the increasing demand for electric vehicles (EVs) and self-driving car technologies is establishing new applications for metrology services in areas such as battery production, sensor calibration, and vehicle part inspection, the market outlook remains favorable over the long term.

Challenges:

  • Integration Challenges Expertise Gap and Training Deficiencies Hinder Growth of Advanced Metrology Services in Industries

Complexities associated with integrating these advanced measurement technologies into existing manufacturing workflows have become a challenge for metrology services and thus are expected to hamper the growth of the market. In many industries, legacy systems are maintained, which makes it complex to implement modern metrology solutions in a high degree of seamless manner. Management problems across software and hardware platforms only make matters worse. Another enormous problem is the so-called expertise gap – there do not exist enough professionals who can operate and interpret the metrology data. With the change in metrology technologies, extensive training and experience will be needed, which leads to a shortage of qualified personnel in the field. Such a shortage can result in more measurement inaccuracies, sub-optimal data analytics, and poor decision-making within industries.


Segment Analysis

By Product

Coordinate Measuring Machines dominated the market with 63.6% of the share in 2023, owing to the large number of applications in the high-precision measurement industry. The versatility of CMMs with dimensional inspection with affordability, precision, and repeatability is advantageous and beneficial for sectors like automotive, aerospace,  and industrial manufacturing. They can measure complex geometries and provide excellent quality assurance through contact-based probing methods, therefore are the go-to choice for traditional applications and large-scale production environments. Furthermore, the launch of software integration along with automation and multi-sensor upgradation also has strengthened the position of CMMs in the market.

Optical Digitizers and Scanners are also projected to experience the highest CAGR from 2024 to 2032 as they offer a non-contact method, and faster, and instantaneous measurement solutions. ODS allows for fast capturing of complex geometries with 3D scanners (particularly laser-based and structured light) for use cases such as reverse engineering, 3D modeling, and additive manufacturing. The scanners can capture millions of data points quickly and with very little contact with the surface, which reduces the turn-around times and enhances efficiency. Because of the pivoting of industries towards automation, in-line metrology, and digital twin applications, ODS is expected to see rapid growth and adoption, outpacing growth for traditional CMMs.

By Application

The automotive sector was the largest in the metrology services market, accounting for 46.2% of the global market in 2023, as the automotive industry is characterized by a high requirement for precise measurements related to vehicle manufacturing, quality control, and safety compliance. In the Automotive sector, both OEMs and suppliers depend on advanced metrology solutions such as Coordinate Measuring Machines (CMM) and Optical Digitizers & Scanners (ODS) to ensure part accuracy, reduce defects, and comply with regulatory requirements. Backed by the rise of electric vehicles (EV) and autonomous driving technologies, the need for accurate inspection of batteries, sensors, and lightweight materials has grown. Meanwhile, the automotive sector has further reinforced its position through production line automation and inline metrology solutions.

The aerospace industry has also been predicted to grow with the highest compound annual growth rate (CAGR) in the forecast period from 2024 to 2032 owing to the rising demand for high-precise measurement in airplane manufacturing, maintenance, and inspection processes. Laser Scanning of Aerospace Components Aerospace components such as turbine blades, fuselage structures, and engine parts are often critically defined by extremely tight tolerances and complex geometries, necessitating the best in advanced non-contact and 3D scanning technologies. Further strengthening the demand for metrology markets is the growth in commercial air travel increasing defense budgets; and the rise in the use of additive manufacturing in aircraft manufacturing. Since aerospace companies are primarily concentrating on automation and lightweight materials and digital twin technology via 3D scanning, these metrology services in the aerospace segment are expected to grow significantly.

Regional Analysis

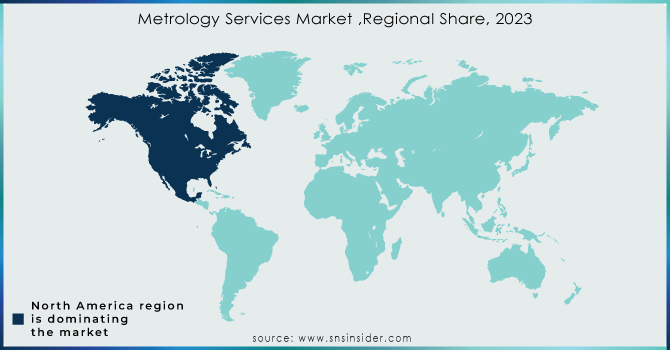
North America was the highest contributor to the metrology services market with a 35.2% share in 2023 owing to industries such as aerospace, automotive, and semiconductor manufacturing being widely present in the region. The demand for advanced metrology solutions in the region is driven by existing infrastructure in the region, high automation investment, and rigorous quality standards. For instance, Boeing and Lockheed Martin use coordinate measuring machines (CMM) and optical digitizers for aircraft component inspection to test for precision and safety compliance. Similarly, in the U.S. semiconductor sector, led by the likes of Intel and Texas Instruments, high-precision metrology tools are used to hold tight tolerances during chip manufacture for efficient production.

Asia-Pacific is projected to register the highest CAGR over the forecast period (2024 —2032) owing to the booming industrialization, substantial inflow of foreign investments, and thriving manufacturing sectors in China, India, Japan, and South Korea. Inline metrology and 3D scanning solutions for production enhance the quality of production and their adoption is increasing in the automotive industry in China, with companies like BYD and Geely Moreover, semiconductor fabrication and precision components business activity are driving demand for metrology in South Korea’s electronics sector led by Samsung and LG. Due to government-driven smart manufacturing initiatives and infrastructure developments, APAC will lead the growth and demand for metrology services.

Metrology-Services-Market-Regional-Share-2023

Need any customization research/data on Metrology Services Market - Enquiry Now

Key players

Some of the major players in the Metrology Services Market are:

  • Mitutoyo Corporation (Coordinate Measuring Machines, Digital Micrometers)

  • Hexagon AB (Leica Absolute Tracker AT402, ROMER Absolute Arm)

  • Nikon Metrology (Laser Radar Systems, X-ray Computed Tomography Systems)

  • Renishaw plc (Touch Trigger Probes, Equator Gauging System)

  • Zeiss Industrial Metrology (CONTURA CMM, O-INSPECT Multisensor Measuring Machine)

  • FARO Technologies (FARO Laser Scanner, FARO Gage)

  • Keyence Corporation (IM Series Image Dimension Measurement System, XM Series Handheld Probe CMM)

  • Creaform (HandySCAN 3D, MetraSCAN 3D)

  • Ametek (Zygo Optical Profilers, Creaform 3D Scanners)

  • Perceptron, Inc. (AutoGauge, AutoScan)

  • GOM GmbH (ATOS 3D Scanner, TRITOP Photogrammetry System)

  • KLA Corporation (Tencor Metrology Systems, NanoSurf)

  • Bruker Corporation (ContourGT Optical Profiler, Dektak Stylus Profilers)

  • Heidenhain GmbH (Length Gauges, Rotary Encoders)

  • Jenoptik Group (Opticline Contour Measuring Systems, Hommel Etamic Roughness Measuring Systems)


Recent Trends

  • In October 2024, Mitutoyo America Corporation introduced the Metlogix M3 software for its Quick Image (QI) Vision System, enhancing precision with advanced video edge detection and automated measurement.

  • In November 2024, Exact Metrology partnered with Hexagon Manufacturing Intelligence to expand its coordinate metrology solutions, offering advanced CMMs, laser trackers, and measuring arms.

  • In November 2024, Nikon divested its laser scanning and Focus Inspection software division to UK’s LK Metrology, transferring R&D, service, and production teams.

Metrology Services Market Report Scope:

Report Attributes Details
Market Size in 2023 USD 817.77 Million
Market Size by 2032 USD 1370.14 Million
CAGR CAGR of 5.95% From 2024 to 2032
Base Year 2023
Forecast Period 2024-2032
Historical Data 2020-2022
Report Scope & Coverage Market Size, Segments Analysis, Competitive  Landscape, Regional Analysis, DROC & SWOT Analysis, Forecast Outlook
Key Segments • By Product (Coordinate Measuring Machines (CMM), Optical Digitizers and Scanners (ODS))
• By Application (Automotive, Aerospace, Industrial, Power Generation, Others)
Regional Analysis/Coverage North America (US, Canada, Mexico), Europe (Eastern Europe [Poland, Romania, Hungary, Turkey, Rest of Eastern Europe] Western Europe] Germany, France, UK, Italy, Spain, Netherlands, Switzerland, Austria, Rest of Western Europe]), Asia Pacific (China, India, Japan, South Korea, Vietnam, Singapore, Australia, Rest of Asia Pacific), Middle East & Africa (Middle East [UAE, Egypt, Saudi Arabia, Qatar, Rest of Middle East], Africa [Nigeria, South Africa, Rest of Africa], Latin America (Brazil, Argentina, Colombia, Rest of Latin America)
Company Profiles Mitutoyo Corporation, Hexagon AB, Nikon Metrology, Renishaw plc, Zeiss Industrial Metrology, FARO Technologies, Keyence Corporation, Creaform, Ametek, Perceptron, Inc., GOM GmbH, KLA Corporation, Bruker Corporation, Heidenhain GmbH, Jenoptik Group, Leica Microsystems, Tesa SA, Mahr GmbH, Optical Gaging Products (OGP), Vision Engineering Ltd.


Frequently Asked Questions

Ans: The Metrology Services Market is expected to grow at a CAGR of 5.95% during 2024-2032.

Ans: Metrology Services Market size was USD 817.77 Million in 2023 and is expected to Reach USD 1370.14 Million by 2032.

Ans: The major growth factor of the Metrology Services market is the increasing demand for precision and quality control across various industries, driven by advancements in technology and regulatory standards.

Ans: The Coordinate Measuring Machines (CMM) segment dominated the Industrial battery market in 2023.

Ans: North America dominated the Metrology Services Market in 2023.

Table of Content

1. Introduction

1.1 Market Definition

1.2 Scope (Inclusion and Exclusions)

1.3 Research Assumptions

2. Executive Summary

2.1 Market Overview

2.2 Regional Synopsis

2.3 Competitive Summary

3. Research Methodology

3.1 Top-Down Approach

3.2 Bottom-up Approach

3.3. Data Validation

3.4 Primary Interviews

4. Market Dynamics Impact Analysis

4.1 Market Driving Factors Analysis

4.1.1 Drivers

4.1.2 Restraints

4.1.3 Opportunities

4.1.4 Challenges

4.2 PESTLE Analysis

4.3 Porter’s Five Forces Model

5. Statistical Insights and Trends Reporting

5.1 Metrology Services Price Trends (2023)

5.2 Metrology Services Lead Time and Turnaround Time

5.3 Metrology Services Technology-Driven Performance Indicators

6. Competitive Landscape

6.1 List of Major Companies, By Region

6.2 Market Share Analysis, By Region

6.3 Product Benchmarking

6.3.1 Product specifications and features

6.3.2 Pricing

6.4 Strategic Initiatives

6.4.1 Marketing and promotional activities

6.4.2 Distribution and Supply Chain Strategies

6.4.3 Expansion plans and new product launches

6.4.4 Strategic partnerships and collaborations

6.5 Technological Advancements

6.6 Market Positioning and Branding

7. Metrology Services Market Segmentation, By Product

7.1 Chapter Overview

7.2 Coordinate Measuring Machines (CMM)

7.2.1 Coordinate Measuring Machines (CMM) Market Trends Analysis (2020-2032)

7.2.2 Coordinate Measuring Machines (CMM) Market Size Estimates and Forecasts to 2032 (USD MILLION)

7.3 Optical Digitizers and Scanners (ODS)

7.3.1 Optical Digitizers and Scanners (ODS) Market Trends Analysis (2020-2032)

7.3.2 Optical Digitizers and Scanners (ODS) Market Size Estimates and Forecasts to 2032 (USD MILLION)

8. Metrology Services Market Segmentation, By Application

8.1 Chapter Overview

8.2 Automotive

8.2.1 Automotive Market Trends Analysis (2020-2032)

8.2.2 Automotive Market Size Estimates and Forecasts to 2032 (USD MILLION)

8.3 Aerospace

8.3.1 Aerospace Market Trends Analysis (2020-2032)

8.3.2 Aerospace Market Size Estimates and Forecasts to 2032 (USD MILLION)

8.4 Industrial

8.4.1 Industrial Market Trends Analysis (2020-2032)

8.4.2 Industrial Market Size Estimates and Forecasts to 2032 (USD MILLION)

8.5 Power Generation

8.5.1 Power Generation Market Trends Analysis (2020-2032)

8.5.2 Power Generation Market Size Estimates and Forecasts to 2032 (USD MILLION)

8.6 Others

8.6.1 Others Market Trends Analysis (2020-2032)

8.6.2 Others Market Size Estimates and Forecasts to 2032 (USD MILLION)

9. Regional Analysis

9.1 Chapter Overview

9.2 North America

9.2.1 Trends Analysis

9.2.2 North America Metrology Services Market Estimates and Forecasts, by Country (2020-2032) (USD MILLION)

9.2.3 North America Metrology Services Market Estimates and Forecasts, By Product (2020-2032) (USD MILLION) 

9.2.4 North America Metrology Services Market Estimates and Forecasts, By Application (2020-2032) (USD MILLION)

9.2.5 USA

9.2.5.1 USA Metrology Services Market Estimates and Forecasts, By Product (2020-2032) (USD MILLION)

9.2.5.2 USA Metrology Services Market Estimates and Forecasts, By Application (2020-2032) (USD MILLION)

9.2.6 Canada

9.2.6.1 Canada Metrology Services Market Estimates and Forecasts, By Product (2020-2032) (USD MILLION)

9.2.6.2 Canada Metrology Services Market Estimates and Forecasts, By Application (2020-2032) (USD MILLION)

9.2.7 Mexico

9.2.7.1 Mexico Metrology Services Market Estimates and Forecasts, By Product (2020-2032) (USD MILLION)

9.2.7.2 Mexico Metrology Services Market Estimates and Forecasts, By Application (2020-2032) (USD MILLION)

9.3 Europe

9.3.1 Eastern Europe

9.3.1.1 Trends Analysis

9.3.1.2 Eastern Europe Metrology Services Market Estimates and Forecasts, by Country (2020-2032) (USD MILLION)

9.3.1.3 Eastern Europe Metrology Services Market Estimates and Forecasts, By Product (2020-2032) (USD MILLION) 

9.3.1.4 Eastern Europe Metrology Services Market Estimates and Forecasts, By Application (2020-2032) (USD MILLION)

9.3.1.5 Poland

9.3.1.5.1 Poland Metrology Services Market Estimates and Forecasts, By Product (2020-2032) (USD MILLION)

9.3.1.5.2 Poland Metrology Services Market Estimates and Forecasts, By Application (2020-2032) (USD MILLION)

9.3.1.6 Romania

9.3.1.6.1 Romania Metrology Services Market Estimates and Forecasts, By Product (2020-2032) (USD MILLION)

9.3.1.6.2 Romania Metrology Services Market Estimates and Forecasts, By Application (2020-2032) (USD MILLION)

9.3.1.7 Hungary

9.3.1.7.1 Hungary Metrology Services Market Estimates and Forecasts, By Product (2020-2032) (USD MILLION)

9.3.1.7.2 Hungary Metrology Services Market Estimates and Forecasts, By Application (2020-2032) (USD MILLION)

9.3.1.8 turkey

9.3.1.8.1 Turkey Metrology Services Market Estimates and Forecasts, By Product (2020-2032) (USD MILLION)

9.3.1.8.2 Turkey Metrology Services Market Estimates and Forecasts, By Application (2020-2032) (USD MILLION)

9.3.1.9 Rest of Eastern Europe

9.3.1.9.1 Rest of Eastern Europe Metrology Services Market Estimates and Forecasts, By Product (2020-2032) (USD MILLION)

9.3.1.9.2 Rest of Eastern Europe Metrology Services Market Estimates and Forecasts, By Application (2020-2032) (USD MILLION)

9.3.2 Western Europe

9.3.2.1 Trends Analysis

9.3.2.2 Western Europe Metrology Services Market Estimates and Forecasts, by Country (2020-2032) (USD MILLION)

9.3.2.3 Western Europe Metrology Services Market Estimates and Forecasts, By Product (2020-2032) (USD MILLION) 

9.3.2.4 Western Europe Metrology Services Market Estimates and Forecasts, By Application (2020-2032) (USD MILLION)

9.3.2.5 Germany

9.3.2.5.1 Germany Metrology Services Market Estimates and Forecasts, By Product (2020-2032) (USD MILLION)

9.3.2.5.2 Germany Metrology Services Market Estimates and Forecasts, By Application (2020-2032) (USD MILLION)

9.3.2.6 France

9.3.2.6.1 France Metrology Services Market Estimates and Forecasts, By Product (2020-2032) (USD MILLION)

9.3.2.6.2 France Metrology Services Market Estimates and Forecasts, By Application (2020-2032) (USD MILLION)

9.3.2.7 UK

9.3.2.7.1 UK Metrology Services Market Estimates and Forecasts, By Product (2020-2032) (USD MILLION)

9.3.2.7.2 UK Metrology Services Market Estimates and Forecasts, By Application (2020-2032) (USD MILLION)

9.3.2.8 Italy

9.3.2.8.1 Italy Metrology Services Market Estimates and Forecasts, By Product (2020-2032) (USD MILLION)

9.3.2.8.2 Italy Metrology Services Market Estimates and Forecasts, By Application (2020-2032) (USD MILLION)

9.3.2.9 Spain

9.3.2.9.1 Spain Metrology Services Market Estimates and Forecasts, By Product (2020-2032) (USD MILLION)

9.3.2.9.2 Spain Metrology Services Market Estimates and Forecasts, By Application (2020-2032) (USD MILLION)

9.3.2.10 Netherlands

9.3.2.10.1 Netherlands Metrology Services Market Estimates and Forecasts, By Product (2020-2032) (USD MILLION)

9.3.2.10.2 Netherlands Metrology Services Market Estimates and Forecasts, By Application (2020-2032) (USD MILLION)

9.3.2.11 Switzerland

9.3.2.11.1 Switzerland Metrology Services Market Estimates and Forecasts, By Product (2020-2032) (USD MILLION)

9.3.2.11.2 Switzerland Metrology Services Market Estimates and Forecasts, By Application (2020-2032) (USD MILLION)

9.3.2.12 Austria

9.3.2.12.1 Austria Metrology Services Market Estimates and Forecasts, By Product (2020-2032) (USD MILLION)

9.3.2.12.2 Austria Metrology Services Market Estimates and Forecasts, By Application (2020-2032) (USD MILLION)

9.3.2.13 Rest of Western Europe

9.3.2.13.1 Rest of Western Europe Metrology Services Market Estimates and Forecasts, By Product (2020-2032) (USD MILLION)

9.3.2.13.2 Rest of Western Europe Metrology Services Market Estimates and Forecasts, By Application (2020-2032) (USD MILLION)

9.4 Asia Pacific

9.4.1 Trends Analysis

9.4.2 Asia Pacific Metrology Services Market Estimates and Forecasts, by Country (2020-2032) (USD MILLION)

9.4.3 Asia Pacific Metrology Services Market Estimates and Forecasts, By Product (2020-2032) (USD MILLION) 

9.4.4 Asia Pacific Metrology Services Market Estimates and Forecasts, By Application (2020-2032) (USD MILLION)

9.4.5 China

9.4.5.1 China Metrology Services Market Estimates and Forecasts, By Product (2020-2032) (USD MILLION)

9.4.5.2 China Metrology Services Market Estimates and Forecasts, By Application (2020-2032) (USD MILLION)

9.4.6 India

9.4.5.1 India Metrology Services Market Estimates and Forecasts, By Product (2020-2032) (USD MILLION)

9.4.5.2 India Metrology Services Market Estimates and Forecasts, By Application (2020-2032) (USD MILLION)

9.4.5 Japan

9.4.5.1 Japan Metrology Services Market Estimates and Forecasts, By Product (2020-2032) (USD MILLION)

9.4.5.2 Japan Metrology Services Market Estimates and Forecasts, By Application (2020-2032) (USD MILLION)

9.4.6 South Korea

9.4.6.1 South Korea Metrology Services Market Estimates and Forecasts, By Product (2020-2032) (USD MILLION)

9.4.6.2 South Korea Metrology Services Market Estimates and Forecasts, By Application (2020-2032) (USD MILLION)

9.4.7 Vietnam

9.4.7.1 Vietnam Metrology Services Market Estimates and Forecasts, By Product (2020-2032) (USD MILLION)

9.2.7.2 Vietnam Metrology Services Market Estimates and Forecasts, By Application (2020-2032) (USD MILLION)

9.4.8 Singapore

9.4.8.1 Singapore Metrology Services Market Estimates and Forecasts, By Product (2020-2032) (USD MILLION)

9.4.8.2 Singapore Metrology Services Market Estimates and Forecasts, By Application (2020-2032) (USD MILLION)

9.4.9 Australia

9.4.9.1 Australia Metrology Services Market Estimates and Forecasts, By Product (2020-2032) (USD MILLION)

9.4.9.2 Australia Metrology Services Market Estimates and Forecasts, By Application (2020-2032) (USD MILLION)

9.4.10 Rest of Asia Pacific

9.4.10.1 Rest of Asia Pacific Metrology Services Market Estimates and Forecasts, By Product (2020-2032) (USD MILLION)

9.4.10.2 Rest of Asia Pacific Metrology Services Market Estimates and Forecasts, By Application (2020-2032) (USD MILLION)

9.5 Middle East and Africa

9.5.1 Middle East

9.5.1.1 Trends Analysis

9.5.1.2 Middle East Metrology Services Market Estimates and Forecasts, by Country (2020-2032) (USD MILLION)

9.5.1.3 Middle East Metrology Services Market Estimates and Forecasts, By Product (2020-2032) (USD MILLION) 

9.5.1.4 Middle East Metrology Services Market Estimates and Forecasts, By Application (2020-2032) (USD MILLION)

9.5.1.5 UAE

9.5.1.5.1 UAE Metrology Services Market Estimates and Forecasts, By Product (2020-2032) (USD MILLION)

9.5.1.5.2 UAE Metrology Services Market Estimates and Forecasts, By Application (2020-2032) (USD MILLION)

9.5.1.6 Egypt

9.5.1.6.1 Egypt Metrology Services Market Estimates and Forecasts, By Product (2020-2032) (USD MILLION)

9.5.1.6.2 Egypt Metrology Services Market Estimates and Forecasts, By Application (2020-2032) (USD MILLION)

9.5.1.7 Saudi Arabia

9.5.1.7.1 Saudi Arabia Metrology Services Market Estimates and Forecasts, By Product (2020-2032) (USD MILLION)

9.5.1.7.2 Saudi Arabia Metrology Services Market Estimates and Forecasts, By Application (2020-2032) (USD MILLION)

9.5.1.8 Qatar

9.5.1.8.1 Qatar Metrology Services Market Estimates and Forecasts, By Product (2020-2032) (USD MILLION)

9.5.1.8.2 Qatar Metrology Services Market Estimates and Forecasts, By Application (2020-2032) (USD MILLION)

9.5.1.9 Rest of Middle East

9.5.1.9.1 Rest of Middle East Metrology Services Market Estimates and Forecasts, By Product (2020-2032) (USD MILLION)

9.5.1.9.2 Rest of Middle East Metrology Services Market Estimates and Forecasts, By Application (2020-2032) (USD MILLION)

9.5.2 Africa

9.5.2.1 Trends Analysis

9.5.2.2 Africa Metrology Services Market Estimates and Forecasts, by Country (2020-2032) (USD MILLION)

9.5.2.3 Africa Metrology Services Market Estimates and Forecasts, By Product (2020-2032) (USD MILLION) 

9.5.2.4 Africa Metrology Services Market Estimates and Forecasts, By Application (2020-2032) (USD MILLION)

9.5.2.5 South Africa

9.5.2.5.1 South Africa Metrology Services Market Estimates and Forecasts, By Product (2020-2032) (USD MILLION)

9.5.2.5.2 South Africa Metrology Services Market Estimates and Forecasts, By Application (2020-2032) (USD MILLION)

9.5.2.6 Nigeria

9.5.2.6.1 Nigeria Metrology Services Market Estimates and Forecasts, By Product (2020-2032) (USD MILLION)

9.5.2.6.2 Nigeria Metrology Services Market Estimates and Forecasts, By Application (2020-2032) (USD MILLION)

9.5.2.7 Rest of Africa

9.5.2.7.1 Rest of Africa Metrology Services Market Estimates and Forecasts, By Product (2020-2032) (USD MILLION)

9.5.2.7.2 Rest of Africa Metrology Services Market Estimates and Forecasts, By Application (2020-2032) (USD MILLION)

9.6 Latin America

9.6.1 Trends Analysis

9.6.2 Latin America Metrology Services Market Estimates and Forecasts, by Country (2020-2032) (USD MILLION)

9.6.3 Latin America Metrology Services Market Estimates and Forecasts, By Product (2020-2032) (USD MILLION) 

9.6.4 Latin America Metrology Services Market Estimates and Forecasts, By Application (2020-2032) (USD MILLION)

9.6.5 Brazil

9.6.5.1 Brazil Metrology Services Market Estimates and Forecasts, By Product (2020-2032) (USD MILLION)

9.6.5.2 Brazil Metrology Services Market Estimates and Forecasts, By Application (2020-2032) (USD MILLION)

9.6.6 Argentina

9.6.6.1 Argentina Metrology Services Market Estimates and Forecasts, By Product (2020-2032) (USD MILLION)

9.6.6.2 Argentina Metrology Services Market Estimates and Forecasts, By Application (2020-2032) (USD MILLION)

9.6.7 Colombia

9.6.7.1 Colombia Metrology Services Market Estimates and Forecasts, By Product (2020-2032) (USD MILLION)

9.6.7.2 Colombia Metrology Services Market Estimates and Forecasts, By Application (2020-2032) (USD MILLION)

9.6.8 Rest of Latin America

9.6.8.1 Rest of Latin America Metrology Services Market Estimates and Forecasts, By Product (2020-2032) (USD MILLION)

9.6.8.2 Rest of Latin America Metrology Services Market Estimates and Forecasts, By Application (2020-2032) (USD MILLION)

10. Company Profiles

10.1 Mitutoyo Corporation

10.1.1 Company Overview

10.1.2 Financial

10.1.3 Products/ Services Offered

110.1.4 SWOT Analysis

10.2 Hexagon AB

10.2.1 Company Overview

10.2.2 Financial

10.2.3 Products/ Services Offered

10.2.4 SWOT Analysis

10.3 Nikon Metrology.

10.3.1 Company Overview

10.3.2 Financial

10.3.3 Products/ Services Offered

10.3.4 SWOT Analysis

10.4 Renishaw plc

10.4.1 Company Overview

10.4.2 Financial

10.4.3 Products/ Services Offered

10.4.4 SWOT Analysis

10.5 Zeiss Industrial Metrology

10.5.1 Company Overview

10.5.2 Financial

10.5.3 Products/ Services Offered

10.5.4 SWOT Analysis

10.6 FARO Technologies.

10.6.1 Company Overview

10.6.2 Financial

10.6.3 Products/ Services Offered

10.6.4 SWOT Analysis

10.7 Keyence Corporation

10.7.1 Company Overview

10.7.2 Financial

10.7.3 Products/ Services Offered

10.7.4 SWOT Analysis

10.8 Creaform

10.8.1 Company Overview

10.8.2 Financial

10.8.3 Products/ Services Offered

10.8.4 SWOT Analysis

10.9 Ametek

10.9.1 Company Overview

10.9.2 Financial

10.9.3 Products/ Services Offered

10.9.4 SWOT Analysis

10.10 Perceptron, Inc.

             10.9.1 Company Overview

10.9.2 Financial

10.9.3 Products/ Services Offered

10.9.4 SWOT Analysis

11. Use Cases and Best Practices

12. Conclusion

An accurate research report requires proper strategizing as well as implementation. There are multiple factors involved in the completion of good and accurate research report and selecting the best methodology to compete the research is the toughest part. Since the research reports we provide play a crucial role in any company’s decision-making process, therefore we at SNS Insider always believe that we should choose the best method which gives us results closer to reality. This allows us to reach at a stage wherein we can provide our clients best and accurate investment to output ratio.

Each report that we prepare takes a timeframe of 350-400 business hours for production. Starting from the selection of titles through a couple of in-depth brain storming session to the final QC process before uploading our titles on our website we dedicate around 350 working hours. The titles are selected based on their current market cap and the foreseen CAGR and growth.


The 5 steps process:

Step 1: Secondary Research:

Secondary Research or Desk Research is as the name suggests is a research process wherein, we collect data through the readily available information. In this process we use various paid and unpaid databases which our team has access to and gather data through the same. This includes examining of listed companies’ annual reports, Journals, SEC filling etc. Apart from this our team has access to various associations across the globe across different industries. Lastly, we have exchange relationships with various university as well as individual libraries.

Secondary Research

Step 2: Primary Research

When we talk about primary research, it is a type of study in which the researchers collect relevant data samples directly, rather than relying on previously collected data.  This type of research is focused on gaining content specific facts that can be sued to solve specific problems. Since the collected data is fresh and first hand therefore it makes the study more accurate and genuine.

We at SNS Insider have divided Primary Research into 2 parts.

Part 1 wherein we interview the KOLs of major players as well as the upcoming ones across various geographic regions. This allows us to have their view over the market scenario and acts as an important tool to come closer to the accurate market numbers. As many as 45 paid and unpaid primary interviews are taken from both the demand and supply side of the industry to make sure we land at an accurate judgement and analysis of the market.

This step involves the triangulation of data wherein our team analyses the interview transcripts, online survey responses and observation of on filed participants. The below mentioned chart should give a better understanding of the part 1 of the primary interview.

Primary Research

Part 2: In this part of primary research the data collected via secondary research and the part 1 of the primary research is validated with the interviews from individual consultants and subject matter experts.

Consultants are those set of people who have at least 12 years of experience and expertise within the industry whereas Subject Matter Experts are those with at least 15 years of experience behind their back within the same space. The data with the help of two main processes i.e., FGDs (Focused Group Discussions) and IDs (Individual Discussions). This gives us a 3rd party nonbiased primary view of the market scenario making it a more dependable one while collation of the data pointers.

Step 3: Data Bank Validation

Once all the information is collected via primary and secondary sources, we run that information for data validation. At our intelligence centre our research heads track a lot of information related to the market which includes the quarterly reports, the daily stock prices, and other relevant information. Our data bank server gets updated every fortnight and that is how the information which we collected using our primary and secondary information is revalidated in real time.

Data Bank Validation

Step 4: QA/QC Process

After all the data collection and validation our team does a final level of quality check and quality assurance to get rid of any unwanted or undesired mistakes. This might include but not limited to getting rid of the any typos, duplication of numbers or missing of any important information. The people involved in this process include technical content writers, research heads and graphics people. Once this process is completed the title gets uploader on our platform for our clients to read it.

Step 5: Final QC/QA Process:

This is the last process and comes when the client has ordered the study. In this process a final QA/QC is done before the study is emailed to the client. Since we believe in giving our clients a good experience of our research studies, therefore, to make sure that we do not lack at our end in any way humanly possible we do a final round of quality check and then dispatch the study to the client.

Key Segments:

By Product

  • Coordinate Measuring Machines (CMM)

  • Optical Digitizers and Scanners (ODS)

By Application

  • Automotive

  • Aerospace

  • Industrial

  • Power Generation

  • Others

Request for Segment Customization as per your Business Requirement: Segment Customization Request

REGIONAL COVERAGE:

North America

  • US

  • Canada

  • Mexico

Europe

  • Eastern Europe

    • Poland

    • Romania

    • Hungary

    • Turkey

    • Rest of Eastern Europe

  • Western Europe

    • Germany

    • France

    • UK

    • Italy

    • Spain

    • Netherlands

    • Switzerland

    • Austria

    • Rest of Western Europe

Asia Pacific

  • China

  • India

  • Japan

  • South Korea

  • Vietnam

  • Singapore

  • Australia

  • Rest of Asia Pacific

Middle East & Africa

  • Middle East

    • UAE

    • Egypt

    • Saudi Arabia

    • Qatar

    • Rest of the Middle East

  • Africa

    • Nigeria

    • South Africa

    • Rest of Africa

Latin America

  • Brazil

  • Argentina

  • Colombia

  • Rest of Latin America

Request for Country Level Research Report: Country Level Customization Request

Available Customization

With the given market data, SNS Insider offers customization as per the company’s specific needs. The following customization options are available for the report:

  • Product Analysis

  • Criss-Cross segment analysis (e.g. Product X Application)

  • Product Matrix which gives a detailed comparison of the product portfolio of each company

  • Geographic Analysis

  • Additional countries in any of the regions

  • Company Information

  • Detailed analysis and profiling of additional market players (Up to five)


  •            5000 (33% Discount)


  •            8950 (40% Discount)


  •            3050 (23% Discount)

Start a Conversation

Hi! Click one of our member below to chat on Phone