Metaverse In E-commerce Market Report Scope & Overview:
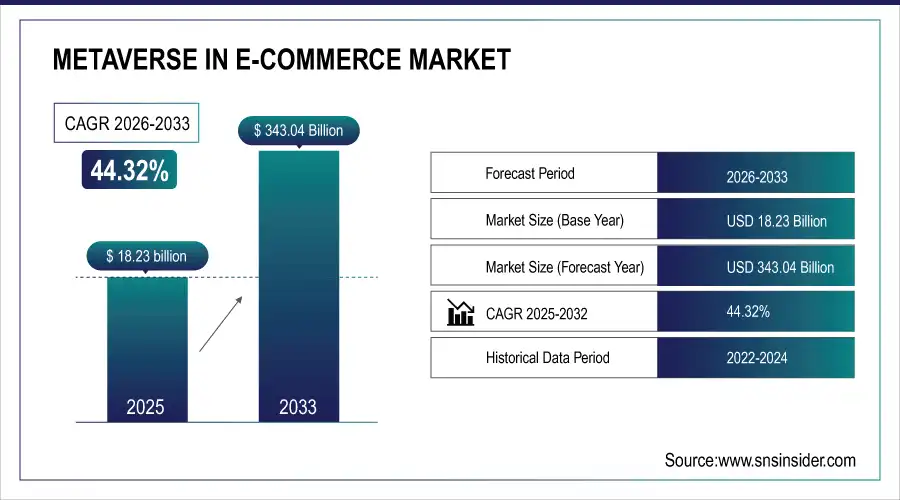
The Metaverse In E-commerce Market was valued at USD 18.23 billion in 2025E and is expected to reach USD 343.04 billion by 2033, growing at a CAGR of 44.32% from 2026-2033. This report includes adoption rates insights, consumer metrics, user population, advertising & marketing expenditure, and subscription & membership growth. The market is witnessing tremendous growth as companies use immersive technologies to make online buying more immersive. High adoption levels are fueled by the evolution in AR/VR, AI, and blockchain that is bringing an array of customers. Consumer participation is booming in engaging virtual malls, and marketing investments are mounting to leverage digital exposure. Membership-based and subscription-type models are coming into the fore, enhancing overall market revenues.
Metaverse In E-commerce Market Size and Forecast
-
Metaverse In E-commerce Market Size in 2025E: USD 18.23 Billion
-
Metaverse In E-commerce Market Size by 2033: USD 343.04 Billion
-
CAGR: 44.32% from 2026 to 2033
-
Base Year: 2025E
-
Forecast Period: 2026–2033
-
Historical Data: 2022–2024
To Get more information on Metaverse In E-commerce Market- Request Free Sample Report
Metaverse In E-commerce Market Trends
-
Rising adoption of immersive shopping experiences is driving metaverse integration in e-commerce.
-
Use of AR/VR technologies is enabling virtual try-ons, 3D product visualization, and personalized shopping journeys.
-
Growing demand for interactive and social shopping environments is boosting market growth.
-
Integration with blockchain and NFTs is enhancing digital ownership, payments, and loyalty programs.
-
Expansion of virtual storefronts and branded experiences is reshaping customer engagement.
-
Increasing investments from retailers, tech firms, and fashion brands are accelerating innovation.
-
Cross-platform compatibility and gamified shopping features are widening user adoption and retention.
Metaverse In E-commerce Market Growth Drivers
-
Immersive Shopping Experiences Redefine E-Commerce with Virtual Stores, 3D Visualization, and AI-Driven Personalization for Enhanced Customer Engagement and Conversions.
The rise of virtual malls and three-dimensional visualization of products is revamping how people engage with online shopping portals. Through providing an interactive and realistic shopping space, companies are able to promote customer interaction and foster greater brand loyalty. Consumers are able to browse virtual storefronts, simulate product trials, and engage in real-time interactions, resulting in more assured purchases. This technology reduces the disconnect between offline and online shopping, lowering return rates and boosting conversion rates. As consumer behavior moves toward more interactive and individualized experiences, brands are using AR, VR, and AI-based technologies to design seamless, engaging experiences. Increasing demand for such superior experiences is driving the adoption of the metaverse in e-commerce at a faster pace, determining the direction of digital retailing.
Metaverse In E-commerce Market Restraints
-
High Implementation Costs Hinder Metaverse E-Commerce Growth as AR, VR, and AI Development Require Significant Investment, Limiting Accessibility and Adoption.
The incorporation of AR, VR, and AI technologies into e-commerce requires huge monetary investment, which is a hindrance for most companies. The creation of virtual stores, establishing realistic 3D worlds, and ensuring high-performance platforms entail sophisticated infrastructure and experienced expertise, which increases the cost manifold. Small and medium-sized retailers usually find it difficult to bear such costs, thus restricting their chances of competing in the changing digital market. Secondly, the expense of VR headsets and supporting equipment hinders consumer availability, detracting from mass adoption. As companies weigh the return on investment, apprehension regarding longer-term profitability and scalability slows universal metaverse implementation. These cost factors remain a primary setback in the shift from e-commerce to virtual immersive experiences.
Metaverse In E-commerce Market Opportunities
-
AI-Driven Personalization Enhances Metaverse E-Commerce with Smart Avatars, Data-Backed Recommendations, and Predictive Analytics for Better Customer Engagement and Conversions.
AI-powered avatars and recommendation systems are revolutionizing online retailing by providing hyper-personalized experiences. Based on analyzing customer interests, purchase history, and browsing activities, AI helps businesses provide customized product recommendations, leading to enhanced engagement and conversion. Big data-powered virtual assistants optimize decision-making, leading consumers through immersive digital stores with real-time suggestions. Such high levels of customization not only increase customer satisfaction but also reinforce brand loyalty. With advancing AI, predictive analytics and machine learning streamline personalization approaches, developing effortless, intuitive shopping experiences. With increasing needs for personalized experiences, companies utilizing AI and big data can create new revenue opportunities and improve customer loyalty in the changing metaverse e-commerce ecosystem.
Metaverse In E-commerce Market Challenges
-
Strengthening Consumer Trust in Metaverse E-Commerce Amid Rising Privacy and Security Concerns
Virtual shopping experiences are threatened by data breaches, cyber fraud, and identity theft, causing consumers to be cautious of metaverse transactions. As virtual interactions intensify, the immense volume of financial and personal data shared across online spaces falls within the range of cyberattack objectives. Loose security protocols will enable unauthorized use, fake transactions, and disclosure of sensitive user information, discrediting commerce on the metaverse. Strong encryption, decentralized verification, and blockchain-based safety controls must be established by firms to protect user data. Stronger privacy laws and transparency in data management are the key to addressing these issues. Proactive action against cybersecurity threats will be the key to building consumer trust and facilitating large-scale adoption of metaverse-based e-commerce platforms.
Metaverse In E-commerce Market Segment Analysis
By Application, Virtual Events Dominated the 2025 Metaverse E-commerce Market, While Virtual Stores Will Grow Fastest Through 2033.
Virtual Events segment domainted the Metaverse in E-commerce Market with the largest revenue share of nearly 78% in 2025. Interactive digital experiences, brand-hosted virtual launches, and live shopping events grew its popularity. Companies used metaverse platforms to build engaging, large-scale product displays, influencer partnerships, and real-time customer interactions. Ease of replicating physical event experiences in a virtual environment, with cost effectiveness and global reach, led to virtual events being the go-to option both for retailers and customers, leading to huge revenue expansion.
Virtual Stores segment is predicted to expand at the fastest CAGR of approximately 47.89% between the years 2026-2033. Growing use of AR and VR-based shopping experience is driving this accelerated growth. Consumers seek highly interactive and personalized shopping environments, where they can explore products in 3D, try on virtual apparel, and experience lifelike store interactions. Businesses are investing heavily in virtual storefronts to enhance engagement and drive conversions. As technology advances and adoption increases, virtual stores are set to revolutionize digital commerce.
By Technology, AR/VR Led the Technology Segment in 2025, With Edge Computing Set for the Fastest Growth by 2033.
Virtual Reality (VR) & Augmented Reality (AR) segment held the largest revenue share in the Metaverse in E-commerce Market with around 41% share in 2025. The use of AR and VR technologies across the globe in e-commerce boosted customer interaction through engaging product experiences, virtual trials, and 3D visualization. Retailers utilized these technologies to fill the void between offline and online shopping, minimizing return rates and maximizing conversions. The increasing consumer demand for immersive and interactive online shopping experiences cemented AR and VR's market dominance.
Edge Computing segment will expand at the fastest CAGR of approximately 48.53% during 2026-2033. The rising demand for low-latency processing and real-time data analysis in metaverse-based shopping experiences is fueling this growth. Edge computing facilitates quicker and more effective virtual interaction through data processing nearer to the user, minimizing lag and maximizing immersive experiences. With e-commerce platforms fusing AI, VR, and AR, the need for high-speed, decentralized computing solutions keeps growing, rendering edge computing an essential facilitator of metaverse-commerce.
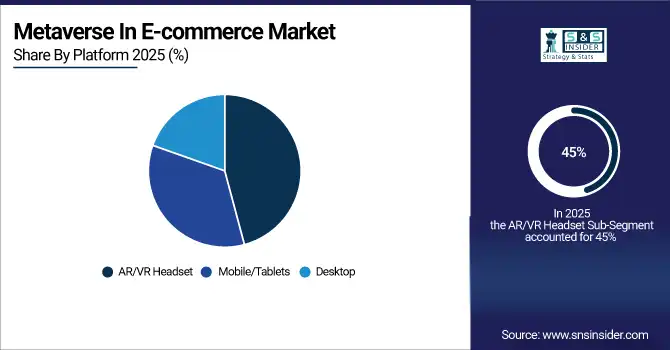
By Platform, AR/VR Headsets Held the Largest Share in 2025, While Mobile/Tablets Will Experience the Fastest Growth Through 2033.
AR/VR Headset segment dominated the Metaverse in E-commerce Market with the maximum revenue share of around 45% in 2025. The growing acceptance of AR/VR headsets for immersive e-commerce experiences caused this leadership. These headsets enable customers to navigate virtual malls, test apparel, and handle 3D models, augmenting engagement as well as purchase decisions. Large brands and retailers used AR/VR to offer hyper-realistic shopping experiences and hence the technology was a major part of metaverse commerce. The increased access to advanced headsets further boosted market growth.
Mobile/tablets segment anticipated to expand at the fastest CAGR of approximately 47.45% during 2026-2033. Increasing smartphone and tablet penetration combined with technical advancements in AR applications is fueling high growth. Consumers value mobile-friendly metaverse experiences based on convenience and accessibility. Merchants are aligning platforms with mobile AR shopping, facilitating virtual try-ons and interactive product perspectives without specialized devices. With broader adoption of 5G and enhanced mobile AR capabilities, smartphones and tablets will be the principal gateway for metaverse shopping.
Metaverse In E-commerce Market Regional Analysis
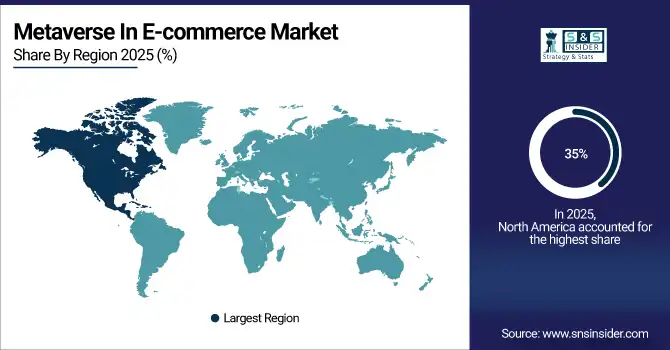
North America Metaverse In E-commerce Market Insights
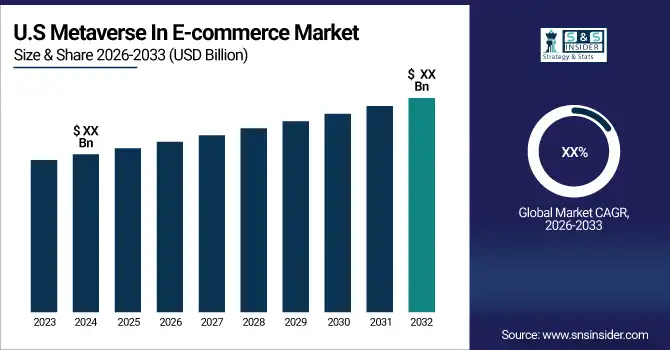
North America dominated the Metaverse in E-commerce Market with the highest revenue share of about 35% in 2025E. The region’s strong technological infrastructure, high consumer spending power, and early adoption of AR, VR, and blockchain technologies contributed to its leadership. Major e-commerce players and tech giants heavily invested in metaverse platforms, driving innovation and market expansion. Additionally, the presence of leading VR headset manufacturers and widespread acceptance of digital transactions further strengthened North America’s position as the dominant market for metaverse commerce.
Get Customized Report as per Your Business Requirement - Enquiry Now
Asia Pacific Metaverse In E-commerce Market Insights
Asia Pacific is expected to grow at the fastest CAGR of about 46.49% from 2026-2033. The rapid digital transformation, increasing internet penetration, and rising smartphone adoption are key growth factors. Consumers in the region are highly engaged in social commerce and mobile shopping, accelerating metaverse adoption. Governments and businesses are investing in AR/VR technologies, and growing e-commerce platforms are integrating metaverse experiences. With a large, tech-savvy population and strong economic growth, Asia Pacific is set to lead the future expansion of metaverse commerce.
Europe Metaverse In E-commerce Market Insights
Europe holds a prominent position in the Metaverse in E-commerce Market, driven by advanced digital infrastructure, high adoption of immersive technologies, and supportive regulatory frameworks. Retailers and brands are leveraging AR/VR, virtual stores, and blockchain to enhance customer experiences and build trust. Countries like Germany, the U.K., and France are leading innovation through collaborations, creating sustainable growth opportunities and shaping the region as a hub for metaverse-driven commerce.
Middle East & Africa and Latin America Metaverse In E-commerce Market Insights
The Middle East & Africa and Latin America are emerging markets for the Metaverse in E-commerce, supported by rising smartphone penetration, improving internet connectivity, and growing digital adoption. Retailers are exploring AR/VR shopping experiences, virtual storefronts, and blockchain-based payment systems to engage tech-savvy consumers. Investments in digital infrastructure and cross-border e-commerce are accelerating adoption, positioning these regions as high-growth frontiers for immersive, next-generation retail experiences.
Metaverse In E-commerce Market Competitive Landscape:
Meta Platforms, Inc.
Meta Platforms, Inc., founded in 2004, is a global leader in social media, digital advertising, and immersive technologies. The company is investing heavily in artificial intelligence, augmented reality (AR), and the metaverse to reshape digital interactions, commerce, and entertainment. Through platforms like Facebook, Instagram, and WhatsApp, Meta continues to influence global communication while expanding into AR/VR for future growth.
-
In October 2024, Meta introduced its Orion smart glasses, a key step in its augmented reality strategy, which integrates AI to offer immersive experiences and opens new opportunities in e-commerce. This technology aims to redefine how users engage with digital content, paving the way for innovative shopping experiences.
NVIDIA Corporation
NVIDIA Corporation, founded in 1993, is a pioneer in graphics processing units (GPUs), AI computing, and accelerated platforms. Known for revolutionizing gaming and high-performance computing, NVIDIA has expanded into data centers, autonomous vehicles, and digital twins. Its innovations in AI and deep learning fuel advancements across industries including healthcare, robotics, and e-commerce, positioning the company as a cornerstone of next-generation computing.
-
In January 2025, NVIDIA expanded its Omniverse platform with generative AI models and blueprints, enhancing physical AI applications in robotics and autonomous vehicles. The updates facilitate faster development of industrial digital twins and immersive virtual environments, helping industries integrate AI-driven solutions in manufacturing, logistics, and e-commerce.
Key Players
Some of the Metaverse In E-commerce Market Companies
-
Amazon.com Inc. (Amazon Web Services, Amazon Sumerian)
-
Alibaba Group (Alibaba Cloud, Taobao Life)
-
Meta Platforms, Inc. (Horizon Worlds, Meta Quest)
-
Tencent Holdings Ltd. (Tencent Cloud, Super QQ Show)
-
Nvidia Corporation (Omniverse, RTX Graphics Cards)
-
Epic Games, Inc. (Fortnite, Unreal Engine)
-
Roblox Corporation (Roblox Studio, Roblox Marketplace)
-
Unity Technologies, Inc. (Unity Engine, Unity Metacast)
-
Nextech AR Solutions Corp. (ARway, HoloX)
-
The Sandbox (Sandbox Game, SAND Token)
-
Decentraland (Decentraland Marketplace, MANA Token)
-
Microsoft Corporation (Mesh for Teams, HoloLens)
-
Antier Solutions Pvt. Ltd. (Metaverse Development, NFT Marketplace Development)
-
Innowise Group (VR Commerce Solutions, Metaverse Store Development)
-
Aetsoft Inc. (Metaverse Platform Development, NFT Marketplace Solutions)
-
Google (Google ARCore, Google Cloud XR)
-
Shopify (Shopify AR, Shopify Virtual Try-On)
-
Magic Leap (Magic Leap 2, Magicverse)
-
HTC Corporation (VIVE VR, VIVERSE)
-
Samsung Electronics (Samsung XR, Gear VR)
-
Infinite Reality (iR) (Metaverse Experience Platform, Digital Twin Solutions)
-
DressX (Digital Fashion Marketplace, AR Wearables)
-
VRChat (VRChat World, VRChat Avatars)
-
Somnium Space (Somnium Web, Somnium VR)
| Report Attributes | Details |
|---|---|
| Market Size in 2025E | USD 18.23 Billion |
| Market Size by 2033 | USD 343.04 Billion |
| CAGR | CAGR of 44.32% From 2026 to 2033 |
| Base Year | 2025E |
| Forecast Period | 2026-2033 |
| Historical Data | 2022-2024 |
| Report Scope & Coverage | Market Size, Segments Analysis, Competitive Landscape, Regional Analysis, DROC & SWOT Analysis, Forecast Outlook |
| Key Segments | • By Platform (Desktop, Mobile/Tablets, AR/VR Headset) • By Technology (Blockchain, Virtual Reality (VR) & Augmented Reality (AR), Edge Computing, Others) • By Application (Virtual Stores, Virtual Events) |
| Regional Analysis/Coverage | North America (US, Canada), Europe (Germany, France, UK, Italy, Spain, Poland, Russsia, Rest of Europe), Asia Pacific (China, India, Japan, South Korea, Australia,ASEAN Countries, Rest of Asia Pacific), Middle East & Africa (UAE, Saudi Arabia, Qatar, South Africa, Rest of Middle East & Africa), Latin America (Brazil, Argentina, Mexico, Colombia Rest of Latin America) |
| Company Profiles | Amazon.com Inc., Alibaba Group, Meta Platforms Inc., Tencent Holdings Ltd., Nvidia Corporation, Epic Games Inc., Roblox Corporation, Unity Technologies Inc., Nextech AR Solutions Corp., The Sandbox, Decentraland, Microsoft Corporation, Antier Solutions Pvt. Ltd., Innowise Group, Aetsoft Inc., Google, Shopify, Magic Leap, HTC Corporation, Samsung Electronics, Infinite Reality (iR), DressX, VRChat, Somnium Space |
