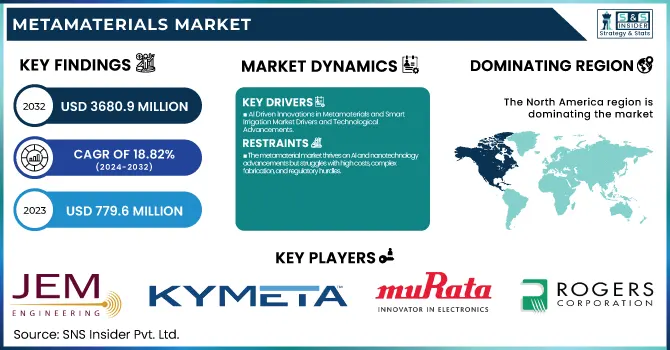
The Metamaterials Market size was valued at USD 779.6 Million in 2023, and expected to reach USD 3680.9 Million by 2032, growing at a CAGR of 18.82 % during 2024-2032. This rapid market growth can be attributed to the growing adoption of technology, especially in industries such as telecommunications, aerospace, healthcare, and automotive, where metamaterials are used to improve signal transmission, radar systems, and energy efficiency. Add to those macroeconomic and geopolitical trends, like government investments in defense and communications infrastructure that are driving demand higher. In particular, advancements in AI and automation integration in metamaterial design and manufacturing are enhancing efficiency and scalability, driving even more growth. In addition, increasing focus towards environmental sustainability is driving the advancement of sustainable, energy-efficient, and recyclable metamaterials products. Lastly, continuous R&D and innovation, supported by substantial funding, are unlocking new applications, solidifying the market’s strong growth trajectory.
AI Driven Innovations in Metamaterials and Smart Irrigation Market Drivers and Technological Advancements
Machine learning and artificial intelligence (AI) driven metamaterial design is another key factor pushing the metamaterial market. AI also makes it possible to optimize the properties of metamaterials to engineer a structure with specific electromagnetic, mechanical and thermal properties. This development speeds up the creation of novel applications in optics, healthcare, acoustics and power systems. AI enables researchers to systematically search vast design spaces, revealing new metamaterials that would have eluded conventional approaches. The synergistic combination of AI and metamaterials can lead not only to enhanced efficiency of current technologies but also to new functionalities, consequently driving the market growth.
The metamaterial market thrives on AI and nanotechnology advancements but struggles with high costs, complex fabrication, and regulatory hurdles.
Metamaterials, engineered to exhibit properties not found in nature, have transformative applications in telecommunications, aerospace, healthcare, and defense. Using their ability to manipulate electromagnetic waves, they can work towards building high-resolution, low-power MRI systems, which could help improve image fidelity while lowering scanning time and costs. Moreover, metamaterial-based biosensors provide high sensitivity for biomarker detection, which enables earlier diagnosis of diseases and more effective treatment protocols. Metamaterials-based non-invasive diagnostic tools can augment the effectiveness of ultrasound and optical imaging with less invasive discomfort to consumers. This technology will be especially helpful for neurology, oncology and cardiovascular diagnostics, areas requiring detailed imaging. With healthcare systems moving towards AI and smart technologies, we expect to see further integration of metamaterials in medical applications. As investment in research and development increases, and demand for high-speed and portable imaging solutions rises, metamaterials have the potential to transform modern healthcare and enhance patient outcomes.
Metamaterials enhance MRI, biosensing, and diagnostics, enabling high-resolution imaging, early disease detection, and better patient outcomes.
Metamaterials are unlocking new possibilities in healthcare by enhancing medical imaging, diagnostics, and biosensing technologies. Their ability to manipulate electromagnetic waves allows for the development of high-resolution, low-power MRI systems, improving image clarity while reducing scanning time and costs. Additionally, metamaterial-based biosensors enable highly sensitive detection of biomarkers, leading to earlier disease diagnosis and more treatment that is effective plans. Non-invasive diagnostic tools leveraging metamaterials enhance the precision of ultrasound and optical imaging, minimizing patient discomfort. These advancements are particularly beneficial for neurology, oncology, and cardiovascular diagnostics, where detailed imaging is crucial. As healthcare systems increasingly adopt AI and smart technologies, the integration of metamaterials in medical applications is expected to accelerate. With growing investment in research and development, alongside rising demand for efficient and portable imaging solutions, metamaterials present a significant opportunity to revolutionize modern healthcare and improve patient outcomes.
High production costs, complex design, scalability issues, regulatory hurdles, and low market awareness hinder the growth of the metamaterial market.
The metamaterial market faces significant challenges, including high production costs due to complex fabrication techniques and specialized materials. Their complex design makes development expensive and time-consuming when using AI-driven tools and a lot of computational resources during development. However, research is well ahead of commercialization, as scaling production and incorporation of metamaterials into real-world applications present significant barriers to their widespread use. Regulations and compliance requirements, labelled significantly in the aerospace, defense, and telecommunications, slow adoption. Moreover, due to lack of standards in various industries, interoperability and implementation widely becomes difficult. Most of these manufacturing approaches cannot be scaled economically to manufacturing volume due production limits. The other pillar has to do with market awareness and the relatively poor knowledge of the benefits and applications of metamaterials in industry. In order to overcome these challenges, the growth of metamaterials and their applications will need investment in and commitment to research, government support, and technological progress toward overcoming fabrication barriers, driving down costs, and increasing the feasibility of mass production, which together will promote the uptake of these materials across multiple industries.
By Product
The electromagnetic segment dominated the Metamaterial Market in 2023, accounting for approximately 40% of revenue. Its dominance is driven by widespread applications in antennas, waveguides, radar systems and next-generation wireless communication technologies, specifically 5G and 6G. Electromagnetic metamaterials enable signal transmission, minimize interference, and increase operational efficiency in sectors, including defense, aerospace, and telecommunications. Their ability to manipulate electromagnetic waves could lead to all kinds of advanced stealth technology in military applications and high-performance imaging in medical diagnostics. The growth is also due to the rise in demand for smaller and more effective antennas in consumer electronics, IoT devices, and satellite communications. Further, AI-powered design tools and computational modeling speed up innovation in this segment as well. While commercialization efforts have faced challenges, ongoing investment in research and collaboration with industry are broadening the range of real-world applications for electromagnetic metamaterials.
The terahertz (THz) segment is the fastest-growing category in the Metamaterial Market, projected to expand significantly over the forecast period from 2024 to 2032. This growth is propelled by the rising acceptance of terahertz metamaterials in various applications such as security screening, medical imaging, and high-speed wireless communication. TERAHERTZ (THz) technology offers numerous advantages, such as penetration into non-conductive materials and non-ionizing ability, making it an excellent candidate for non-destructive imaging and material characterization. Healthcare: In the medical field, THz metamaterials are utilized for high-resolution imaging in early disease detection, including cancer diagnosis, with low radiation exposure. THz-based scanners are also superior in their ability to detect hidden weapons and explosives, helping drive demand from the defense and security sectors. Moreover, the THz segment acts as the backbone of next-generation telecommunications, as 6G technology is expected to utilize THz frequencies for the ultra-high-speed transmission of data. Continued research and technological innovations are expected to drive the rapid growth of the terahertz metamaterial market.
By Application
The antenna segment dominated the Metamaterial Market in 2023, capturing around 45% of total revenue due to its widespread applications in telecommunications, defense, aerospace, and consumer electronics. Metamaterial-based antennas enhance signal strength, minimize interference, and enable compact, lightweight designs, making them essential for next-generation wireless communication. The rapid expansion of 5G and emerging 6G networks has driven demand for high-performance antennas with improved efficiency. In defense, these antennas support stealth technology, advanced radar systems, and secure communications, while the aerospace sector benefits from their lightweight, high-gain capabilities for satellite communication. Additionally, the growing adoption of IoT, smart devices, and autonomous vehicles has further accelerated market expansion. With ongoing innovations and rising investments in advanced communication technologies, the metamaterial antenna segment is expected to maintain its leading position in the coming years.
The absorber segment is the fastest-growing category in the Metamaterial Market, projected to witness significant expansion over the forecast period from 2024 to 2032. This growth is driven by the increasing demand for advanced electromagnetic wave absorption technologies in defense, telecommunications, and automotive sectors. Metamaterial absorbers are widely used in stealth technology for military applications, helping reduce radar cross-section (RCS) and enhancing the invisibility of aircraft, ships, and vehicles. In telecommunications, these absorbers minimize signal interference, improving network efficiency and security. Additionally, their application in automotive radar systems for collision avoidance and autonomous driving is further propelling market growth. The rising need for energy-efficient, lightweight, and broadband absorbers in consumer electronics and satellite communications also contributes to their adoption.
By End Use
The aerospace and defense sector dominated the Metamaterial Market in 2023, accounting for approximately 50% of total revenue due to their extensive use across stealth technology, radar systems, and secure communication. Towards enhancing military stealth capabilities, metamaterials are increasingly deployed to reduce radar cross-section (RCS) in military aircraft, ships, and vehicles. In addition, these materials also enhance radar and sensor performance through high-performance signal absorption and wave manipulation. In aerospace, high-gain antennas based on metamaterials offer lighter, more efficient solutions suitable for satellite communications and avionics to enhance the effectiveness of signal transmission. The increasing focus on advanced surveillance, electronic warfare, and next-generation aircraft has further fueled demand for metamaterial technologies.
The medical segment is the fastest-growing sector in the Metamaterial Market, projected to expand significantly over the forecast period from 2024 to 2032. The market is growing due to the increased use of metamaterials in advanced medical imaging, biosensing, and non-invasive diagnostics. Imaging systems based on metamaterials improve MRI efficiency by increasing the intelligibility of signals, shortening the time of scan, and lowering energy supplies, resulting in better diagnoses. Moreover, metamaterials show extremely high sensitivity in biosensing biomolecules for early disease detection of cancers or neurological diseases. Metamaterials in Non-invasive Wearable Medical Devices Offering patients real-time health monitoring and vastly improving patient outcomes. The growing demand for innovative healthcare solutions, coupled with rising investments in biomedical research and AI-driven metamaterial design, is accelerating adoption.
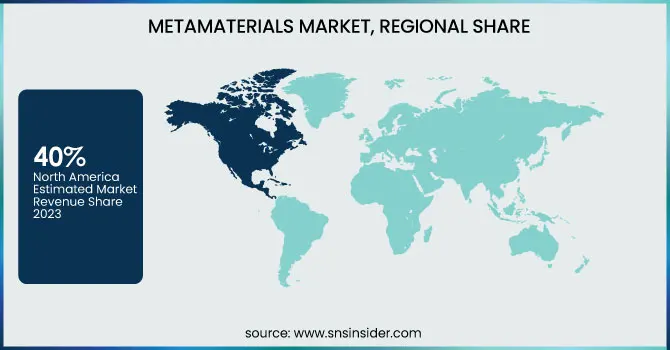
North America dominated the Metamaterial Market in 2023, accounting for approximately 40% of total revenue, due to significant investments in the areas of defense, aerospace, telecommunications, and healthcare applications. The large industrial players, research activities, supported by government funding underpin the regional leadership in the market for advanced metamaterial technologies. For defense, the U.S. military widely uses metamaterials for stealth technology, radar systems and secure communication, and the aerospace domain benefits from lightweight, high-performance antennas for satellite and avionics applications. The high deployment and encouraging implementation of 5G and advanced 6G networks is also driving demand for these kinds of metamaterial-based antennas as well as waveguides.
Asia-Pacific is the fastest-growing region in the Metamaterial Market, expected to witness substantial expansion over the forecast period from 2024 to 2032. Such rapid growth is powered by rising investments in telecommunications, defense, aerospace, and healthcare. The continued research and investment in 5G and next-generation 6G networks by nations including China, Japan, South Korea, and India will drive demand for metamaterial four antennas and waveguides that overcome severe obstacles in signal transmission and interference. On the defense front, governments concentrating on advanced radar systems, stealth technology, and secure communications are spurring the adoption of metamaterials. Metamaterials are also being used by the aerospace industry to create lightweight, high-efficiency antennas and satellite communication systems. The healthcare sector is also flourishing in the region, and diagnostic practices are being enhanced by incorporating metamaterial-based imaging and biosensing technologies.
Metamaterial Technologies Inc. (Canada) – Develops metamaterial-based optical filters, lenses, and smart materials for aerospace and healthcare applications.
JEM Engineering LLC (USA) – Specializes in metamaterial-based antennas for military, aerospace, and commercial communications.
Kymeta Corporation (USA) – Produces metamaterial-based flat-panel satellite antennas for mobile communications.
Microwave Measurement Systems LLC (USA) – Focuses on metamaterial-based microwave components for radar and communication systems.
Applied EM, Inc. (USA) – Designs metamaterial-based electromagnetic solutions, including antennas and stealth technology.
Teraview (UK) – Develops terahertz imaging and sensing systems using metamaterials for medical and security applications.
Alps Electric Co., Ltd. (Japan) – Manufactures metamaterial-based sensors and communication devices for automotive and consumer electronics.
PARC (USA) – Engages in R&D for metamaterial-based photonic and electromagnetic applications.
Echodyne (USA) – Produces metamaterial-based radar systems for defense, aerospace, and autonomous vehicles.
Phoebus Optoelectronics (China) – Specializes in metamaterial-based optical components for imaging and communication.
Meta Materials Inc.
Phomera Metamaterials
Murata Manufacturing
Nanotech Security Corp.
Rogers Corporation
NKT Photonics
Nissan Chemical Corporation
Henkel AG & Co. KGaA
Materion Corporation
DuPont
On March 17, 2025, CA Global Partners announced a Live Webcast Auction of META Material Technologies Inc., scheduled for April 3, 2025, due to bankruptcy proceedings. This auction offers advanced nanocomposite and functional material equipment, including high-value vacuum web coating and deposition systems.
On April 2, 2024, Kymeta announced its search for a strategic integration partner to enter the inflight connectivity market. The company aims to overcome aviation certification challenges by collaborating with an experienced aero partner.
Report Attributes | Details |
---|---|
Market Size in 2023 | USD 779.6 Million |
Market Size by 2032 | USD 3680.9 Million |
CAGR | CAGR of 18.82% From 2024 to 2032 |
Base Year | 2023 |
Forecast Period | 2024-2032 |
Historical Data | 2020-2022 |
Report Scope & Coverage | Market Size, Segments Analysis, Competitive Landscape, Regional Analysis, DROC & SWOT Analysis, Forecast Outlook |
Key Segments | • By Product (Electromagnetic, Terahertz, Photonic, Tunable, Frequency Selective Surface, Non-linear) • By Application (Antenna, Absorber, Superlens, Cloaking Devices, Others) • By End Use (Aerospace & Defense, Medical, Automotive, Consumer Electronics, Energy & Power) |
Regional Analysis/Coverage | North America (US, Canada, Mexico), Europe (Eastern Europe [Poland, Romania, Hungary, Turkey, Rest of Eastern Europe] Western Europe] Germany, France, UK, Italy, Spain, Netherlands, Switzerland, Austria, Rest of Western Europe]), Asia Pacific (China, India, Japan, South Korea, Vietnam, Singapore, Australia, Rest of Asia Pacific), Middle East & Africa (Middle East [UAE, Egypt, Saudi Arabia, Qatar, Rest of Middle East], Africa [Nigeria, South Africa, Rest of Africa], Latin America (Brazil, Argentina, Colombia, Rest of Latin America) |
Company Profiles | Metamaterial Technologies Inc., JEM Engineering LLC, Kymeta Corporation, Microwave Measurement Systems LLC, Applied EM Inc., Teraview, Alps Electric Co. Ltd., PARC, Echodyne, and Phoebus Optoelectronics. |
Ans: The Metamaterials Market is expected to grow at a CAGR of 18.82% during 2024-2032.
Ans: The Metamaterials Market was USD 779.6 Million in 2023 and is expected to Reach USD 3680.9 Million by 2032.
Ans: The key drivers of the metamaterials market include advancements in 5G and wireless communication, increasing demand for radar and satellite systems, growth in aerospace and defense applications, and rising investments in healthcare imaging.
Ans: The “Electromagnetic” segment dominated the Metamaterials Market.
Ans: North America dominated the Metamaterials Market in 2023
Table of Content
1. Introduction
1.1 Market Definition
1.2 Scope (Inclusion and Exclusions)
1.3 Research Assumptions
2. Executive Summary
2.1 Market Overview
2.2 Regional Synopsis
2.3 Competitive Summary
3. Research Methodology
3.1 Top-Down Approach
3.2 Bottom-up Approach
3.3. Data Validation
3.4 Primary Interviews
4. Market Dynamics Impact Analysis
4.1 Market Driving Factors Analysis
4.1.1 Drivers
4.1.2 Restraints
4.1.3 Opportunities
4.1.4 Challenges
4.2 PESTLE Analysis
4.3 Porter’s Five Forces Model
5. Statistical Insights and Trends Reporting
5.1 Technology Adoption
5.2 Macroeconomic & Geopolitical Factors
5.3 AI & Automation in Metamaterials
5.4 Environmental & Sustainability Metrics
5.5 Innovation and R&D
6. Competitive Landscape
6.1 List of Major Companies, By Region
6.2 Market Share Analysis, By Region
6.3 Product Benchmarking
6.3.1 Product specifications and features
6.3.2 Pricing
6.4 Strategic Initiatives
6.4.1 Marketing and promotional activities
6.4.2 Distribution and supply chain strategies
6.4.3 Expansion plans and new product launches
6.4.4 Strategic partnerships and collaborations
6.5 Technological Advancements
6.6 Market Positioning and Branding
7. Metamaterials Market Segmentation, by Type
7.1 Chapter Overview
7.2 Electromagnetic
7.2.1 Electromagnetic Market Trends Analysis (2020-2032)
7.2.2 Electromagnetic Market Size Estimates and Forecasts to 2032 (USD Million)
7.3 Terahertz
7.3.1 Terahertz Market Trends Analysis (2020-2032)
7.3.2 Terahertz Market Size Estimates and Forecasts to 2032 (USD Million)
7.4 Photonic
7.4.1 Photonic Market Trends Analysis (2020-2032)
7.4.2 Photonic Market Size Estimates and Forecasts to 2032 (USD Million)
7.5 Tunable
7.5.1 Tunable Market Trends Analysis (2020-2032)
7.5.2 Tunable Market Size Estimates and Forecasts to 2032 (USD Million)
7.6 Frequency Selective Surface
7.5.1 Frequency Selective Surface Market Trends Analysis (2020-2032)
7.5.2 Frequency Selective Surface Market Size Estimates and Forecasts to 2032 (USD Million)
7.7 Non-linear
7.5.1 Non-linear Market Trends Analysis (2020-2032)
7.5.2 Non-linear Market Size Estimates and Forecasts to 2032 (USD Million)
8. Metamaterials Market Segmentation, by Application
8.1 Chapter Overview
8.2 Antenna
8.2.1 Antenna Market Trends Analysis (2020-2032)
8.2.2 Antenna Market Size Estimates and Forecasts to 2032 (USD Million)
8.3 Absorber
8.3.1 Absorber Market Trends Analysis (2020-2032)
8.3.2 Absorber Market Size Estimates and Forecasts to 2032 (USD Million)
8.4 Superlens
8.4.1 Superlens Market Trends Analysis (2020-2032)
8.4.2 Superlens Market Size Estimates and Forecasts to 2032 (USD Million)
8.5 Cloaking Devices
8.5.1 Cloaking Devices Market Trends Analysis (2020-2032)
8.5.2 Cloaking Devices Market Size Estimates and Forecasts to 2032 (USD Million)
8.6 Others
8.6.1 Others Market Trends Analysis (2020-2032)
8.6.2 Others Market Size Estimates and Forecasts to 2032 (USD Million)
9. Metamaterials Market Segmentation, by End Use
9.1 Chapter Overview
9.2 Aerospace & Defense
9.2.1 Aerospace & Defense Market Trends Analysis (2020-2032)
9.2.2 Aerospace & Defense Market Size Estimates and Forecasts to 2032 (USD Million)
9.3 Medical
9.3.1 Medical Market Trends Analysis (2020-2032)
9.3.2 Medical Market Size Estimates and Forecasts to 2032 (USD Million)
9.4 Automotive
9.4.1 Automotive Market Trends Analysis (2020-2032)
9.4.2 Automotive Market Size Estimates and Forecasts to 2032 (USD Million)
9.5 Consumer Electronics
9.5.1 Consumer Electronics Market Trends Analysis (2020-2032)
9.5.2 Consumer Electronics Market Size Estimates and Forecasts to 2032 (USD Million)
9.6 Energy & Power
9.6.1 Energy & Power Market Trends Analysis (2020-2032)
9.6.2 Energy & Power Market Size Estimates and Forecasts to 2032 (USD Million)
10. Regional Analysis
10.1 Chapter Overview
10.2 North America
10.2.1 Trends Analysis
10.2.2 North America Metamaterials Market Estimates and Forecasts, by Country (2020-2032) (USD Million)
10.2.3 North America Metamaterials Market Estimates and Forecasts, by Product (2020-2032) (USD Million)
10.2.4 North America Metamaterials Market Estimates and Forecasts, by Application (2020-2032) (USD Million)
10.2.5 North America Metamaterials Market Estimates and Forecasts, by End Use (2020-2032) (USD Million)
10.2.6 USA
10.2.6.1 USA Metamaterials Market Estimates and Forecasts, by Product (2020-2032) (USD Million)
10.2.6.2 USA Metamaterials Market Estimates and Forecasts, by Application (2020-2032) (USD Million)
10.2.6.3 USA Metamaterials Market Estimates and Forecasts, by End Use (2020-2032) (USD Million)
10.2.7 Canada
10.2.7.1 Canada Metamaterials Market Estimates and Forecasts, by Product (2020-2032) (USD Million)
10.2.7.2 Canada Metamaterials Market Estimates and Forecasts, by Application (2020-2032) (USD Million)
10.2.7.3 Canada Metamaterials Market Estimates and Forecasts, by End Use (2020-2032) (USD Million)
10.2.8 Mexico
10.2.8.1 Mexico Metamaterials Market Estimates and Forecasts, by Product (2020-2032) (USD Million)
10.2.8.2 Mexico Metamaterials Market Estimates and Forecasts, by Application (2020-2032) (USD Million)
10.2.8.3 Mexico Metamaterials Market Estimates and Forecasts, by End Use (2020-2032) (USD Million)
10.3 Europe
10.3.1 Eastern Europe
10.3.1.1 Trends Analysis
10.3.1.2 Eastern Europe Metamaterials Market Estimates and Forecasts, by Country (2020-2032) (USD Million)
10.3.1.3 Eastern Europe Metamaterials Market Estimates and Forecasts, by Product (2020-2032) (USD Million)
10.3.1.4 Eastern Europe Metamaterials Market Estimates and Forecasts, by Application (2020-2032) (USD Million)
10.3.1.5 Eastern Europe Metamaterials Market Estimates and Forecasts, by End Use (2020-2032) (USD Million)
10.3.1.6 Poland
10.3.1.6.1 Poland Metamaterials Market Estimates and Forecasts, by Product (2020-2032) (USD Million)
10.3.1.6.2 Poland Metamaterials Market Estimates and Forecasts, by Application (2020-2032) (USD Million)
10.3.1.6.3 Poland Metamaterials Market Estimates and Forecasts, by End Use (2020-2032) (USD Million)
10.3.1.7 Romania
10.3.1.7.1 Romania Metamaterials Market Estimates and Forecasts, by Product (2020-2032) (USD Million)
10.3.1.7.2 Romania Metamaterials Market Estimates and Forecasts, by Application (2020-2032) (USD Million)
10.3.1.7.3 Romania Metamaterials Market Estimates and Forecasts, by End Use (2020-2032) (USD Million)
10.3.1.8 Hungary
10.3.1.8.1 Hungary Metamaterials Market Estimates and Forecasts, by Product (2020-2032) (USD Million)
10.3.1.8.2 Hungary Metamaterials Market Estimates and Forecasts, by Application (2020-2032) (USD Million)
10.3.1.8.3 Hungary Metamaterials Market Estimates and Forecasts, by End Use (2020-2032) (USD Million)
10.3.1.9 Turkey
10.3.1.9.1 Turkey Metamaterials Market Estimates and Forecasts, by Product (2020-2032) (USD Million)
10.3.1.9.2 Turkey Metamaterials Market Estimates and Forecasts, by Application (2020-2032) (USD Million)
10.3.1.9.3 Turkey Metamaterials Market Estimates and Forecasts, by End Use (2020-2032) (USD Million)
10.3.1.10 Rest of Eastern Europe
10.3.1.10.1 Rest of Eastern Europe Metamaterials Market Estimates and Forecasts, by Product (2020-2032) (USD Million)
10.3.1.10.2 Rest of Eastern Europe Metamaterials Market Estimates and Forecasts, by Application (2020-2032) (USD Million)
10.3.1.10.3 Rest of Eastern Europe Metamaterials Market Estimates and Forecasts, by End Use (2020-2032) (USD Million)
10.3.2 Western Europe
10.3.2.1 Trends Analysis
10.3.2.2 Western Europe Metamaterials Market Estimates and Forecasts, by Country (2020-2032) (USD Million)
10.3.2.3 Western Europe Metamaterials Market Estimates and Forecasts, by Product (2020-2032) (USD Million)
10.3.2.4 Western Europe Metamaterials Market Estimates and Forecasts, by Application (2020-2032) (USD Million)
10.3.2.5 Western Europe Metamaterials Market Estimates and Forecasts, by End Use (2020-2032) (USD Million)
10.3.2.6 Germany
10.3.2.6.1 Germany Metamaterials Market Estimates and Forecasts, by Product (2020-2032) (USD Million)
10.3.2.6.2 Germany Metamaterials Market Estimates and Forecasts, by Application (2020-2032) (USD Million)
10.3.2.6.3 Germany Metamaterials Market Estimates and Forecasts, by End Use (2020-2032) (USD Million)
10.3.2.7 France
10.3.2.7.1 France Metamaterials Market Estimates and Forecasts, by Product (2020-2032) (USD Million)
10.3.2.7.2 France Metamaterials Market Estimates and Forecasts, by Application (2020-2032) (USD Million)
10.3.2.7.3 France Metamaterials Market Estimates and Forecasts, by End Use (2020-2032) (USD Million)
10.3.2.8 UK
10.3.2.8.1 UK Metamaterials Market Estimates and Forecasts, by Product (2020-2032) (USD Million)
10.3.2.8.2 UK Metamaterials Market Estimates and Forecasts, by Application (2020-2032) (USD Million)
10.3.2.8.3 UK Metamaterials Market Estimates and Forecasts, by End Use (2020-2032) (USD Million)
10.3.2.9 Italy
10.3.2.9.1 Italy Metamaterials Market Estimates and Forecasts, by Product (2020-2032) (USD Million)
10.3.2.9.2 Italy Metamaterials Market Estimates and Forecasts, by Application (2020-2032) (USD Million)
10.3.2.9.3 Italy Metamaterials Market Estimates and Forecasts, by End Use (2020-2032) (USD Million)
10.3.2.10 Spain
10.3.2.10.1 Spain Metamaterials Market Estimates and Forecasts, by Product (2020-2032) (USD Million)
10.3.2.10.2 Spain Metamaterials Market Estimates and Forecasts, by Application (2020-2032) (USD Million)
10.3.2.10.3 Spain Metamaterials Market Estimates and Forecasts, by End Use (2020-2032) (USD Million)
10.3.2.11 Netherlands
10.3.2.11.1 Netherlands Metamaterials Market Estimates and Forecasts, by Product (2020-2032) (USD Million)
10.3.2.11.2 Netherlands Metamaterials Market Estimates and Forecasts, by Application (2020-2032) (USD Million)
10.3.2.11.3 Netherlands Metamaterials Market Estimates and Forecasts, by End Use (2020-2032) (USD Million)
10.3.2.12 Switzerland
10.3.2.12.1 Switzerland Metamaterials Market Estimates and Forecasts, by Product (2020-2032) (USD Million)
10.3.2.12.2 Switzerland Metamaterials Market Estimates and Forecasts, by Application (2020-2032) (USD Million)
10.3.2.12.3 Switzerland Metamaterials Market Estimates and Forecasts, by End Use (2020-2032) (USD Million)
10.3.2.13 Austria
10.3.2.13.1 Austria Metamaterials Market Estimates and Forecasts, by Product (2020-2032) (USD Million)
10.3.2.13.2 Austria Metamaterials Market Estimates and Forecasts, by Application (2020-2032) (USD Million)
10.3.2.13.3 Austria Metamaterials Market Estimates and Forecasts, by End Use (2020-2032) (USD Million)
10.3.2.14 Rest of Western Europe
10.3.2.14.1 Rest of Western Europe Metamaterials Market Estimates and Forecasts, by Product (2020-2032) (USD Million)
10.3.2.14.2 Rest of Western Europe Metamaterials Market Estimates and Forecasts, by Application (2020-2032) (USD Million)
10.3.2.14.3 Rest of Western Europe Metamaterials Market Estimates and Forecasts, by End Use (2020-2032) (USD Million)
10.4 Asia-Pacific
10.4.1 Trends Analysis
10.4.2 Asia-Pacific Metamaterials Market Estimates and Forecasts, by Country (2020-2032) (USD Million)
10.4.3 Asia-Pacific Metamaterials Market Estimates and Forecasts, by Product (2020-2032) (USD Million)
10.4.4 Asia-Pacific Metamaterials Market Estimates and Forecasts, by Application (2020-2032) (USD Million)
10.4.5 Asia-Pacific Metamaterials Market Estimates and Forecasts, by End Use (2020-2032) (USD Million)
10.4.6 China
10.4.6.1 China Metamaterials Market Estimates and Forecasts, by Product (2020-2032) (USD Million)
10.4.6.2 China Metamaterials Market Estimates and Forecasts, by Application (2020-2032) (USD Million)
10.4.6.3 China Metamaterials Market Estimates and Forecasts, by End Use (2020-2032) (USD Million)
10.4.7 India
10.4.7.1 India Metamaterials Market Estimates and Forecasts, by Product (2020-2032) (USD Million)
10.4.7.2 India Metamaterials Market Estimates and Forecasts, by Application (2020-2032) (USD Million)
10.4.7.3 India Metamaterials Market Estimates and Forecasts, by End Use (2020-2032) (USD Million)
10.4.8 Japan
10.4.8.1 Japan Metamaterials Market Estimates and Forecasts, by Product (2020-2032) (USD Million)
10.4.8.2 Japan Metamaterials Market Estimates and Forecasts, by Application (2020-2032) (USD Million)
10.4.8.3 Japan Metamaterials Market Estimates and Forecasts, by End Use (2020-2032) (USD Million)
10.4.9 South Korea
10.4.9.1 South Korea Metamaterials Market Estimates and Forecasts, by Product (2020-2032) (USD Million)
10.4.9.2 South Korea Metamaterials Market Estimates and Forecasts, by Application (2020-2032) (USD Million)
10.4.9.3 South Korea Metamaterials Market Estimates and Forecasts, by End Use (2020-2032) (USD Million)
10.4.10 Vietnam
10.4.10.1 Vietnam Metamaterials Market Estimates and Forecasts, by Product (2020-2032) (USD Million)
10.4.10.2 Vietnam Metamaterials Market Estimates and Forecasts, by Application (2020-2032) (USD Million)
10.4.10.3 Vietnam Metamaterials Market Estimates and Forecasts, by End Use (2020-2032) (USD Million)
10.4.11 Singapore
10.4.11.1 Singapore Metamaterials Market Estimates and Forecasts, by Product (2020-2032) (USD Million)
10.4.11.2 Singapore Metamaterials Market Estimates and Forecasts, by Application (2020-2032) (USD Million)
10.4.11.3 Singapore Metamaterials Market Estimates and Forecasts, by End Use (2020-2032) (USD Million)
10.4.12 Australia
10.4.12.1 Australia Metamaterials Market Estimates and Forecasts, by Product (2020-2032) (USD Million)
10.4.12.2 Australia Metamaterials Market Estimates and Forecasts, by Application (2020-2032) (USD Million)
10.4.12.3 Australia Metamaterials Market Estimates and Forecasts, by End Use (2020-2032) (USD Million)
10.4.13 Rest of Asia-Pacific
10.4.13.1 Rest of Asia-Pacific Metamaterials Market Estimates and Forecasts, by Product (2020-2032) (USD Million)
10.4.13.2 Rest of Asia-Pacific Metamaterials Market Estimates and Forecasts, by Application (2020-2032) (USD Million)
10.4.13.3 Rest of Asia-Pacific Metamaterials Market Estimates and Forecasts, by End Use (2020-2032) (USD Million)
10.5 Middle East and Africa
10.5.1 Middle East
10.5.1.1 Trends Analysis
10.5.1.2 Middle East Metamaterials Market Estimates and Forecasts, by Country (2020-2032) (USD Million)
10.5.1.3 Middle East Metamaterials Market Estimates and Forecasts, by Product (2020-2032) (USD Million)
10.5.1.4 Middle East Metamaterials Market Estimates and Forecasts, by Application (2020-2032) (USD Million)
10.5.1.5 Middle East Metamaterials Market Estimates and Forecasts, by End Use (2020-2032) (USD Million)
10.5.1.6 UAE
10.5.1.6.1 UAE Metamaterials Market Estimates and Forecasts, by Product (2020-2032) (USD Million)
10.5.1.6.2 UAE Metamaterials Market Estimates and Forecasts, by Application (2020-2032) (USD Million)
10.5.1.6.3 UAE Metamaterials Market Estimates and Forecasts, by End Use (2020-2032) (USD Million)
10.5.1.7 Egypt
10.5.1.7.1 Egypt Metamaterials Market Estimates and Forecasts, by Product (2020-2032) (USD Million)
10.5.1.7.2 Egypt Metamaterials Market Estimates and Forecasts, by Application (2020-2032) (USD Million)
10.5.1.7.3 Egypt Metamaterials Market Estimates and Forecasts, by End Use (2020-2032) (USD Million)
10.5.1.8 Saudi Arabia
10.5.1.8.1 Saudi Arabia Metamaterials Market Estimates and Forecasts, by Product (2020-2032) (USD Million)
10.5.1.8.2 Saudi Arabia Metamaterials Market Estimates and Forecasts, by Application (2020-2032) (USD Million)
10.5.1.8.3 Saudi Arabia Metamaterials Market Estimates and Forecasts, by End Use (2020-2032) (USD Million)
10.5.1.9 Qatar
10.5.1.9.1 Qatar Metamaterials Market Estimates and Forecasts, by Product (2020-2032) (USD Million)
10.5.1.9.2 Qatar Metamaterials Market Estimates and Forecasts, by Application (2020-2032) (USD Million)
10.5.1.9.3 Qatar Metamaterials Market Estimates and Forecasts, by End Use (2020-2032) (USD Million)
10.5.1.10 Rest of Middle East
10.5.1.10.1 Rest of Middle East Metamaterials Market Estimates and Forecasts, by Product (2020-2032) (USD Million)
10.5.1.10.2 Rest of Middle East Metamaterials Market Estimates and Forecasts, by Application (2020-2032) (USD Million)
10.5.1.10.3 Rest of Middle East Metamaterials Market Estimates and Forecasts, by End Use (2020-2032) (USD Million)
10.5.2 Africa
10.5.2.1 Trends Analysis
10.5.2.2 Africa Metamaterials Market Estimates and Forecasts, by Country (2020-2032) (USD Million)
10.5.2.3 Africa Metamaterials Market Estimates and Forecasts, by Product (2020-2032) (USD Million)
10.5.2.4 Africa Metamaterials Market Estimates and Forecasts, by Application (2020-2032) (USD Million)
10.5.2.5 Africa Metamaterials Market Estimates and Forecasts, by End Use (2020-2032) (USD Million)
10.5.2.6 South Africa
10.5.2.6.1 South Africa Metamaterials Market Estimates and Forecasts, by Product (2020-2032) (USD Million)
10.5.2.6.2 South Africa Metamaterials Market Estimates and Forecasts, by Application (2020-2032) (USD Million)
10.5.2.6.3 South Africa Metamaterials Market Estimates and Forecasts, by End Use (2020-2032) (USD Million)
10.5.2.7 Nigeria
10.5.2.7.1 Nigeria Metamaterials Market Estimates and Forecasts, by Product (2020-2032) (USD Million)
10.5.2.7.2 Nigeria Metamaterials Market Estimates and Forecasts, by Application (2020-2032) (USD Million)
10.5.2.7.3 Nigeria Metamaterials Market Estimates and Forecasts, by End Use (2020-2032) (USD Million)
10.5.2.8 Rest of Africa
10.5.2.8.1 Rest of Africa Metamaterials Market Estimates and Forecasts, by Product (2020-2032) (USD Million)
10.5.2.8.2 Rest of Africa Metamaterials Market Estimates and Forecasts, by Application (2020-2032) (USD Million)
10.5.2.8.3 Rest of Africa Metamaterials Market Estimates and Forecasts, by End Use (2020-2032) (USD Million)
10.6 Latin America
10.6.1 Trends Analysis
10.6.2 Latin America Metamaterials Market Estimates and Forecasts, by Country (2020-2032) (USD Million)
10.6.3 Latin America Metamaterials Market Estimates and Forecasts, by Product (2020-2032) (USD Million)
10.6.4 Latin America Metamaterials Market Estimates and Forecasts, by Application (2020-2032) (USD Million)
10.6.5 Latin America Metamaterials Market Estimates and Forecasts, by End Use (2020-2032) (USD Million)
10.6.6 Brazil
10.6.6.1 Brazil Metamaterials Market Estimates and Forecasts, by Product (2020-2032) (USD Million)
10.6.6.2 Brazil Metamaterials Market Estimates and Forecasts, by Application (2020-2032) (USD Million)
10.6.6.3 Brazil Metamaterials Market Estimates and Forecasts, by End Use (2020-2032) (USD Million)
10.6.7 Argentina
10.6.7.1 Argentina Metamaterials Market Estimates and Forecasts, by Product (2020-2032) (USD Million)
10.6.7.2 Argentina Metamaterials Market Estimates and Forecasts, by Application (2020-2032) (USD Million)
10.6.7.3 Argentina Metamaterials Market Estimates and Forecasts, by End Use (2020-2032) (USD Million)
10.6.8 Colombia
10.6.8.1 Colombia Metamaterials Market Estimates and Forecasts, by Product (2020-2032) (USD Million)
10.6.8.2 Colombia Metamaterials Market Estimates and Forecasts, by Application (2020-2032) (USD Million)
10.6.8.3 Colombia Metamaterials Market Estimates and Forecasts, by End Use (2020-2032) (USD Million)
10.6.9 Rest of Latin America
10.6.9.1 Rest of Latin America Metamaterials Market Estimates and Forecasts, by Product (2020-2032) (USD Million)
10.6.9.2 Rest of Latin America Metamaterials Market Estimates and Forecasts, by Application (2020-2032) (USD Million)
10.6.9.3 Rest of Latin America Metamaterials Market Estimates and Forecasts, by End Use (2020-2032) (USD Million)
11. Company Profiles
11.1 Metamaterial Technologies Inc.
11.1.1 Company Overview
11.1.2 Financial
11.1.3 Products/ Services Offered
11.1.4 SWOT Analysis
11.2 JEM Engineering LLC
11.2.1 Company Overview
11.2.2 Financial
11.2.3 Products/ Services Offered
11.2.4 SWOT Analysis
11.3 JEM Engineering LLC
11.3.1 Company Overview
11.3.2 Financial
11.3.3 Products/ Services Offered
11.3.4 SWOT Analysis
11.4 Microwave Measurement Systems LLC
11.4.1 Company Overview
11.4.2 Financial
11.4.3 Products/ Services Offered
11.4.4 SWOT Analysis
11.5 Applied EM Inc.
11.5.1 Company Overview
11.5.2 Financial
11.5.3 Products/ Services Offered
11.5.4 SWOT Analysis
11.6 Teraview
11.6.1 Company Overview
11.6.2 Financial
11.6.3 Products/ Services Offered
11.6.4 SWOT Analysis
11.7 Alps Electric Co. Ltd.
11.7.1 Company Overview
11.7.2 Financial
11.7.3 Products/ Services Offered
11.7.4 SWOT Analysis
11.8 PARC
11.8.1 Company Overview
11.8.2 Financial
11.8.3 Products/ Services Offered
11.8.4 SWOT Analysis
11.9 Echodyne
11.9.1 Company Overview
11.9.2 Financial
11.9.3 Products/ Services Offered
11.9.4 SWOT Analysis
11.10 Phoebus
11.10.1 Company Overview
11.10.2 Financial
11.10.3 Products/ Services Offered
11.10.4 SWOT Analysis
12. Use Cases and Best Practices
13. Conclusion
An accurate research report requires proper strategizing as well as implementation. There are multiple factors involved in the completion of good and accurate research report and selecting the best methodology to compete the research is the toughest part. Since the research reports we provide play a crucial role in any company’s decision-making process, therefore we at SNS Insider always believe that we should choose the best method which gives us results closer to reality. This allows us to reach at a stage wherein we can provide our clients best and accurate investment to output ratio.
Each report that we prepare takes a timeframe of 350-400 business hours for production. Starting from the selection of titles through a couple of in-depth brain storming session to the final QC process before uploading our titles on our website we dedicate around 350 working hours. The titles are selected based on their current market cap and the foreseen CAGR and growth.
The 5 steps process:
Step 1: Secondary Research:
Secondary Research or Desk Research is as the name suggests is a research process wherein, we collect data through the readily available information. In this process we use various paid and unpaid databases which our team has access to and gather data through the same. This includes examining of listed companies’ annual reports, Journals, SEC filling etc. Apart from this our team has access to various associations across the globe across different industries. Lastly, we have exchange relationships with various university as well as individual libraries.
Step 2: Primary Research
When we talk about primary research, it is a type of study in which the researchers collect relevant data samples directly, rather than relying on previously collected data. This type of research is focused on gaining content specific facts that can be sued to solve specific problems. Since the collected data is fresh and first hand therefore it makes the study more accurate and genuine.
We at SNS Insider have divided Primary Research into 2 parts.
Part 1 wherein we interview the KOLs of major players as well as the upcoming ones across various geographic regions. This allows us to have their view over the market scenario and acts as an important tool to come closer to the accurate market numbers. As many as 45 paid and unpaid primary interviews are taken from both the demand and supply side of the industry to make sure we land at an accurate judgement and analysis of the market.
This step involves the triangulation of data wherein our team analyses the interview transcripts, online survey responses and observation of on filed participants. The below mentioned chart should give a better understanding of the part 1 of the primary interview.
Part 2: In this part of primary research the data collected via secondary research and the part 1 of the primary research is validated with the interviews from individual consultants and subject matter experts.
Consultants are those set of people who have at least 12 years of experience and expertise within the industry whereas Subject Matter Experts are those with at least 15 years of experience behind their back within the same space. The data with the help of two main processes i.e., FGDs (Focused Group Discussions) and IDs (Individual Discussions). This gives us a 3rd party nonbiased primary view of the market scenario making it a more dependable one while collation of the data pointers.
Step 3: Data Bank Validation
Once all the information is collected via primary and secondary sources, we run that information for data validation. At our intelligence centre our research heads track a lot of information related to the market which includes the quarterly reports, the daily stock prices, and other relevant information. Our data bank server gets updated every fortnight and that is how the information which we collected using our primary and secondary information is revalidated in real time.
Step 4: QA/QC Process
After all the data collection and validation our team does a final level of quality check and quality assurance to get rid of any unwanted or undesired mistakes. This might include but not limited to getting rid of the any typos, duplication of numbers or missing of any important information. The people involved in this process include technical content writers, research heads and graphics people. Once this process is completed the title gets uploader on our platform for our clients to read it.
Step 5: Final QC/QA Process:
This is the last process and comes when the client has ordered the study. In this process a final QA/QC is done before the study is emailed to the client. Since we believe in giving our clients a good experience of our research studies, therefore, to make sure that we do not lack at our end in any way humanly possible we do a final round of quality check and then dispatch the study to the client.
By Product
Electromagnetic
Terahertz
Photonic
Tunable
Frequency Selective Surface
Non-linear
By Application
Antenna
Absorber
Superlens
Cloaking Devices
Others
By End Use
Aerospace & Defense
Medical
Automotive
Consumer Electronics
Energy & Power
Request for Segment Customization as per your Business Requirement: Segment Customization Request
Regional Coverage:
North America
US
Canada
Mexico
Europe
Eastern Europe
Poland
Romania
Hungary
Turkey
Rest of Eastern Europe
Western Europe
Germany
France
UK
Italy
Spain
Netherlands
Switzerland
Austria
Rest of Western Europe
Asia Pacific
China
India
Japan
South Korea
Vietnam
Singapore
Australia
Rest of Asia Pacific
Middle East & Africa
Middle East
UAE
Egypt
Saudi Arabia
Qatar
Rest of Middle East
Africa
Nigeria
South Africa
Rest of Africa
Latin America
Brazil
Argentina
Colombia
Rest of Latin America
Request for Country Level Research Report: Country Level Customization Request
Available Customization
With the given market data, SNS Insider offers customization as per the company’s specific needs. The following customization options are available for the report:
Detailed Volume Analysis
Criss-Cross segment analysis (e.g. Product X Application)
Competitive Product Benchmarking
Geographic Analysis
Additional countries in any of the regions
Customized Data Representation
Detailed analysis and profiling of additional market players
The LED Drivers Market Size was valued at USD 46.55 Billion in 2023 and is expected to reach USD 105.35 Billion by 2032, and grow at a CAGR of 9.50% over the forecast period 2024-2032
The Military Radar Market Size was valued at USD 15.25 Billion in 2023 and is expected to grow at a CAGR of 4.58% to reach USD 22.81 Billion by 2032.
The RF front-end market size was valued at USD 15.63 billion in 2023 and is expected to grow to USD 34.53 billion by 2032 and grow at a CAGR of 9.21 % over the forecast period of 2024-2032.
The Drone Camera Market Size was valued at USD 14.20 billion in 2023 and is expected to reach USD 145.45 billion by 2032 and grow at a CAGR of 29.5% over the forecast period 2024-2032.
The Shortwave Infrared (SWIR) Market Size valued at USD 502 Million in 2023 and is expecting to grow at a CAGR of 9.10% to reach USD 1093.35 Million by 2032
The Operational Technology Market was valued at USD 179.56 billion in 2023 and is expected to reach USD 369.64 billion by 2032, growing at a CAGR of 8.38% over the forecast period 2024-2032.
Hi! Click one of our member below to chat on Phone