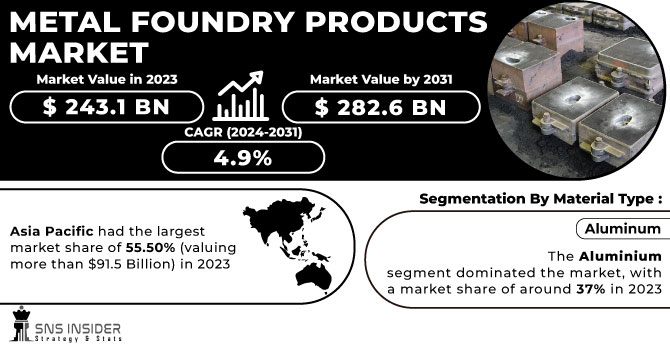
The Metal Foundry Products Market Size was valued at USD 243.1 Billion in 2023 and is now anticipated to grow to USD 282.6 Billion by 2031, displaying a compound annual growth rate (CAGR) of 4.9% during the forecast Period 2024 - 2031.
The Metal foundry products market is growing at a significant rate because of variety of factors. Increasing demand for casting from the automotive sector is expected to drive market growth over the forecast period. The key factors that are driving Metal Casting market are dominantly by automotive and construction industry.
Get More Information on Metal Foundry Products Market - Request Sample Report
Rigid regulations regarding pollution and energy efficiency requirements in vehicles are triggering the growth of the metal casting industry. Regulations have forced automakers to shift to lightweight vehicles to improve fuel efficiency by dominant use of aluminum in their chassis along with sand castings the preferred method. The steel is also growing at a significant rate other than aluminum.
Drivers
A sudden surge in Development of Infrastructure throughout the globe.
The infrastructure development acts as a catalyst for the surge in demand of market for the metal casting industry. As nations globally embark on bold infrastructure projects, the demand for diverse and specialized metal components grows rapidly. Metal casting plays an important role in providing essential parts for infrastructure projects such as bridges, pipelines, and power plants. The versatility of metal casting processes allows for the production of complex and custom components that meet the stringent requirements of modern infrastructure.
Multiple advantages of metal casting technology are pushing towards the market growth.
Lack of alternative process for metal casting.
Restraint
Global Supply Chain disruptions.
Metal foundry industry heavily relies on suppliers for the raw materials, supply chain disruptions might have difficulty in getting raw material on time leading to backlogs and delay in deliveries. When raw material sources face interruptions, the casting companies face problems in maintaining stable production levels thereby meeting contract obligations.
Constant fluctuations in the price of Raw Materials impacting the production cost and overall foundry’s profitability.
Opportunities
An increase in the demand of foundry chemicals in automotive components.
Use of Additive Manufacturing for more complex and detailed production.
Technological improvements in metal casting.
Challenges
Shifting from old manufacturing technologies to more advanced automated technologies and to cope up with these technologies.
Covering up the breakeven point as almost 70% of total cost are direct materials, labor and energy.
The war pushed the price of aluminum to unprecedented levels. There are multiple factors that have impacted aluminum prices. Price spikes on oil had a huge impact not only on aluminum, but on all commodities. Supply Chain disruptions caused due to the Russian invasion resulting in increased cost of shipping operations. The impact of changing national policies on market dynamics, aluminum is one of the biggest emitting industries, China’s aim to achieve net-zero carbon emissions by 2060 has resulted in a reduction in China’s aluminum output
For example, the price of aluminum on the LME (London Metals Exchange) in three-month contract shoots to a record $4,000 a ton in early March 2022, compared to the $3,200 February monthly average of the same year
An economic slowdown can disrupt the Metal Foundry industry and there’s been a drop in the demand of metals so the businesses had to cut back on their investments. An increase in the prices of raw materials has also been seen leading to increased cost of manufacturing. Furthermore, manufacturers might have to prioritize cost-cutting steps to overcome tighter budgets leading to shifting towards cheaper raw materials, potentially impacting the product quality. However, the impact of an economic slowdown is likely to be temporary.
by Material Type
Cast Iron
Aluminum
Stainless Steel
Zinc
Magnesium
The aluminium segment dominated the market, with a market share of around 37% in 2023 which involves the rising adoption of aluminum castings, particularly in the automotive and aerospace sectors. The preference is driven in order to reduce the weight of vehicle, improving fuel efficiency, and aligning with sustainable practices. The aluminum segment, thus, make it most preferred choice in metal casting, meeting the evolving demands for lightweight, durable, and environmentally friendly components.
by Process
Sand Casting
Die Casting
Shell Mold Casting
Gravity Casting
Vacuum Casting
The sand casting segment is dominating the market, with a market share of approximately 43.5% in 2024. Sand casting offers versatility, simplicity, and cost-effectiveness and is suitable for producing components of varying sizes, shapes, and complexities. It offers a straightforward process. The simplicity of sand casting reduces the need for complex equipment and tooling, making it available to a wide range of manufacturers. It uses low cost materials and sand moulds can also be reused for multiple production runs. Sand casting offers versatility to design changes or production volume requirements, allowing for modifications to patterns. It has a wide range of applications ranging from automotive, construction, manufacturing industries and aerospace.
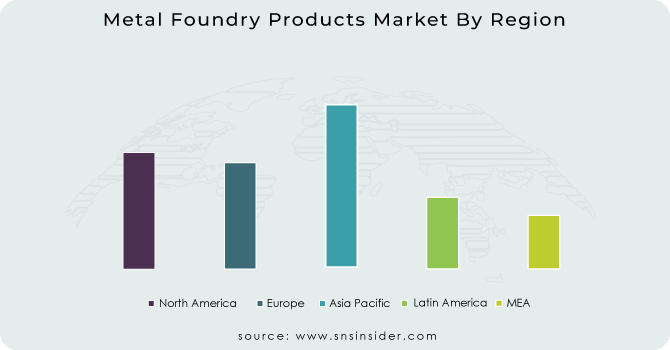
Asia Pacific had the largest market share of 55.50% (valuing more than $91.5 Billion) in 2023 and is maintain its dominant position from 2024 to 2031. the metal casting market due to robust industrialization, substantial automotive production, and rapid infrastructure development. The region's manufacturing prowess, particularly in countries like China and India, has fueled a high demand for metal castings across various sectors. Moreover, the growing emphasis on lightweight materials in automotive manufacturing further amplifies the significance of metal casting processes. The expanding industrial base, coupled with increasing investments in infrastructure, positions Asia-Pacific as a key player in the global metal casting market.
Europe is also assured to have rapid growth in the metal casting market, fueled by advancements in technology and increasing demand for lightweight materials. The European Foundry Industry alone contributes over EUR 40 billion annually. European market has around 4,500 metal casting firms. The European automotive sector, a significant consumer of metal castings, emphasizes fuel efficiency and sustainability, driving the adoption of innovative casting processes. Additionally, initiatives like the European Green Deal promote sustainable practices, creating opportunities for eco-friendly casting methods. With a strong industrial base and a focus on environmental responsibility, Europe is well-positioned for significant expansion in the metal casting market.
Get Customized Report as per your Business Requirement - Request For Customized Report
Regional Outlook
North America
US
Canada
Mexico
Europe
Eastern Europe
Poland
Romania
Hungary
Turkey
Rest of Eastern Europe
Western Europe
Germany
France
UK
Italy
Spain
Netherlands
Switzerland
Austria
Rest of Western Europe
Asia Pacific
China
India
Japan
South Korea
Vietnam
Singapore
Australia
Rest of Asia Pacific
Middle East & Africa
Middle East
UAE
Egypt
Saudi Arabia
Qatar
Rest of the Middle East
Africa
Nigeria
South Africa
Rest of Africa
Latin America
Brazil
Argentina
Colombia
Rest of Latin America
Key Players
The major players are POSCO, Dynacast, Arconic, Ryobi Limited, Endurance Technologies Limited, Alcast Technologies, UNI Abex, MES, Inc., CALMET, Hitachi, Ltd. and others
Arconic-Company Financial Analysis
Additive manufacturing (3D printing) has rapidly developed and it can now be used to work with plethora of materials including metal. This technology also allows companies to create more precise and high quality components as well as products. It can even be used to build large structures. Additive printers can also build complex components and products which traditional casting methods will struggle with.
Automation systems can vastly improve productivity and output while maintaining a high degree of precision and quality. Moreover, besides malfunctioning equipment which can be eliminated by establishing proactive maintenance and care policies automation hardware never grows tired, and it never burns out, unlike human laborers.
In July, 2023: Dynacast introduced A2 thruster machine was developed based on the original A2 but has an increased locking force from 3.3 tons to 5.8 tons. Our A3 SIS is also equipped with a higher locking force but has a new development – the servo hydraulic injection system (SIS). The SIS system has been applied in all of our hydraulic machines since this innovation and it has been very successful.
In February, 2024: Alcast Technologies introduced Plastic Injection moulding machine which can produce customised plastic parts to the exact specifications, scale, volumes and budget.
| Report Attributes | Details |
|---|---|
| Market Size in 2023 | US$ 243.1 Billion |
| Market Size by 2031 | US$ 282.6 Billion |
| CAGR | CAGR of 4.9 % From 2024 to 2031 |
| Base Year | 2023 |
| Forecast Period | 2024-2031 |
| Historical Data | 2020-2022 |
| Report Scope & Coverage | Market Size, Segments Analysis, Competitive Landscape, Regional Analysis, DROC & SWOT Analysis, Forecast Outlook |
| Key Segments | • By Material Type (Cast Iron, Aluminum, Stainless Steel, Zinc, Magnesium) • By Process (Sand Casting, Die Casting, Shell Mold Casting, Gravity Casting, Vacuum Casting) |
| Regional Analysis/Coverage | North America (US, Canada, Mexico), Europe (Eastern Europe [Poland, Romania, Hungary, Turkey, Rest of Eastern Europe] Western Europe] Germany, France, UK, Italy, Spain, Netherlands, Switzerland, Austria, Rest of Western Europe]), Asia Pacific (China, India, Japan, South Korea, Vietnam, Singapore, Australia, Rest of Asia Pacific), Middle East & Africa (Middle East [UAE, Egypt, Saudi Arabia, Qatar, Rest of Middle East], Africa [Nigeria, South Africa, Rest of Africa], Latin America (Brazil, Argentina, Colombia, Rest of Latin America) |
| Company Profiles | POSCO; Dynacast; Arconic; Ryobi Limited; Endurance Technologies Limited; Alcast Technologies; UNI Abex; MES, Inc.; CALMET; Hitachi, Ltd. |
| Key Drivers | • A sudden surge in Development of Infrastructure throughout the globe. • Multiple advantages of metal casting technology are pushing towards the market growth. • Lack of alternative process for metal casting. |
| Restraints | • Global Supply Chain disruptions. • Constant fluctuations in the price of Raw Materials impacting the production cost and overall foundry’s profitability. |
Ans: The Metal Foundry Products Market Share is expected to grow at a CAGR of 7.50%.
Ans: Metal Foundry Products Market size was USD 345.745 billion in 2023 and is expected to Reach USD 621.724 billion by 2031.
Ans: A sudden surge in Development of Infrastructure throughout the globe.
Ans: Constant fluctuations in the price of Raw Materials impacting the production cost and overall foundry’s profitability.
Ans: Asia-Pacific is expected to hold the largest market share in the Metal Foundry Products market during the forecast period.
Table of Contents
1. Introduction
1.1 Market Definition
1.2 Scope
1.3 Research Assumptions
2. Industry Flowchart
3. Research Methodology
4. Market Dynamics
4.1 Drivers
4.2 Restraints
4.3 Opportunities
4.4 Challenges
5. Impact Analysis
5.1 Impact Of Russia Ukraine Crisis
5.2 Impact of Economic Slowdown on Major Countries
5.2.1 Introduction
5.2.2 United States
5.2.3 Canada
5.2.4 Germany
5.2.5 France
5.2.6 UK
5.2.7 China
5.2.8 Japan
5.2.9 South Korea
5.2.10 India
6. Value Chain Analysis
7. Porter’s 5 Forces Model
8. Pest Analysis
9. Metal Foundry Products Market Segmentation, by Material
9.1 Introduction
9.2 Trend Analysis
9.3 Cast Iron
9.4 Aluminium
9.5 Stainless Steel
9.6 Zinc
9.7 Magnesium
10. Metal Foundry Products Market Segmentation, by Process
10.1 Introduction
10.2 Trend Analysis
10.3 Sand Casting Die Casting
10.4 Shell Mold Casting
10.5 Gravity Casting
10.6 Vacuum Casting
11. Regional Analysis
11.1 Introduction
11.2 North America
11.2.1 Trend Analysis
11.2.2 North America Metal Foundry Products Market, by Country
11.2.3 North America Metal Foundry Products Market, by Material
11.2.4 North America Metal Foundry Products Market, by Process
11.2.5 USA
11.2.5.1 USA Metal Foundry Products Market, by Material
11.2.5.2 USA Metal Foundry Products Market, by Process
11.2.6 Canada
11.2.6.1 Canada Metal Foundry Products Market, by Material
11.2.6.2 Canada Metal Foundry Products Market, by Process
11.2.7 Mexico
11.2.7.1 Mexico Metal Foundry Products Market, by Material
11.2.7.2 Mexico Metal Foundry Products Market, by Process
11.3 Europe
11.3.1 Trend Analysis
11.3.2 Eastern Europe
11.3.2.1 Eastern Europe Metal Foundry Products Market, by Country
11.3.2.2 Eastern Europe Metal Foundry Products Market, by Material
11.3.2.3 Eastern Europe Metal Foundry Products Market, by Process
11.3.2.4 Poland
11.3.2.4.1 Poland Metal Foundry Products Market, by Material
11.3.2.4.2 Poland Metal Foundry Products Market, by Process
11.3.2.5 Romania
11.3.2.5.1 Romania Metal Foundry Products Market, by Material
11.3.2.5.2 Romania Metal Foundry Products Market, by Process
11.3.2.6 Hungary
11.3.2.6.1 Hungary Metal Foundry Products Market, by Material
11.3.2.6.2 Hungary Metal Foundry Products Market, by Process
11.3.2.7 Turkey
11.3.2.7.1 Turkey Metal Foundry Products Market, by Material
11.3.2.7.2 Turkey Metal Foundry Products Market, by Process
11.3.2.8 Rest of Eastern Europe
11.3.2.8.1 Rest of Eastern Europe Metal Foundry Products Market, by Material
11.3.2.8.2 Rest of Eastern Europe Metal Foundry Products Market, by Process
11.3.3 Western Europe
11.3.3.1 Western Europe Metal Foundry Products Market, by Country
11.3.3.2 Western Europe Metal Foundry Products Market, by Material
11.3.3.3 Western Europe Metal Foundry Products Market, by Process
11.3.3.4 Germany
11.3.3.4.1 Germany Metal Foundry Products Market, by Material
11.3.3.4.2 Germany Metal Foundry Products Market, by Process
11.3.3.5 France
11.3.3.5.1 France Metal Foundry Products Market, by Material
11.3.3.5.2 France Metal Foundry Products Market, by Process
11.3.3.6 UK
11.3.3.6.1 UK Metal Foundry Products Market, by Material
11.3.3.6.2 UK Metal Foundry Products Market, by Process
11.3.3.7 Italy
11.3.3.7.1 Italy Metal Foundry Products Market, by Material
11.3.3.7.2 Italy Metal Foundry Products Market, by Process
11.3.3.8 Spain
11.3.3.8.1 Spain Metal Foundry Products Market, by Material
11.3.3.8.2 Spain Metal Foundry Products Market, by Process
11.3.3.9 Netherlands
11.3.3.9.1 Netherlands Metal Foundry Products Market, by Material
11.3.3.9.2 Netherlands Metal Foundry Products Market, by Process
11.3.3.10 Switzerland
11.3.3.10.1 Switzerland Metal Foundry Products Market, by Material
11.3.3.10.2 Switzerland Metal Foundry Products Market, by Process
11.3.3.11 Austria
11.3.3.11.1 Austria Metal Foundry Products Market, by Material
11.3.3.11.2 Austria Metal Foundry Products Market, by Process
11.3.3.12 Rest of Western Europe
11.3.3.12.1 Rest of Western Europe Metal Foundry Products Market, by Material
11.3.2.12.2 Rest of Western Europe Metal Foundry Products Market, by Process
11.4 Asia-Pacific
11.4.1 Trend Analysis
11.4.2 Asia Pacific Metal Foundry Products Market, by Country
11.4.3 Asia Pacific Metal Foundry Products Market, by Material
11.4.4 Asia Pacific Metal Foundry Products Market, by Process
11.4.5 China
11.4.5.1 China Metal Foundry Products Market, by Material
11.4.5.2 China Metal Foundry Products Market, by Process
11.4.6 India
11.4.6.1 India Metal Foundry Products Market, by Material
11.4.6.2 India Metal Foundry Products Market, by Process
11.4.7 Japan
11.4.7.1 Japan Metal Foundry Products Market, by Material
11.4.7.2 Japan Metal Foundry Products Market, by Process
11.4.8 South Korea
11.4.8.1 South Korea Metal Foundry Products Market, by Material
11.4.8.2 South Korea Metal Foundry Products Market, by Process
11.4.9 Vietnam
11.4.9.1 Vietnam Metal Foundry Products Market, by Material
11.4.9.2 Vietnam Metal Foundry Products Market, by Process
11.4.10 Singapore
11.4.10.1 Singapore Metal Foundry Products Market, by Material
11.4.10.2 Singapore Metal Foundry Products Market, by Process
11.4.11 Australia
11.4.11.1 Australia Metal Foundry Products Market, by Material
11.4.11.2 Australia Metal Foundry Products Market, by Process
11.4.12 Rest of Asia-Pacific
11.4.12.1 Rest of Asia-Pacific Metal Foundry Products Market, by Material
11.4.12.2 Rest of Asia-Pacific Metal Foundry Products Market, by Process
11.5 Middle East & Africa
11.5.1 Trend Analysis
11.5.2 Middle East
11.5.2.1 Middle East Metal Foundry Products Market, by Country
11.5.2.2 Middle East Metal Foundry Products Market, by Material
11.5.2.3 Middle East Metal Foundry Products Market, by Process
11.5.2.4 UAE
11.5.2.4.1 UAE Metal Foundry Products Market, by Material
11.5.2.4.2 UAE Metal Foundry Products Market, by Process
11.5.2.5 Egypt
11.5.2.5.1 Egypt Metal Foundry Products Market, by Material
11.5.2.5.2 Egypt Metal Foundry Products Market, by Process
11.5.2.6 Saudi Arabia
11.5.2.6.1 Saudi Arabia Metal Foundry Products Market, by Material
11.5.2.6.2 Saudi Arabia Metal Foundry Products Market, by Process
11.5.2.7 Qatar
11.5.2.7.1 Qatar Metal Foundry Products Market, by Material
11.5.2.7.2 Qatar Metal Foundry Products Market, by Process
11.5.2.8 Rest of Middle East
11.5.2.8.1 Rest of Middle East Metal Foundry Products Market, by Material
11.5.2.8.2 Rest of Middle East Metal Foundry Products Market, by Process
11.5.3 Africa
11.5.3.1 Africa Metal Foundry Products Market, by Country
11.5.3.2 Africa Metal Foundry Products Market, by Material
11.5.3.3 Africa Metal Foundry Products Market, by Process
11.5.2.4 Nigeria
11.5.2.4.1 South Africa Metal Foundry Products Market, by Material
11.5.2.4.2 South Africa Metal Foundry Products Market, by Process
11.5.2.5 South Africa
11.5.2.5.1 South Africa Metal Foundry Products Market, by Material
11.5.2.5.2 South Africa Metal Foundry Products Market, by Process
11.5.2.6 Rest of Africa
11.5.2.6.1 Rest of Africa Metal Foundry Products Market, by Material
11.5.2.6.2 Rest of Africa Metal Foundry Products Market, by Process
11.6 Latin America
11.6.1 Trend Analysis
11.6.2 Latin America Metal Foundry Products Market, by Country
11.6.3 Latin America Metal Foundry Products Market, by Material
11.6.4 Latin America Metal Foundry Products Market, by Process
11.6.5 Brazil
11.6.5.1 Brazil Metal Foundry Products Market, by Material
11.6.5.2 Brazil Metal Foundry Products Market, by Process
11.6.6 Argentina
11.6.6.1 Argentina Metal Foundry Products Market, by Material
11.6.6.2 Argentina Metal Foundry Products Market, by Process
11.6.7 Colombia
11.6.7.1 Colombia Metal Foundry Products Market, by Material
11.6.7.2 Colombia Metal Foundry Products Market, by Process
11.6.8 Rest of Latin America
11.6.8.1 Rest of Latin America Metal Foundry Products Market, by Material
11.6.8.2 Rest of Latin America Metal Foundry Products Market, by Process
12. Company Profiles
12.1 POSCO
12.1.1 Company Overview
12.1.2 Financial
12.1.3 Products/ Services Offered
12.1.4 SWOT Analysis
12.1.5 The SNS View
12.2 Dynacast
12.2.1 Company Overview
12.2.2 Financial
12.2.3 Products/ Services Offered
12.2.4 SWOT Analysis
12.2.5 The SNS View
12.3 Arconic
12.3.1 Company Overview
12.3.2 Financial
12.3.3 Products/ Services Offered
12.3.4 SWOT Analysis
12.3.5 The SNS View
12.4 Ryobi Limited
12.4.1 Company Overview
12.4.2 Financial
12.4.3 Products/ Services Offered
12.4.4 SWOT Analysis
12.4.5 The SNS View
12.5 Endurance Technologies Limited
12.5.1 Company Overview
12.5.2 Financial
12.5.3 Products/ Services Offered
12.5.4 SWOT Analysis
12.5.5 The SNS View
12.6 Alcast Technologies
12.6.1 Company Overview
12.6.2 Financial
12.6.3 Products/ Services Offered
12.6.4 SWOT Analysis
12.6.5 The SNS View
12.7 UNI Abex
12.7.1 Company Overview
12.7.2 Financial
12.7.3 Products/ Services Offered
12.7.4 SWOT Analysis
12.7.5 The SNS View
12.8 MES Inc.
12.8.1 Company Overview
12.8.2 Financial
12.8.3 Products/ Services Offered
12.8.4 SWOT Analysis
12.8.5 The SNS View
12.9 CALMET
12.9.1 Company Overview
12.9.2 Financial
12.9.3 Products/ Services Offered
12.9.4 SWOT Analysis
12.9.5 The SNS View
12.10 Hitachi Ltd.
12.10.1 Company Overview
12.10.2 Financial
12.10.3 Products/ Services Offered
12.10.4 SWOT Analysis
12.10.5 The SNS View
13. Competitive Landscape
13.1 Competitive Benchmarking
13.2 Market Share Analysis
13.3 Recent Developments
13.3.1 Industry News
13.3.2 Company News
13.3.3 Mergers & Acquisitions
14. USE Cases And Best Practices
15. Conclusion
An accurate research report requires proper strategizing as well as implementation. There are multiple factors involved in the completion of good and accurate research report and selecting the best methodology to compete the research is the toughest part. Since the research reports we provide play a crucial role in any company’s decision-making process, therefore we at SNS Insider always believe that we should choose the best method which gives us results closer to reality. This allows us to reach at a stage wherein we can provide our clients best and accurate investment to output ratio.
Each report that we prepare takes a timeframe of 350-400 business hours for production. Starting from the selection of titles through a couple of in-depth brain storming session to the final QC process before uploading our titles on our website we dedicate around 350 working hours. The titles are selected based on their current market cap and the foreseen CAGR and growth.
The 5 steps process:
Step 1: Secondary Research:
Secondary Research or Desk Research is as the name suggests is a research process wherein, we collect data through the readily available information. In this process we use various paid and unpaid databases which our team has access to and gather data through the same. This includes examining of listed companies’ annual reports, Journals, SEC filling etc. Apart from this our team has access to various associations across the globe across different industries. Lastly, we have exchange relationships with various university as well as individual libraries.

Step 2: Primary Research
When we talk about primary research, it is a type of study in which the researchers collect relevant data samples directly, rather than relying on previously collected data. This type of research is focused on gaining content specific facts that can be sued to solve specific problems. Since the collected data is fresh and first hand therefore it makes the study more accurate and genuine.
We at SNS Insider have divided Primary Research into 2 parts.
Part 1 wherein we interview the KOLs of major players as well as the upcoming ones across various geographic regions. This allows us to have their view over the market scenario and acts as an important tool to come closer to the accurate market numbers. As many as 45 paid and unpaid primary interviews are taken from both the demand and supply side of the industry to make sure we land at an accurate judgement and analysis of the market.
This step involves the triangulation of data wherein our team analyses the interview transcripts, online survey responses and observation of on filed participants. The below mentioned chart should give a better understanding of the part 1 of the primary interview.

Part 2: In this part of primary research the data collected via secondary research and the part 1 of the primary research is validated with the interviews from individual consultants and subject matter experts.
Consultants are those set of people who have at least 12 years of experience and expertise within the industry whereas Subject Matter Experts are those with at least 15 years of experience behind their back within the same space. The data with the help of two main processes i.e., FGDs (Focused Group Discussions) and IDs (Individual Discussions). This gives us a 3rd party nonbiased primary view of the market scenario making it a more dependable one while collation of the data pointers.
Step 3: Data Bank Validation
Once all the information is collected via primary and secondary sources, we run that information for data validation. At our intelligence centre our research heads track a lot of information related to the market which includes the quarterly reports, the daily stock prices, and other relevant information. Our data bank server gets updated every fortnight and that is how the information which we collected using our primary and secondary information is revalidated in real time.

Step 4: QA/QC Process
After all the data collection and validation our team does a final level of quality check and quality assurance to get rid of any unwanted or undesired mistakes. This might include but not limited to getting rid of the any typos, duplication of numbers or missing of any important information. The people involved in this process include technical content writers, research heads and graphics people. Once this process is completed the title gets uploader on our platform for our clients to read it.
Step 5: Final QC/QA Process:
This is the last process and comes when the client has ordered the study. In this process a final QA/QC is done before the study is emailed to the client. Since we believe in giving our clients a good experience of our research studies, therefore, to make sure that we do not lack at our end in any way humanly possible we do a final round of quality check and then dispatch the study to the client.
Modular Robotics Market size was estimated at USD 10.51 billion in 2023 and is expected to reach USD 47.44 billion by 2032 at a CAGR of 18.23% during the forecast period of 2024-2032.
Water Recycle and Reuse Market was esteemed at USD 16.12 Bn in 2023 and is estimated to reach USD 38.77 Bn by 2032 with a growing CAGR of 10.24% from 2024-2032.
The Air Filter Market was valued at USD 15.73 billion in 2023 and is anticipated to grow to USD 28.95 billion by 2032, displaying a compound annual growth rate (CAGR) of 7.01% during the forecast Period 2024 -2032.
The Metal Embossing Machine Market size was valued at USD 57.33 Billion in 2023 and is expected to reach USD 78.82 Billion by 2032 with a growing CAGR of 3.6% over the forecast period 2024-2032.
The Hand Tools Market Size was estimated at USD 24.69 billion in 2023 and is expected to arrive at USD 34.33 billion by 2032 with a growing CAGR of 3.73% over the forecast period 2024-2032.
The Packaging Machinery Market size was valued at USD 46.2 Billion in 2023 and is now anticipated to grow to USD 73.09 Billion by 2032, displaying a compound annual growth rate CAGR of 5.23% during the forecast Period 2024-2032.

Hi! Click one of our member below to chat on Phone
© 2025 All Rights Reserved by SNS Insider Pvt Ltd


