image

Membrane Bioreactor Market Report Scope & Overview:

Membrane Bioreactor Market Revenue Analysis

Get More Information on Membrane Bioreactor Market - Request Sample Report

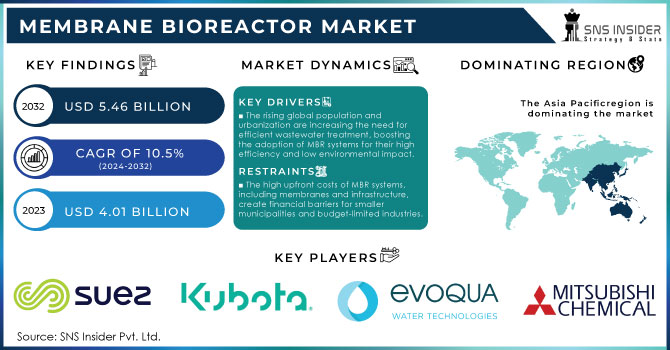
The Membrane Bioreactor Market Size was esteemed at USD 4.01 billion in 2023 and is supposed to arrive at USD 5.46 billion by 2032 and develop at a CAGR of 10.5% over the forecast period 2024-2032.

The Membrane Bioreactor (MBR) market is experiencing significant growth, driven primarily by the increasing demand for efficient wastewater treatment solutions. MBR technology integrates biological treatment processes with membrane filtration, resulting in superior contaminant removal and producing high-quality effluent compared to traditional methods. This technology is particularly effective for managing complex wastewater streams, including municipal and industrial waste, adeptly handling a variety of pollutants such as pathogens, nutrients, and suspended solids.

Recent trends indicate a notable shift towards the adoption of advanced MBR systems in response to rising environmental concerns and regulatory pressures regarding water quality. As global water scarcity becomes an urgent issue, MBRs are increasingly recognized as essential components of sustainable water management strategies, especially in urban areas that are grappling with rapid population growth. The compact and modular design of MBR systems makes them ideal for retrofitting existing wastewater treatment plants, facilitating more efficient upgrades without the need for extensive infrastructure changes. Technological advancements play a crucial role in enhancing the performance and cost-effectiveness of MBR systems. Innovations in membrane materials and configurations, particularly in hollow fiber membranes, are improving fouling resistance and extending operational longevity. This reduces maintenance costs and enhances system reliability, making MBR technology an attractive option for various applications. Furthermore, the growing emphasis on water reuse and recycling is spurring investments in MBR technology, as it allows for the production of high-quality treated water suitable for diverse applications, including irrigation and industrial processes.

Membrane Bioreactor Market Dynamics

DRIVERS

  • The rising global population and urbanization are increasing the need for efficient wastewater treatment, boosting the adoption of MBR systems for their high efficiency and low environmental impact.

The rising demand for wastewater treatment is being driven by population growth and rapid urbanization, particularly in developing countries. As urban populations expand, more wastewater is generated, putting pressure on existing treatment infrastructure. According to the United Nations, over 2 billion people live in countries experiencing high water stress, and it is projected that by 2050, more than 68% of the global population will live in urban areas. This surge in urbanization necessitates efficient and sustainable wastewater management solutions to ensure public health and environmental protection.

Membrane Bioreactor (MBR) systems are emerging as a key technology in addressing this demand due to their high treatment efficiency and reduced environmental footprint. MBR systems combine biological treatment processes with membrane filtration, which allows for the effective removal of both organic and inorganic pollutants, producing high-quality effluent that can be reused. These systems are particularly suited for municipalities and industries looking for advanced solutions that meet stringent water quality regulations.  The ability of MBR systems to treat wastewater in a smaller footprint compared to traditional methods makes them ideal for urban settings where space is limited. Additionally, with rising concerns about water scarcity, MBR systems play a crucial role in facilitating water reuse, helping municipalities and industries achieve sustainability goals while meeting the rising demand for clean water.

  • Technological advancements in membrane materials and filtration efficiency have reduced costs, improved system performance, and extended the lifespan of MBR systems.

Technological advancements in membrane bioreactor (MBR) systems have significantly contributed to their growing adoption in wastewater treatment. Innovations in membrane materials, such as the development of more durable and efficient polymers, have improved the overall filtration performance. For instance, recent breakthroughs in materials like ceramic membranes and enhanced polymeric membranes have increased resistance to fouling, reduced energy consumption, and extended the lifespan of membrane modules by up to 50%.

Filtration efficiency has also improved, with newer membranes achieving higher permeate flux rates and requiring less frequent cleaning. Ultrafiltration (UF) and microfiltration (MF) membranes, commonly used in MBR systems, can remove up to 99.99% of suspended solids and reduce contaminants such as bacteria and viruses, making treated water suitable for reuse. In addition to material enhancements, automation, and process control technologies have optimized the operation of MBR systems. Advanced monitoring tools can detect fouling earlier, adjusting operational parameters to extend membrane life. This has resulted in a 10-20% reduction in operating costs for industries and municipalities adopting MBR technology.

RESTRAIN

  • The significant upfront costs of installing MBR systems, including membranes and infrastructure, pose a financial barrier for smaller municipalities and budget-constrained industries.

The high initial capital investment is a significant challenge for the adoption of Membrane Bioreactor (MBR) systems. MBR technology, though efficient, requires substantial upfront costs for its installation, including the price of membrane modules, supporting infrastructure, pumps, blowers, and other associated components. These costs can be prohibitive, especially for smaller municipalities and industries with limited financial resources.

On average, the capital cost of an MBR system ranges between USD 500,000 to USD 2 million per million gallons per day (MGD) of treatment capacity, depending on the scale and complexity of the system. This can be 30-50% higher than traditional wastewater treatment systems such as activated sludge processes. Additionally, the costs associated with civil works, installation, and commissioning further add to the total capital expenditure. For municipalities or industries in regions with limited funding, this high initial outlay can be a deterrent, pushing them toward more affordable but less efficient alternatives. Although operational efficiencies and long-term cost savings (such as reduced land footprint and higher effluent quality) are realized over time, the significant upfront investment remains a barrier for broader adoption. Financing mechanisms, subsidies, or government incentives are often necessary to encourage adoption in such cost-sensitive sectors.

Membrane Bioreactor Market Segmentation Analysis

By Product

In 2023, the hollow fiber segment accounted for more than 54.06% of the total revenue share. Hollow fiber membranes have reduced operational and maintenance expenses compared to multi-tubular and flat sheet membrane bioreactors. In addition, hollow fiber bioreactors are frequently utilized in a range of applications including desalination, filtration, biochemical reactions, and gas separation.

By Configuration

In 2023, the submerged segment dominated with more than 78.12% due to its reduced energy consumption, improved biodegradation efficiency, and lower fouling rate in comparison to side stream membrane bioreactors. Furthermore, the increasing utilization of sunken bioreactors within the industrial field is expected to drive growth within the segment.

Membrane Bioreactor Market Regional Outlook

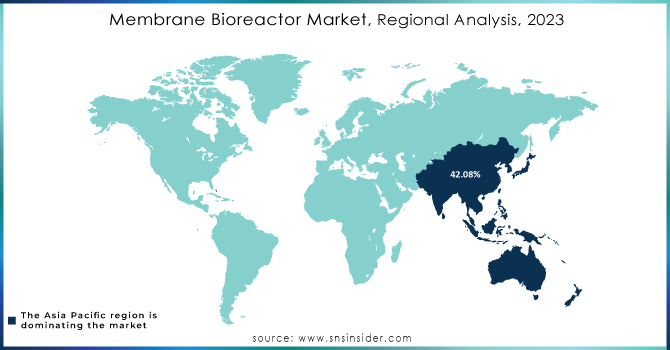
Asia Pacific dominated with a revenue share exceeding 42.08% in 2023. An increase in the industrial sector, particularly in chemicals, food & beverages, pharmaceuticals, and oil & gas industries, is expected to drive up the need for membrane bioreactors for treating wastewater.

North America will experience a compound annual growth rate of 6.2% during the predicted time frame. The expansion is credited to advancements in pharmaceutical, chemical, and automotive production plants. The market in the region is being driven by a rise in the need for wastewater treatment, higher levels of immigration, and advancements in technology.

Membrane-Bioreactor-Market-Regional-Analysis-2023

Need any customization research on Membrane Bioreactor Market - Enquiry Now

KEY PLAYERS

Some of the major key players of Membrane Bioreactor Market

  • SUEZ: (MBR ZeeWeed technology)
  • Kubota Corporation: (Kubota MBR Membrane Units)
  • Evoqua Water Technologies LLC: (MemPulse MBR system)
  • Mitsubishi Chemical Corporation: (STERAPORE MBR Membrane Modules)
  • TORAY INDUSTRIES, INC.: (Toray Membranes for MBR)
  • CITIC Envirotech Ltd.: (Memstar MBR system)
  • Koch Separation Solutions” (PURON MBR Modules)
  • ALFA LAVAL: (MBR Membranes and Solutions)
  • Veolia: (Biostyr and AnoxKaldnes MBBR)
  • Aquatech International LLC: (BioMOD MBR systems)
  • GEA Group: (MBR Filtration Systems)
  • Pentair:(X-Flow MBR Membranes)
  • Hitachi Zosen Corporation: (Hitachi MBR Systems)
  • HUBER SE: (Membrane Filtration Systems for MBR)
  • Siemens AG: (MBR Solutions for Industrial and Municipal Wastewater)
  • Hydranautics (Nitto Group): (Hydranautics Membranes for MBR)
  • GE Water & Process Technologies: (ZeeWeed Membrane Bioreactor Systems)
  • Ovivo: (Ovivo MBR technology)
  • Degremont Technologies: (SUEZ) (Ultrafiltration and Membrane Bioreactor Systems)
  • LG Chem: (LG Water Solutions for MBR)

RECENT DEVELOPMENTS

In May 2023: Veolia Water Technologies launched a new MBR solution with an enhanced membrane module that has better resistance to fouling and a longer lifespan, designed to improve industrial wastewater treatment procedures.

In February 2023: SUEZ Water Technologies & Solutions introduced a new advanced MBR system for treating municipal wastewater. This system utilizes advanced membrane filtration technology to increase effectiveness and lower operating expenses.

In August 2023: Xylem Inc. launched a new MBR technology that combines AI-powered monitoring and control systems to offer real-time analytics for improved system performance and quality effluent assurance.

Membrane Bioreactor Market Report Scope:

Report Attributes Details
Market Size in 2023 USD 4.01 billion
Market Size by 2032 USD 5.46 billion 
CAGR CAGR of 10.5% From 2024 to 2032
Base Year 2023
Forecast Period 2024-2032
Historical Data 2020-2022
Report Scope & Coverage Market Size, Segments Analysis, Competitive  Landscape, Regional Analysis, DROC & SWOT Analysis, Forecast Outlook
Key Segments • By Product (Hollow Fiber, Flat Sheet, Multi-Tubular)
• By Configuration (Submerged, Side Stream)
• By Application (Municipal, Industrial)
Regional Analysis/Coverage North America (US, Canada, Mexico), Europe (Eastern Europe [Poland, Romania, Hungary, Turkey, Rest of Eastern Europe] Western Europe] Germany, France, UK, Italy, Spain, Netherlands, Switzerland, Austria, Rest of Western Europe]), Asia Pacific (China, India, Japan, South Korea, Vietnam, Singapore, Australia, Rest of Asia Pacific), Middle East & Africa (Middle East [UAE, Egypt, Saudi Arabia, Qatar, Rest of Middle East], Africa [Nigeria, South Africa, Rest of Africa], Latin America (Brazil, Argentina, Colombia, Rest of Latin America)
Company Profiles SUEZ, Kubota Corporation, Evoqua Water Technologies LLC, Mitsubishi Chemical Corporation, TORAY INDUSTRIES, INC., CITIC Envirotech Ltd., Koch Separation Solutions, ALFA LAVAL, Veolia, Aquatech International LLC, GEA Group, Pentair, Hitachi Zosen Corporation, HUBER SE, Siemens AG, Hydranautics (Nitto Group), GE Water & Process Technologies, Ovivo, Degremont Technologies (SUEZ), LG Chem.
Key Drivers • The rising global population and urbanization are increasing the need for efficient wastewater treatment, boosting the adoption of MBR systems for their high efficiency and low environmental impact.
• Technological advancements in membrane materials and filtration efficiency have reduced costs, improved system performance, and extended the lifespan of MBR syste
Restraints • The significant upfront costs of installing MBR systems, including membranes and infrastructure, pose a financial barrier for smaller municipalities and budget-constrained industries.

Frequently Asked Questions

Ans: The Membrane Bioreactor Market is expected to grow at a CAGR of 10.5% Over the Forecast Period of 2024-2032.

Ans: Membrane Bioreactor Market size was USD 4.01 Billion in 2023 and is expected to Reach USD 5.46 Billion by 2032.

Ans: Hollow fiber segmentation is the dominating segment By Product in the Membrane Bioreactor Market.

Ans: The rising global population and urbanization are increasing the need for efficient wastewater treatment, boosting the adoption of MBR systems for their high efficiency and low environmental impact.

Ans: Asia-Pacific is the dominating region in the Membrane Bioreactor Market.

TABLE OF CONTENTS:

1. Introduction

1.1 Market Definition

1.2 Scope (Inclusion and Exclusions)

1.3 Research Assumptions

2. Executive Summary

2.1 Market Overview

2.2 Regional Synopsis

2.3 Competitive Summary

3. Research Methodology

3.1 Top-Down Approach

3.2 Bottom-up Approach

3.3. Data Validation

3.4 Primary Interviews

4. Market Dynamics Impact Analysis

4.1 Market Driving Factors Analysis

4.1.1 Drivers

4.1.2 Restraints

4.1.3 Opportunities

4.1.4 Challenges

4.2 PESTLE Analysis

4.3 Porter’s Five Forces Model

5. Statistical Insights and Trends Reporting

5.1 Manufacturing Output, by region, (2020-2023)

5.2 Utilization Rates, by region, (2020-2023)

5.3 Maintenance and Downtime Metrix

5.4 Technological Adoption Rates, by region

5.6 Export/Import Data, by region (2023)

6. Competitive Landscape

6.1 List of Major Companies, By Region

6.2 Market Share Analysis, By Region

6.3 Product Benchmarking

6.3.1 Product specifications and features

6.3.2 Pricing

6.4 Strategic Initiatives

6.4.1 Marketing and promotional activities

6.4.2 Distribution and supply chain strategies

6.4.3 Expansion plans and new product launches

6.4.4 Strategic partnerships and collaborations

6.5 Technological Advancements

6.6 Market Positioning and Branding

7. Membrane Bioreactor Market Segmentation, By Product

7.1 Chapter Overview

7.2 Hollow Fiber

7.2.1 Hollow Fiber Market Trends Analysis (2020-2032)

7.2.2 Hollow Fiber Market Size Estimates and Forecasts to 2032 (USD Billion)

 7.3 Flat Sheet

7.3.1 Flat Sheet Market Trends Analysis (2020-2032)

7.3.2 Flat Sheet Market Size Estimates and Forecasts to 2032 (USD Billion)

7.4 multi-tubular

7.4.1 multi-tubular Market Trends Analysis (2020-2032)

7.4.2 multi-tubular Market Size Estimates and Forecasts to 2032 (USD Billion)

8. Membrane Bioreactor Market Segmentation, By Configuration

8.1 Chapter Overview

8.2 Submerged

8.2.1 Submerged Market Trends Analysis (2020-2032)

8.2.2 Submerged Market Size Estimates and Forecasts to 2032 (USD Billion)

8.3 Side Stream

8.3.1 Side Stream Market Trends Analysis (2020-2032)

8.3.2 Side Stream Market Size Estimates and Forecasts to 2032 (USD Billion)

9. Membrane Bioreactor Market Segmentation, By Application

9.1 Chapter Overview

     9.2 Municipal

9.2.1 Municipal Market Trends Analysis (2020-2032)

9.2.2 Municipal Market Size Estimates and Forecasts to 2032 (USD Billion)

      9.3 Industrial

9.3.1 Industrial Market Trends Analysis (2020-2032)

9.3.2 Industrial Market Size Estimates and Forecasts to 2032 (USD Billion)

10. Regional Analysis

10.1 Chapter Overview

10.2 North America

10.2.1 Trends Analysis

10.2.2 North America Membrane Bioreactor Market Estimates and Forecasts, by Country (2020-2032) (USD Billion)

10.2.3 North America Membrane Bioreactor Market Estimates and Forecasts, By Product (2020-2032) (USD Billion) 

10.2.4 North America Membrane Bioreactor Market Estimates and Forecasts, By Configuration (2020-2032) (USD Billion)

10.2.5 North America Membrane Bioreactor Market Estimates and Forecasts, By Application (2020-2032) (USD Billion)

10.2.6 USA

10.2.6.1 USA Membrane Bioreactor Market Estimates and Forecasts, By Product (2020-2032) (USD Billion)

10.2.6.2 USA Membrane Bioreactor Market Estimates and Forecasts, By Configuration (2020-2032) (USD Billion)

10.2.6.3 USA Membrane Bioreactor Market Estimates and Forecasts, By Application (2020-2032) (USD Billion)

10.2.7 Canada

10.2.7.1 Canada Membrane Bioreactor Market Estimates and Forecasts, By Product (2020-2032) (USD Billion)

10.2.7.2 Canada Membrane Bioreactor Market Estimates and Forecasts, By Configuration (2020-2032) (USD Billion)

10.2.7.3 Canada Membrane Bioreactor Market Estimates and Forecasts, By Application (2020-2032) (USD Billion)

10.2.8 Mexico

10.2.8.1 Mexico Membrane Bioreactor Market Estimates and Forecasts, By Product (2020-2032) (USD Billion)

10.2.8.2 Mexico Membrane Bioreactor Market Estimates and Forecasts, By Configuration (2020-2032) (USD Billion)

10.2.8.3 Mexico Membrane Bioreactor Market Estimates and Forecasts, By Application (2020-2032) (USD Billion)

10.3 Europe

10.3.1 Eastern Europe

10.3.1.1 Trends Analysis

10.3.1.2 Eastern Europe Membrane Bioreactor Market Estimates and Forecasts, by Country (2020-2032) (USD Billion)

10.3.1.3 Eastern Europe Membrane Bioreactor Market Estimates and Forecasts, By Product (2020-2032) (USD Billion) 

10.3.1.4 Eastern Europe Membrane Bioreactor Market Estimates and Forecasts, By Configuration (2020-2032) (USD Billion)

10.3.1.5 Eastern Europe Membrane Bioreactor Market Estimates and Forecasts, By Application (2020-2032) (USD Billion)

10.3.1.6 Poland

10.3.1.6.1 Poland Membrane Bioreactor Market Estimates and Forecasts, By Product (2020-2032) (USD Billion)

10.3.1.6.2 Poland Membrane Bioreactor Market Estimates and Forecasts, By Configuration (2020-2032) (USD Billion)

10.3.1.6.3 Poland Membrane Bioreactor Market Estimates and Forecasts, By Application (2020-2032) (USD Billion)

10.3.1.7 Romania

10.3.1.7.1 Romania Membrane Bioreactor Market Estimates and Forecasts, By Product (2020-2032) (USD Billion)

10.3.1.7.2 Romania Membrane Bioreactor Market Estimates and Forecasts, By Configuration (2020-2032) (USD Billion)

10.3.1.7.3 Romania Membrane Bioreactor Market Estimates and Forecasts, By Application (2020-2032) (USD Billion)

10.3.1.8 Hungary

10.3.1.8.1 Hungary Membrane Bioreactor Market Estimates and Forecasts, By Product (2020-2032) (USD Billion)

10.3.1.8.2 Hungary Membrane Bioreactor Market Estimates and Forecasts, By Configuration (2020-2032) (USD Billion)

10.3.1.8.3 Hungary Membrane Bioreactor Market Estimates and Forecasts, By Application (2020-2032) (USD Billion)

10.3.1.9 Turkey

10.3.1.9.1 Turkey Membrane Bioreactor Market Estimates and Forecasts, By Product (2020-2032) (USD Billion)

10.3.1.9.2 Turkey Membrane Bioreactor Market Estimates and Forecasts, By Configuration (2020-2032) (USD Billion)

10.3.1.9.3 Turkey Membrane Bioreactor Market Estimates and Forecasts, By Application (2020-2032) (USD Billion)

10.3.1.10 Rest of Eastern Europe

10.3.1.10.1 Rest of Eastern Europe Membrane Bioreactor Market Estimates and Forecasts, By Product (2020-2032) (USD Billion)

10.3.1.10.2 Rest of Eastern Europe Membrane Bioreactor Market Estimates and Forecasts, By Configuration (2020-2032) (USD Billion)

10.3.1.10.3 Rest of Eastern Europe Membrane Bioreactor Market Estimates and Forecasts, By Application (2020-2032) (USD Billion)

10.3.2 Western Europe

10.3.2.1 Trends Analysis

10.3.2.2 Western Europe Membrane Bioreactor Market Estimates and Forecasts, by Country (2020-2032) (USD Billion)

10.3.2.3 Western Europe Membrane Bioreactor Market Estimates and Forecasts, By Product (2020-2032) (USD Billion) 

10.3.2.4 Western Europe Membrane Bioreactor Market Estimates and Forecasts, By Configuration (2020-2032) (USD Billion)

10.3.2.5 Western Europe Membrane Bioreactor Market Estimates and Forecasts, By Application (2020-2032) (USD Billion)

10.3.2.6 Germany

10.3.2.6.1 Germany Membrane Bioreactor Market Estimates and Forecasts, By Product (2020-2032) (USD Billion)

10.3.2.6.2 Germany Membrane Bioreactor Market Estimates and Forecasts, By Configuration (2020-2032) (USD Billion)

10.3.2.6.3 Germany Membrane Bioreactor Market Estimates and Forecasts, By Application (2020-2032) (USD Billion)

10.3.2.7 France

10.3.2.7.1 France Membrane Bioreactor Market Estimates and Forecasts, By Product (2020-2032) (USD Billion)

10.3.2.7.2 France Membrane Bioreactor Market Estimates and Forecasts, By Configuration (2020-2032) (USD Billion)

10.3.2.7.3 France Membrane Bioreactor Market Estimates and Forecasts, By Application (2020-2032) (USD Billion)

10.3.2.8 UK

10.3.2.8.1 UK Membrane Bioreactor Market Estimates and Forecasts, By Product (2020-2032) (USD Billion)

10.3.2.8.2 UK Membrane Bioreactor Market Estimates and Forecasts, By Configuration (2020-2032) (USD Billion)

10.3.2.8.3 UK Membrane Bioreactor Market Estimates and Forecasts, By Application (2020-2032) (USD Billion)

10.3.2.9 Italy

10.3.2.9.1 Italy Membrane Bioreactor Market Estimates and Forecasts, By Product (2020-2032) (USD Billion)

10.3.2.9.2 Italy Membrane Bioreactor Market Estimates and Forecasts, By Configuration (2020-2032) (USD Billion)

10.3.2.9.3 Italy Membrane Bioreactor Market Estimates and Forecasts, By Application (2020-2032) (USD Billion)

10.3.2.10 Spain

10.3.2.10.1 Spain Membrane Bioreactor Market Estimates and Forecasts, By Product (2020-2032) (USD Billion)

10.3.2.10.2 Spain Membrane Bioreactor Market Estimates and Forecasts, By Configuration (2020-2032) (USD Billion)

10.3.2.10.3 Spain Membrane Bioreactor Market Estimates and Forecasts, By Application (2020-2032) (USD Billion)

10.3.2.11 Netherlands

10.3.2.11.1 Netherlands Membrane Bioreactor Market Estimates and Forecasts, By Product (2020-2032) (USD Billion)

10.3.2.11.2 Netherlands Membrane Bioreactor Market Estimates and Forecasts, By Configuration (2020-2032) (USD Billion)

10.3.2.11.3 Netherlands Membrane Bioreactor Market Estimates and Forecasts, By Application (2020-2032) (USD Billion)

10.3.2.12 Switzerland

10.3.2.12.1 Switzerland Membrane Bioreactor Market Estimates and Forecasts, By Product (2020-2032) (USD Billion)

10.3.2.12.2 Switzerland Membrane Bioreactor Market Estimates and Forecasts, By Configuration (2020-2032) (USD Billion)

10.3.2.12.3 Switzerland Membrane Bioreactor Market Estimates and Forecasts, By Application (2020-2032) (USD Billion)

10.3.2.13 Austria

10.3.2.13.1 Austria Membrane Bioreactor Market Estimates and Forecasts, By Product (2020-2032) (USD Billion)

10.3.2.13.2 Austria Membrane Bioreactor Market Estimates and Forecasts, By Configuration (2020-2032) (USD Billion)

10.3.2.13.3 Austria Membrane Bioreactor Market Estimates and Forecasts, By Application (2020-2032) (USD Billion)

10.3.2.14 Rest of Western Europe

10.3.2.14.1 Rest of Western Europe Membrane Bioreactor Market Estimates and Forecasts, By Product (2020-2032) (USD Billion)

10.3.2.14.2 Rest of Western Europe Membrane Bioreactor Market Estimates and Forecasts, By Configuration (2020-2032) (USD Billion)

10.3.2.14.3 Rest of Western Europe Membrane Bioreactor Market Estimates and Forecasts, By Application (2020-2032) (USD Billion)

10.4 Asia-Pacific

10.4.1 Trends Analysis

10.4.2 Asia-Pacific Membrane Bioreactor Market Estimates and Forecasts, by Country (2020-2032) (USD Billion)

10.4.3 Asia-Pacific Membrane Bioreactor Market Estimates and Forecasts, By Product (2020-2032) (USD Billion) 

10.4.4 Asia-Pacific Membrane Bioreactor Market Estimates and Forecasts, By Configuration (2020-2032) (USD Billion)

10.4.5 Asia-Pacific Membrane Bioreactor Market Estimates and Forecasts, By Application (2020-2032) (USD Billion)

10.4.6 China

10.4.6.1 China Membrane Bioreactor Market Estimates and Forecasts, By Product (2020-2032) (USD Billion)

10.4.6.2 China Membrane Bioreactor Market Estimates and Forecasts, By Configuration (2020-2032) (USD Billion)

10.4.6.3 China Membrane Bioreactor Market Estimates and Forecasts, By Application (2020-2032) (USD Billion)

10.4.7 India

10.4.7.1 India Membrane Bioreactor Market Estimates and Forecasts, By Product (2020-2032) (USD Billion)

10.4.7.2 India Membrane Bioreactor Market Estimates and Forecasts, By Configuration (2020-2032) (USD Billion)

10.4.7.3 India Membrane Bioreactor Market Estimates and Forecasts, By Application (2020-2032) (USD Billion)

10.4.8 Japan

10.4.8.1 Japan Membrane Bioreactor Market Estimates and Forecasts, By Product (2020-2032) (USD Billion)

10.4.8.2 Japan Membrane Bioreactor Market Estimates and Forecasts, By Configuration (2020-2032) (USD Billion)

10.4.8.3 Japan Membrane Bioreactor Market Estimates and Forecasts, By Application (2020-2032) (USD Billion)

10.4.9 South Korea

10.4.9.1 South Korea Membrane Bioreactor Market Estimates and Forecasts, By Product (2020-2032) (USD Billion)

10.4.9.2 South Korea Membrane Bioreactor Market Estimates and Forecasts, By Configuration (2020-2032) (USD Billion)

10.4.9.3 South Korea Membrane Bioreactor Market Estimates and Forecasts, By Application (2020-2032) (USD Billion)

10.4.10 Vietnam

10.4.10.1 Vietnam Membrane Bioreactor Market Estimates and Forecasts, By Product (2020-2032) (USD Billion)

10.4.10.2 Vietnam Membrane Bioreactor Market Estimates and Forecasts, By Configuration (2020-2032) (USD Billion)

10.4.10.3 Vietnam Membrane Bioreactor Market Estimates and Forecasts, By Application (2020-2032) (USD Billion)

10.4.11 Singapore

10.4.11.1 Singapore Membrane Bioreactor Market Estimates and Forecasts, By Product (2020-2032) (USD Billion)

10.4.11.2 Singapore Membrane Bioreactor Market Estimates and Forecasts, By Configuration (2020-2032) (USD Billion)

10.4.11.3 Singapore Membrane Bioreactor Market Estimates and Forecasts, By Application (2020-2032) (USD Billion)

10.4.12 Australia

10.4.12.1 Australia Membrane Bioreactor Market Estimates and Forecasts, By Product (2020-2032) (USD Billion)

10.4.12.2 Australia Membrane Bioreactor Market Estimates and Forecasts, By Configuration (2020-2032) (USD Billion)

10.4.12.3 Australia Membrane Bioreactor Market Estimates and Forecasts, By Application (2020-2032) (USD Billion)

10.4.13 Rest of Asia-Pacific

10.4.13.1 Rest of Asia-Pacific Membrane Bioreactor Market Estimates and Forecasts, By Product (2020-2032) (USD Billion)

10.4.13.2 Rest of Asia-Pacific Membrane Bioreactor Market Estimates and Forecasts, By Configuration (2020-2032) (USD Billion)

10.4.13.3 Rest of Asia-Pacific Membrane Bioreactor Market Estimates and Forecasts, By Application (2020-2032) (USD Billion)

10.5 Middle East and Africa

10.5.1 Middle East

10.5.1.1 Trends Analysis

10.5.1.2 Middle East Membrane Bioreactor Market Estimates and Forecasts, by Country (2020-2032) (USD Billion)

10.5.1.3 Middle East Membrane Bioreactor Market Estimates and Forecasts, By Product (2020-2032) (USD Billion) 

10.5.1.4 Middle East Membrane Bioreactor Market Estimates and Forecasts, By Configuration (2020-2032) (USD Billion)

10.5.1.5 Middle East Membrane Bioreactor Market Estimates and Forecasts, By Application (2020-2032) (USD Billion)

10.5.1.6 UAE

10.5.1.6.1 UAE Membrane Bioreactor Market Estimates and Forecasts, By Product (2020-2032) (USD Billion)

10.5.1.6.2 UAE Membrane Bioreactor Market Estimates and Forecasts, By Configuration (2020-2032) (USD Billion)

10.5.1.6.3 UAE Membrane Bioreactor Market Estimates and Forecasts, By Application (2020-2032) (USD Billion)

10.5.1.7 Egypt

10.5.1.7.1 Egypt Membrane Bioreactor Market Estimates and Forecasts, By Product (2020-2032) (USD Billion)

10.5.1.7.2 Egypt Membrane Bioreactor Market Estimates and Forecasts, By Configuration (2020-2032) (USD Billion)

10.5.1.7.3 Egypt Membrane Bioreactor Market Estimates and Forecasts, By Application (2020-2032) (USD Billion)

10.5.1.8 Saudi Arabia

10.5.1.8.1 Saudi Arabia Membrane Bioreactor Market Estimates and Forecasts, By Product (2020-2032) (USD Billion)

10.5.1.8.2 Saudi Arabia Membrane Bioreactor Market Estimates and Forecasts, By Configuration (2020-2032) (USD Billion)

10.5.1.8.3 Saudi Arabia Membrane Bioreactor Market Estimates and Forecasts, By Application (2020-2032) (USD Billion)

10.5.1.9 Qatar

10.5.1.9.1 Qatar Membrane Bioreactor Market Estimates and Forecasts, By Product (2020-2032) (USD Billion)

10.5.1.9.2 Qatar Membrane Bioreactor Market Estimates and Forecasts, By Configuration (2020-2032) (USD Billion)

10.5.1.9.3 Qatar Membrane Bioreactor Market Estimates and Forecasts, By Application (2020-2032) (USD Billion)

10.5.1.10 Rest of Middle East

10.5.1.10.1 Rest of Middle East Membrane Bioreactor Market Estimates and Forecasts, By Product (2020-2032) (USD Billion)

10.5.1.10.2 Rest of Middle East Membrane Bioreactor Market Estimates and Forecasts, By Configuration (2020-2032) (USD Billion)

10.5.1.10.3 Rest of Middle East Membrane Bioreactor Market Estimates and Forecasts, By Application (2020-2032) (USD Billion)

10.5.2 Africa

10.5.2.1 Trends Analysis

10.5.2.2 Africa Membrane Bioreactor Market Estimates and Forecasts, by Country (2020-2032) (USD Billion)

10.5.2.3 Africa Membrane Bioreactor Market Estimates and Forecasts, By Product (2020-2032) (USD Billion) 

10.5.2.4 Africa Membrane Bioreactor Market Estimates and Forecasts, By Configuration (2020-2032) (USD Billion)

10.5.2.5 Africa Membrane Bioreactor Market Estimates and Forecasts, By Application (2020-2032) (USD Billion)

10.5.2.6 South Africa

10.5.2.6.1 South Africa Membrane Bioreactor Market Estimates and Forecasts, By Product (2020-2032) (USD Billion)

10.5.2.6.2 South Africa Membrane Bioreactor Market Estimates and Forecasts, By Configuration (2020-2032) (USD Billion)

10.5.2.6.3 South Africa Membrane Bioreactor Market Estimates and Forecasts, By Application (2020-2032) (USD Billion)

10.5.2.7 Nigeria

10.5.2.7.1 Nigeria Membrane Bioreactor Market Estimates and Forecasts, By Product (2020-2032) (USD Billion)

10.5.2.7.2 Nigeria Membrane Bioreactor Market Estimates and Forecasts, By Configuration (2020-2032) (USD Billion)

10.5.2.7.3 Nigeria Membrane Bioreactor Market Estimates and Forecasts, By Application (2020-2032) (USD Billion)

10.5.2.8 Rest of Africa

10.5.2.8.1 Rest of Africa Membrane Bioreactor Market Estimates and Forecasts, By Product (2020-2032) (USD Billion)

10.5.2.8.2 Rest of Africa Membrane Bioreactor Market Estimates and Forecasts, By Configuration (2020-2032) (USD Billion)

10.5.2.8.3 Rest of Africa Membrane Bioreactor Market Estimates and Forecasts, By Application (2020-2032) (USD Billion)

10.6 Latin America

10.6.1 Trends Analysis

10.6.2 Latin America Membrane Bioreactor Market Estimates and Forecasts, by Country (2020-2032) (USD Billion)

10.6.3 Latin America Membrane Bioreactor Market Estimates and Forecasts, By Product (2020-2032) (USD Billion) 

10.6.4 Latin America Membrane Bioreactor Market Estimates and Forecasts, By Configuration (2020-2032) (USD Billion)

10.6.5 Latin America Membrane Bioreactor Market Estimates and Forecasts, By Application (2020-2032) (USD Billion)

10.6.6 Brazil

10.6.6.1 Brazil Membrane Bioreactor Market Estimates and Forecasts, By Product (2020-2032) (USD Billion)

10.6.6.2 Brazil Membrane Bioreactor Market Estimates and Forecasts, By Configuration (2020-2032) (USD Billion)

10.6.6.3 Brazil Membrane Bioreactor Market Estimates and Forecasts, By Application (2020-2032) (USD Billion)

10.6.7 Argentina

10.6.7.1 Argentina Membrane Bioreactor Market Estimates and Forecasts, By Product (2020-2032) (USD Billion)

10.6.7.2 Argentina Membrane Bioreactor Market Estimates and Forecasts, By Configuration (2020-2032) (USD Billion)

10.6.7.3 Argentina Membrane Bioreactor Market Estimates and Forecasts, By Application (2020-2032) (USD Billion)

10.6.8 Colombia

10.6.8.1 Colombia Membrane Bioreactor Market Estimates and Forecasts, By Product (2020-2032) (USD Billion)

10.6.8.2 Colombia Membrane Bioreactor Market Estimates and Forecasts, By Configuration (2020-2032) (USD Billion)

10.6.8.3 Colombia Membrane Bioreactor Market Estimates and Forecasts, By Application (2020-2032) (USD Billion)

10.6.9 Rest of Latin America

10.6.9.1 Rest of Latin America Membrane Bioreactor Market Estimates and Forecasts, By Product (2020-2032) (USD Billion)

10.6.9.2 Rest of Latin America Membrane Bioreactor Market Estimates and Forecasts, By Configuration (2020-2032) (USD Billion)

10.6.9.3 Rest of Latin America Membrane Bioreactor Market Estimates and Forecasts, By Application (2020-2032) (USD Billion)

11. Company Profiles

11.1 CKD Corporation

11.1.1 Company Overview

11.1.2 Financial

11.1.3 Products/ Services Offered

11.1.4 SWOT Analysis

11.2 Emerson Electric Corporation,

             11.2.1 Company Overview

11.2.2 Financial

11.2.3 Products/ Services Offered

11.2.4 SWOT Analysis

11.3 Kendrion

11.3.1 Company Overview

11.3.2 Financial

11.3.3 Products/ Services Offered

11.3.4 SWOT Analysis

11.4 GF Piping Systems

11.4.1 Company Overview

11.4.2 Financial

11.4.3 Products/ Services Offered

11.4.4 SWOT Analysis

11.5 IMI Precision Engineering

11.5.1 Company Overview

11.5.2 Financial

11.5.3 Products/ Services Offered

11.5.4 SWOT Analysis

11.6 Danfoss Industries Ltd


11.6.1 Company Overview

11.6.2 Financial

11.6.3 Products/ Services Offered

11.6.4 SWOT Analysis

11.7 Curtiss-Wright Corporation

11.7.1 Company Overview

11.7.2 Financial

11.7.3 Products/ Services Offered

11.7.4 SWOT Analysis

11.8 Parker Hannifin Corporation

11.8.1 Company Overview

11.8.2 Financial

11.8.3 Products/ Services Offered

11.8.4 SWOT Analysis

11.9 ASCO Valves Inc.

             11.9.1 Company Overview

11.9.2 Financial

11.9.3 Products/ Services Offered

11.9.4 SWOT Analysis

11.10 Rotex Automation

11.10.1 Company Overview

11.10.2 Financial

11.10.3 Products/ Services Offered

11.10.4 SWOT Analysis

12. Use Cases and Best Practices

13. Conclusion

An accurate research report requires proper strategizing as well as implementation. There are multiple factors involved in the completion of good and accurate research report and selecting the best methodology to compete the research is the toughest part. Since the research reports we provide play a crucial role in any company’s decision-making process, therefore we at SNS Insider always believe that we should choose the best method which gives us results closer to reality. This allows us to reach at a stage wherein we can provide our clients best and accurate investment to output ratio.

Each report that we prepare takes a timeframe of 350-400 business hours for production. Starting from the selection of titles through a couple of in-depth brain storming session to the final QC process before uploading our titles on our website we dedicate around 350 working hours. The titles are selected based on their current market cap and the foreseen CAGR and growth.


The 5 steps process:

Step 1: Secondary Research:

Secondary Research or Desk Research is as the name suggests is a research process wherein, we collect data through the readily available information. In this process we use various paid and unpaid databases which our team has access to and gather data through the same. This includes examining of listed companies’ annual reports, Journals, SEC filling etc. Apart from this our team has access to various associations across the globe across different industries. Lastly, we have exchange relationships with various university as well as individual libraries.

Secondary Research

Step 2: Primary Research

When we talk about primary research, it is a type of study in which the researchers collect relevant data samples directly, rather than relying on previously collected data.  This type of research is focused on gaining content specific facts that can be sued to solve specific problems. Since the collected data is fresh and first hand therefore it makes the study more accurate and genuine.

We at SNS Insider have divided Primary Research into 2 parts.

Part 1 wherein we interview the KOLs of major players as well as the upcoming ones across various geographic regions. This allows us to have their view over the market scenario and acts as an important tool to come closer to the accurate market numbers. As many as 45 paid and unpaid primary interviews are taken from both the demand and supply side of the industry to make sure we land at an accurate judgement and analysis of the market.

This step involves the triangulation of data wherein our team analyses the interview transcripts, online survey responses and observation of on filed participants. The below mentioned chart should give a better understanding of the part 1 of the primary interview.

Primary Research

Part 2: In this part of primary research the data collected via secondary research and the part 1 of the primary research is validated with the interviews from individual consultants and subject matter experts.

Consultants are those set of people who have at least 12 years of experience and expertise within the industry whereas Subject Matter Experts are those with at least 15 years of experience behind their back within the same space. The data with the help of two main processes i.e., FGDs (Focused Group Discussions) and IDs (Individual Discussions). This gives us a 3rd party nonbiased primary view of the market scenario making it a more dependable one while collation of the data pointers.

Step 3: Data Bank Validation

Once all the information is collected via primary and secondary sources, we run that information for data validation. At our intelligence centre our research heads track a lot of information related to the market which includes the quarterly reports, the daily stock prices, and other relevant information. Our data bank server gets updated every fortnight and that is how the information which we collected using our primary and secondary information is revalidated in real time.

Data Bank Validation

Step 4: QA/QC Process

After all the data collection and validation our team does a final level of quality check and quality assurance to get rid of any unwanted or undesired mistakes. This might include but not limited to getting rid of the any typos, duplication of numbers or missing of any important information. The people involved in this process include technical content writers, research heads and graphics people. Once this process is completed the title gets uploader on our platform for our clients to read it.

Step 5: Final QC/QA Process:

This is the last process and comes when the client has ordered the study. In this process a final QA/QC is done before the study is emailed to the client. Since we believe in giving our clients a good experience of our research studies, therefore, to make sure that we do not lack at our end in any way humanly possible we do a final round of quality check and then dispatch the study to the client.

Key Segments:

By Product

  • Hollow Fiber

  • Flat Sheet

  • Multi-tubular

By Configuration

  • Submerged

  • Side Stream

By Application

  • Municipal

  • Industrial

Request for Segment Customization as per your Business Requirement: Segment Customization Request

Regional Coverage

North America

  • US

  • Canada

  • Mexico

Europe

  • Eastern Europe

    • Poland

    • Romania

    • Hungary

    • Turkey

    • Rest of Eastern Europe

  • Western Europe

    • Germany

    • France

    • UK

    • Italy

    • Spain

    • Netherlands

    • Switzerland

    • Austria

    • Rest of Western Europe

Asia Pacific

  • China

  • India

  • Japan

  • South Korea

  • Vietnam

  • Singapore

  • Australia

  • Rest of Asia Pacific

Middle East & Africa

  • Middle East

    • UAE

    • Egypt

    • Saudi Arabia

    • Qatar

    • Rest of the Middle East

  • Africa

    • Nigeria

    • South Africa

    • Rest of Africa

Latin America

  • Brazil

  • Argentina

  • Colombia

  • Rest of Latin America

Request for Country Level Research Report: Country Level Customization Request

Available Customization

With the given market data, SNS Insider offers customization as per the company’s specific needs. The following customization options are available for the report:

  • Product Analysis

  • Criss-Cross segment analysis (e.g. Product X Application)

  • Product Matrix which gives a detailed comparison of product portfolio of each company

  • Geographic Analysis

  • Additional countries in any of the regions

  • Company Information

  • Detailed analysis and profiling of additional market players (Up to five)


  •            5000 (33% Discount)


  •            8950 (40% Discount)


  •            3050 (23% Discount)

Start a Conversation

Hi! Click one of our member below to chat on Phone