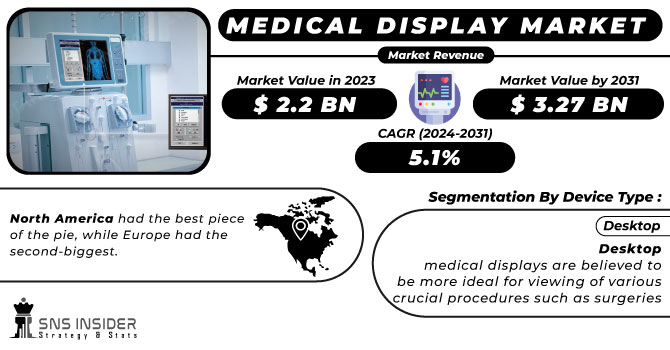
The Medical Display Market size was USD 2.67 Billion in 2023 and is expected to reach USD 4.27 Billion by 2032 and grow at a CAGR of 5.37% over the forecast period of 2024-2032. This report provides a detailed analysis of the medical display market, focusing on adoption trends, pricing dynamics, and technological advancements. It examines the installed base growth of medical displays across hospitals and diagnostic centers, along with pricing trends and cost variations influenced by panel type and resolution. The report highlights healthcare IT integration, including AI-driven diagnostic imaging and cloud-based display solutions. It also assesses healthcare spending on advanced medical display systems across key regions. Additionally, it explores regulatory compliance with DICOM, FDA, and CE standards, ensuring high-quality imaging. Market forecasts cover 2023-2032, analyzing the impact of digitalization and rising demand for high-resolution medical displays.
Get more information on Medical Display Market - Request Sample Report
Drivers
Growing adoption of AI in medical imaging which drives the market growth.
The increasing use of AI (Artificial Intelligence) in Medical Imaging is majorly driving the medical display market, as it allows for improving the diagnostic ability and automating the workflow for efficiency. AI-based imaging solutions are incorporated with picture archiving and communication systems (PACS) and radiology information systems (RIS) to read the pictures as the images are acquired, process them, and detect abnormalities. High-color accuracy and contrast in high-resolution medical displays are a must to support AI-driven diagnostics within specialties including radiology, pathology, and cardiology. Moreover, AI algorithms play a crucial role in decreasing errors in diagnosis, streamlining image processing, and aiding telemedicine applications, fuelling the uptake of 4K and 8K medical displays. Implementation of machine learning and deep learning models in diagnostic imaging is growing, which in turn, has encouraged healthcare organizations to invest in advanced DICOM-compliant medical-grade displays, fueling the market growth.
Restraint
The high cost of advanced medical displays may hamper the market growth.
High cost is one of the major restraining factors, as advanced medical displays cannot be easily adopted by small and mid-sized healthcare facilities. The resolution premium medical-grade display monitors and AI Diagnostic Integrated Display are highly-grade medical devices and very expensive to purchase, maintain, and calibrate. Due to such high expenses, investing in state-of-the-art display technology becomes quite difficult for budget-constrained hospitals, diagnostic hubs, and telemedicine solution providers. Software integration, regulatory standards compliance (DICOM, FDA, CE), and regular/upgrading of systems are more aspects related to operational costs. This pricing hindrance limits availability, especially in developing economies, where healthcare institutes usually prefer budget-friendly options to premium medical displays. This might, however, limit general market expansion due to the slow adoption in price-sensitive regions.
Opportunity
Growing adoption of PACS and cloud-based imaging solutions creates an opportunity in the market.
One of the foremost opportunities for the growth of the medical display market lies in the high adoption of Picture Archiving and Communication Systems (PACS) and cloud-based imaging solutions. With PACS, the storage, retrieval, and sharing of medical images is streamlined for easier access, and film dependency is lessened, thus enhancing the efficiency of diagnosis. With more hospitals and diagnostic centers moving to cloud-based imaging, the need for higher resolution, medical-grade displays with higher color accuracy and DICOM-compliant characteristics has also increased. These high-end monitoring devices facilitate image cognition, allowing the radiologist and medical team to perform more accurate readings and ascertain a diagnosis. Furthermore, cloud integration facilitates remote access to medical images, making telemedicine and teleradiology possible, which is another factor that propels the demand for high-performance medical displays. As such, this trend is likely to accelerate the growth of the market, especially in regions investing heavily in the development of digital infrastructure for health care.
Challenges
Compatibility issues with healthcare IT systems may create a challenge for the market.
One major challenge in the Medical Display Market is compatibility issues with healthcare IT systems, as seamless integration with Picture Archiving and Communication Systems (PACS), Electronic Medical Records (EMR), and AI-powered diagnostic tools is critical for efficient workflows. Like most legacy systems, many healthcare facilities do not have high-resolution medical displays at present or support legacy device resolution practices, hence causing interoperability issues. Software protocols, data formats, and calibration standards vary, leading to discrepancies in image rendering and diminishing diagnostic quality. In most hospitals and imaging centers, synchronizing DICOM-compliant displays with existing infrastructure is challenging, leading to IT upgrades and staff training expenses. This absence of standardization delays the adoption of innovative display solutions, preventing the digital healthcare transformation.
By Device Type
Desktop held the largest market share, around 49% in 2023. It is used for diagnostic imaging, radiology, and telemedicine applications among others. These displays have high-resolution imaging, calibration capability, and DICOM compliance to provide doctors with accurate diagnoses in hospitals and diagnostic centers. Above all, desktop displays are a cheap alternative to surgical and handheld displays, potentially opening wider markets for healthcare facilities. Additionally, they have the added advantage of larger screen size, multi-monitor setup support, and the best image quality to make the workflow more efficient for remote sessions for radiologists and medical professionals. In addition, the adoption of PACS integration is also driving the demand for artificial intelligence (AI)-powered diagnostic tools, further strengthening the dominance of desktop medical displays in the market.
By Panel Size Type
23.0–26.9-inch panels held the largest market share, around 42% in 2023. The perfect balance between screen size, resolution, and value, thus, is suitable for diagnostic imaging, radiology, and surgery applications. Utilizing high-resolution displays (most common are Full HD, 4K), these panels also offer increased brightness and contrast and true color clarity to enable accurate reading of images for medical diagnosis. They can be used in PACS workstations, electronic health records (EHR) viewing, and multi-monitor setups, effectively enhancing workflow efficiency in hospitals and diagnostic centers. Moreover, their adoption is further propelling due to mandatory compliance with DICOM standards and compatibility with AI-powered imaging tools. Along with this, the expanded scope of telemedicine and digitized pathology further substantiating the rising penetration of 23.0–26.9-inch medical displays, thereby solidifying its position in the market.
By Resolution
The global medical displays market share, by resolution, is the range field of 2.1 to 4MP resolution medical displays, which accounted for the largest market share owing to favorable height of resolution against cost and also due to optimal mechanism between imaging needs in diagnostic, radiology, and clinical applications. They give a fine detail appearance of medical scans like X-rays, magnetic resonance imaging (MRI), CT scans etc. for diagnosis at low cost for hospitals and diagnostic centers. They are capable of DICOM-compliant resolution and can be integrated with PACS, EMR systems, and AI-powered diagnostic tools without demanding too much from the processing unit. In addition, multi-monitor workstations supporting 2.1 - 4MP displays are desirable for radiologists and healthcare professionals to optimize workflows. With telemedicine and remote diagnostics increasing in popularity, even 2.1 to 4MP displays have continued to grow in popularity and with better security of their respective market share.
By Application
The digital pathology market segment held the largest market share around 28% in 2023. Advancements in pathology workflows due to the transition from conventional microscopy to high-resolution digital imaging have made remote slide analyses and sharing possible for pathologists. Growing AI-based diagnostics solutions, image analysis automation, and cloud-based pathology platforms adoption have increased demand for medical-grade displays for Digital pathology. The high brightness, contrast, and accurate color reproduction from these displays allows for proper examination of tissue samples. In addition to this, growing cases of cancer and chronic disease and need for better pathology solutions has also been a driver for the market expansion. The dominance of digital pathology in medical display market is also enabled by the integration of telepathology and digital archiving.
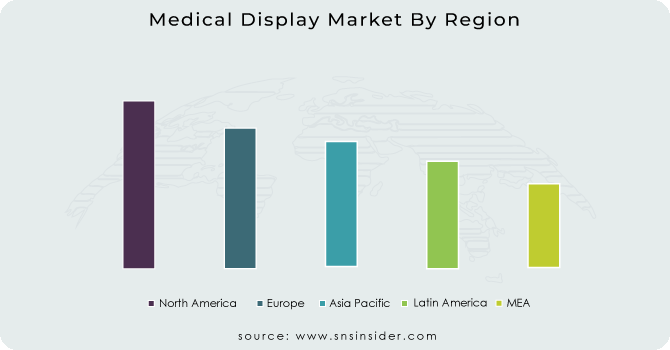
North America held the largest market share, around 42% in 2023. It is superior healthcare infrastructure, high adoption of digital imaging technologies, and investments in AI-driven diagnostics. The presence of top medical display manufacturers and high regulatory standards including compliance with FDA, DICOM standards in the region will strongly drive the market for high quality diagnostic display. In contrast, the increasing telemedicine, teleradiology, and digital-pathology needs are increasing the uptake of high-resolution medical display used across hospitals and diagnostic centers. Moreover, the rising incidence of chronic disease such as cancer, and cardiovascular disorders have pushed the demand for imaging system to the next level. Additionally, government initiatives along with the increasing healthcare expenditure in the U.S. and Canada further enhance continuous technological advancements they promote to strengthen the hold of North America over medical display market.
Asia pacific held a significant share market share in 2023. It the largest market with the rising adoption of digital imaging and growing investments in telemedicine and AI-based diagnostics. Increasing healthcare investment in the region is supported by rising healthcare spending and some government drives to promote advanced medical technologies in China as well as Japan and India. Moreover, rising patient pool coupled with the rising cases of chronic disease have enabled hospitals and diagnostic centres to use high-resolution medical displays. The presence of major display manufacturers and medical device companies in the region also encourages market growth by providing cost-effective and efficient solutions. Additionally, high-fi digital pathology, teleradiology and tacit adoption has inflated Asia Pacific leadership in medial display market.
Need any customization research on Medical Display Market - Enquiry Now
Barco NV (Nio Gray 5.8 MP, MDSC-8532 4K UHD Display)
EIZO Corporation (RadiForce RX660, RadiForce GX560)
Sony Electronics Inc. (LMD-X550MT 4K 3D Display, PVM-2551MD OLED Monitor)
LG Electronics (32HL512D-B 4K Surgical Monitor, 27HJ712C-W Clinical Review Monitor)
Siemens Healthineers AG (ACUSON Sequoia Ultrasound System, Multix Impact Radiography System)
Advantech Co., Ltd. (PAX-332 32 Surgical Monitor, PDC-W240 Medical Display)
NEC Display Solutions (MD302C6 Diagnostic Display, MD212G3 Medical Monitor)
AsusTek Computer Inc. (ProArt PA32UCX 4K Monitor, ProArt PA27AC HDR Monitor)
BenQ Corporation (MD310C Diagnostic Display, PD3200U Designer Monitor)
Dell Technologies Inc. (UltraSharp UP3218K 8K Monitor, UltraSharp U2718Q 4K Monitor)
HP Inc. (Healthcare Edition HC270cr Clinical Review Monitor, Z27n G2 Display)
ViewSonic Corporation (VG2448a 24" Monitor, VP3268-4K Professional Monitor)
JVC Kenwood Corporation (CL-S600 6MP Diagnostic Monitor, MS-S500 5MP Monitor)
WIDE Corporation (IF2105MP 5MP Diagnostic Display, IF2103MP 3MP Monitor)
Nanjing Jusha Display Technology Co., Ltd. (C61W 6MP Diagnostic Monitor, M55W 5MP Monitor)
Shenzhen Beacon Display Technology Co., Ltd. (M550G 5MP Diagnostic Monitor, M320G 3MP Monitor)
FSN Medical Technologies (FS-P3102D 31 4K Display, FS-L2702D 27 HD Monitor)
Axiomtek Co., Ltd. (MPC153-834 Medical Panel Computer, MPC240 24 Medical Panel PC)
Coje Co., Ltd. (CME-261QA 26 Surgical Monitor, CME-191QA 19 Medical Monitor)
Diva Laboratories, Ltd. (Diva DICOM Viewer, Diva Medical Image Server)
In September 2024, Philips CEO Roy Jakobs outlined the company's turnaround strategy following a significant recall, highlighting a commitment to healthcare innovation, AI-driven diagnostic advancements, and enhanced process improvements to prioritize patient safety and quality.
In March 2023, EIZO announced that its RadiForce medical monitors and the latest version of RadiCS quality control software meet the new IEC 62563-2 international standard established by the International Electrotechnical Commission.
| Report Attributes | Details |
|---|---|
| Market Size in 2023 | USD2.67 Billion |
| Market Size by 2032 | USD 4.27 Billion |
| CAGR | CAGR of5.37 % From 2024 to 2032 |
| Base Year | 2023 |
| Forecast Period | 2024-2032 |
| Historical Data | 2020-2022 |
| Report Scope & Coverage | Market Size, Segments Analysis, Competitive Landscape, Regional Analysis, DROC & SWOT Analysis, Forecast Outlook |
| Key Segments | • By Device Type (Desktop, Mobile, All-in-one) • By Panel Size Type (Up to-22.9-inch panels, 23.0–26.9-inch panels, 27.0–41.9-inch panels, Above-42-inch panels) • By Resolution (Up to 2MP, 2.1 to 4MP, 4.1 to 8MP, Above 8MP) • By Application Type (Digital pathology, Radiology, Multi-modality, Surgical, Mammography, Others) |
| Regional Analysis/Coverage | North America (US, Canada, Mexico), Europe (Eastern Europe [Poland, Romania, Hungary, Turkey, Rest of Eastern Europe] Western Europe] Germany, France, UK, Italy, Spain, Netherlands, Switzerland, Austria, Rest of Western Europe]), Asia Pacific (China, India, Japan, South Korea, Vietnam, Singapore, Australia, Rest of Asia Pacific), Middle East & Africa (Middle East [UAE, Egypt, Saudi Arabia, Qatar, Rest of Middle East], Africa [Nigeria, South Africa, Rest of Africa], Latin America (Brazil, Argentina, Colombia, Rest of Latin America) |
| Company Profiles | Barco NV, EIZO Corporation, Sony Electronics Inc., LG Electronics, Siemens Healthineers AG, Advantech Co., Ltd., NEC Display Solutions, AsusTek Computer Inc., BenQ Corporation, Dell Technologies Inc., HP Inc., ViewSonic Corporation, JVC Kenwood Corporation, WIDE Corporation, Nanjing Jusha Display Technology Co., Ltd., Shenzhen Beacon Display Technology Co., Ltd., FSN Medical Technologies, Axiomtek Co., Ltd., Coje Co., Ltd., Diva Laboratories, Ltd. |
Ans: The Medical Display Market was valued at USD 2.67 Billion in 2023.
Ans: The expected CAGR of the global Medical Display Market during the forecast period is 5.37%
Ans: Desktop will grow rapidly in the Medical Display Market from 2024-2032.
Ans: Growing adoption of AI in medical imaging which drives the market growth.
Ans: North America led the Medical Display Market in the region with the highest revenue share in 2023.
Table of Contents
1. Introduction
1.1 Market Definition
1.2 Scope (Inclusion and Exclusions)
1.3 Research Assumptions
2. Executive Summary
2.1 Market Overview
2.2 Regional Synopsis
2.3 Competitive Summary
3. Research Methodology
3.1 Top-Down Approach
3.2 Bottom-up Approach
3.3. Data Validation
3.4 Primary Interviews
4. Market Dynamics Impact Analysis
4.1 Market Driving Factors Analysis
4.1.1 Drivers
4.1.2 Restraints
4.1.3 Opportunities
4.1.4 Challenges
4.2 PESTLE Analysis
4.3 Porter’s Five Forces Model
5. Statistical Insights and Trends Reporting
5.1 Adoption Rate and Installed Base (2023)
5.2 Pricing Trends and Cost Analysis (2023)
5.3 Healthcare IT Integration and Digitalization Trends (2023-2032)
5.4 Healthcare Spending on Medical Display Systems (2023)
6. Competitive Landscape
6.1 List of Major Companies, By Region
6.2 Market Share Analysis, By Region
6.3 Product Benchmarking
6.3.1 Product specifications and features
6.3.2 Pricing
6.4 Strategic Initiatives
6.4.1 Marketing and promotional activities
6.4.2 Distribution and supply chain strategies
6.4.3 Expansion plans and new product launches
6.4.4 Strategic partnerships and collaborations
6.5 Technological Advancements
6.6 Market Positioning and Branding
7. Medical Display Market Segmentation, by Device Type
7.1 Chapter Overview
7.2 Desktop
7.2.1 Desktop Market Trends Analysis (2020-2032)
7.2.2 Desktop Market Size Estimates and Forecasts to 2032 (USD Billion)
7.3 Mobile
7.3.1 Mobile Market Trends Analysis (2020-2032)
7.3.2 Mobile Market Size Estimates and Forecasts to 2032 (USD Billion)
7.4 All-in-one
7.4.1 All-in-one Market Trends Analysis (2020-2032)
7.4.2 All-in-one Market Size Estimates and Forecasts to 2032 (USD Billion)
8. Medical Display Market Segmentation, By Panel Size Type
8.1 Chapter Overview
8.2 Up to-22.9-inch panels
8.2.1 Up to-22.9-inch panels Market Trends Analysis (2020-2032)
8.2.2 Up to-22.9-inch panels Market Size Estimates and Forecasts to 2032 (USD Billion)
8.3 23.0–26.9-inch panels
8.3.1 23.0–26.9-inch panels Market Trends Analysis (2020-2032)
8.3.2 23.0–26.9-inch panels Market Size Estimates and Forecasts to 2032 (USD Billion)
8.4 27.0–41.9-inch panels
8.4.1 27.0–41.9-inch panels Market Trends Analysis (2020-2032)
8.4.2 27.0–41.9-inch panels Market Size Estimates and Forecasts to 2032 (USD Billion)
8.5 Above-42-inch panels
8.5.1 Above-42-inch panels Market Trends Analysis (2020-2032)
8.5.2 Above-42-inch panels Market Size Estimates and Forecasts to 2032 (USD Billion)
9. Medical Display Market Segmentation, By Resolution
9.1 Chapter Overview
9.2 Up to 2MP
9.2.1 Up to 2MP Market Trends Analysis (2020-2032)
9.2.2 Up to 2MP Market Size Estimates and Forecasts to 2032 (USD Billion)
9.3 2.1 to 4MP
9.3.1 2.1 to 4MP Market Trends Analysis (2020-2032)
9.3.2 2.1 to 4MP Market Size Estimates and Forecasts to 2032 (USD Billion)
9.4 4.1 to 8MP
9.4.1 4.1 to 8MP Market Trends Analysis (2020-2032)
9.4.2 4.1 to 8MP Market Size Estimates and Forecasts to 2032 (USD Billion)
9.5 Above 8MP
9.5.1 Above 8MP Market Trends Analysis (2020-2032)
9.5.2 Above 8MP Market Size Estimates and Forecasts to 2032 (USD Billion)
10. Medical Display Market Segmentation, by Application
10.1 Chapter Overview
10.2 Digital pathology
10.2.1 Digital pathology Market Trends Analysis (2020-2032)
10.2.2 Digital Pathology Market Size Estimates and Forecasts to 2032 (USD Billion)
10.3 Radiology
10.3.1 Radiology Market Trends Analysis (2020-2032)
10.3.2 Radiology Market Size Estimates and Forecasts to 2032 (USD Billion)
10.4 Multi-modality
10.4.1 Multi-modality Market Trends Analysis (2020-2032)
10.4.2 Multi-modality Market Size Estimates and Forecasts to 2032 (USD Billion)
10.5 Surgical
10.5.1 Surgical Market Trends Analysis (2020-2032)
10.5.2 Surgical Market Size Estimates and Forecasts to 2032 (USD Billion)
10.6 Mammography
10.6.1 Mammography Market Trends Analysis (2020-2032)
10.6.2 Mammography Market Size Estimates and Forecasts to 2032 (USD Billion)
10.7 Others
10.7.1 Others Market Trends Analysis (2020-2032)
10.7.2 Others Market Size Estimates and Forecasts to 2032 (USD Billion)
11. Regional Analysis
11.1 Chapter Overview
11.2 North America
11.2.1 Trends Analysis
11.2.2 North America Medical Display Market Estimates and Forecasts, by Country (2020-2032) (USD Billion)
11.2.3 North America Medical Display Market Estimates and Forecasts, by Device Type (2020-2032) (USD Billion)
11.2.4 North America Medical Display Market Estimates and Forecasts, By Panel Size Type (2020-2032) (USD Billion)
11.2.5 North America Medical Display Market Estimates and Forecasts, By Resolution (2020-2032) (USD Billion)
11.2.6 North America Medical Display Market Estimates and Forecasts, by Application (2020-2032) (USD Billion)
11.2.7 USA
11.2.7.1 USA Medical Display Market Estimates and Forecasts, by Device Type (2020-2032) (USD Billion)
11.2.7.2 USA Medical Display Market Estimates and Forecasts, By Panel Size Type (2020-2032) (USD Billion)
11.2.7.3 USA Medical Display Market Estimates and Forecasts, By Resolution (2020-2032) (USD Billion)
11.2.7.4 USA Medical Display Market Estimates and Forecasts, by Application (2020-2032) (USD Billion)
11.2.8 Canada
11.2.8.1 Canada Medical Display Market Estimates and Forecasts, by Device Type (2020-2032) (USD Billion)
11.2.8.2 Canada Medical Display Market Estimates and Forecasts, By Panel Size Type (2020-2032) (USD Billion)
11.2.8.3 Canada Medical Display Market Estimates and Forecasts, By Resolution (2020-2032) (USD Billion)
11.2.8.4 Canada Medical Display Market Estimates and Forecasts, by Application (2020-2032) (USD Billion)
11.2.9 Mexico
11.2.9.1 Mexico Medical Display Market Estimates and Forecasts, by Device Type (2020-2032) (USD Billion)
11.2.9.2 Mexico Medical Display Market Estimates and Forecasts, By Panel Size Type (2020-2032) (USD Billion)
11.2.9.3 Mexico Medical Display Market Estimates and Forecasts, By Resolution (2020-2032) (USD Billion)
11.2.9.4 Mexico Medical Display Market Estimates and Forecasts, by Application (2020-2032) (USD Billion)
11.3 Europe
11.3.1 Eastern Europe
11.3.1.1 Trends Analysis
11.3.1.2 Eastern Europe Medical Display Market Estimates and Forecasts, by Country (2020-2032) (USD Billion)
11.3.1.3 Eastern Europe Medical Display Market Estimates and Forecasts, by Device Type (2020-2032) (USD Billion)
11.3.1.4 Eastern Europe Medical Display Market Estimates and Forecasts, By Panel Size Type (2020-2032) (USD Billion)
11.3.1.5 Eastern Europe Medical Display Market Estimates and Forecasts, By Resolution (2020-2032) (USD Billion)
11.3.1.6 Eastern Europe Medical Display Market Estimates and Forecasts, by Application (2020-2032) (USD Billion)
11.3.1.7 Poland
11.3.1.7.1 Poland Medical Display Market Estimates and Forecasts, by Device Type (2020-2032) (USD Billion)
11.3.1.7.2 Poland Medical Display Market Estimates and Forecasts, By Panel Size Type (2020-2032) (USD Billion)
11.3.1.7.3 Poland Medical Display Market Estimates and Forecasts, By Resolution (2020-2032) (USD Billion)
11.3.1.7.4 Poland Medical Display Market Estimates and Forecasts, by Application (2020-2032) (USD Billion)
11.3.1.8 Romania
11.3.1.8.1 Romania Medical Display Market Estimates and Forecasts, by Device Type (2020-2032) (USD Billion)
11.3.1.8.2 Romania Medical Display Market Estimates and Forecasts, By Panel Size Type (2020-2032) (USD Billion)
11.3.1.8.3 Romania Medical Display Market Estimates and Forecasts, By Resolution (2020-2032) (USD Billion)
11.3.1.8.4 Romania Medical Display Market Estimates and Forecasts, by Application (2020-2032) (USD Billion)
11.3.1.9 Hungary
11.3.1.9.1 Hungary Medical Display Market Estimates and Forecasts, by Device Type (2020-2032) (USD Billion)
11.3.1.9.2 Hungary Medical Display Market Estimates and Forecasts, By Panel Size Type (2020-2032) (USD Billion)
11.3.1.9.3 Hungary Medical Display Market Estimates and Forecasts, By Resolution (2020-2032) (USD Billion)
11.3.1.9.4 Hungary Medical Display Market Estimates and Forecasts, by Application (2020-2032) (USD Billion)
11.3.1.10 Turkey
11.3.1.10.1 Turkey Medical Display Market Estimates and Forecasts, by Device Type (2020-2032) (USD Billion)
11.3.1.10.2 Turkey Medical Display Market Estimates and Forecasts, By Panel Size Type (2020-2032) (USD Billion)
11.3.1.10.3 Turkey Medical Display Market Estimates and Forecasts, By Resolution (2020-2032) (USD Billion)
11.3.1.10.4 Turkey Medical Display Market Estimates and Forecasts, by Application (2020-2032) (USD Billion)
11.3.1.11 Rest of Eastern Europe
11.3.1.11.1 Rest of Eastern Europe Medical Display Market Estimates and Forecasts, by Device Type (2020-2032) (USD Billion)
11.3.1.11.2 Rest of Eastern Europe Medical Display Market Estimates and Forecasts, By Panel Size Type (2020-2032) (USD Billion)
11.3.1.11.3 Rest of Eastern Europe Medical Display Market Estimates and Forecasts, By Resolution (2020-2032) (USD Billion)
11.3.1.11.4 Rest of Eastern Europe Medical Display Market Estimates and Forecasts, by Application (2020-2032) (USD Billion)
11.3.2 Western Europe
11.3.2.1 Trends Analysis
11.3.2.2 Western Europe Medical Display Market Estimates and Forecasts, by Country (2020-2032) (USD Billion)
11.3.2.3 Western Europe Medical Display Market Estimates and Forecasts, by Device Type (2020-2032) (USD Billion)
11.3.2.4 Western Europe Medical Display Market Estimates and Forecasts, By Panel Size Type (2020-2032) (USD Billion)
11.3.2.5 Western Europe Medical Display Market Estimates and Forecasts, By Resolution (2020-2032) (USD Billion)
11.3.2.6 Western Europe Medical Display Market Estimates and Forecasts, by Application (2020-2032) (USD Billion)
11.3.2.7 Germany
11.3.2.7.1 Germany Medical Display Market Estimates and Forecasts, by Device Type (2020-2032) (USD Billion)
11.3.2.7.2 Germany Medical Display Market Estimates and Forecasts, By Panel Size Type (2020-2032) (USD Billion)
11.3.2.7.3 Germany Medical Display Market Estimates and Forecasts, By Resolution (2020-2032) (USD Billion)
11.3.2.7.4 Germany Medical Display Market Estimates and Forecasts, by Application (2020-2032) (USD Billion)
11.3.2.8 France
11.3.2.8.1 France Medical Display Market Estimates and Forecasts, by Device Type (2020-2032) (USD Billion)
11.3.2.8.2 France Medical Display Market Estimates and Forecasts, By Panel Size Type (2020-2032) (USD Billion)
11.3.2.8.3 France Medical Display Market Estimates and Forecasts, By Resolution (2020-2032) (USD Billion)
11.3.2.8.4 France Medical Display Market Estimates and Forecasts, by Application (2020-2032) (USD Billion)
11.3.2.9 UK
11.3.2.9.1 UK Medical Display Market Estimates and Forecasts, by Device Type (2020-2032) (USD Billion)
11.3.2.9.2 UK Medical Display Market Estimates and Forecasts, By Panel Size Type (2020-2032) (USD Billion)
11.3.2.9.3 UK Medical Display Market Estimates and Forecasts, By Resolution (2020-2032) (USD Billion)
11.3.2.9.4 UK Medical Display Market Estimates and Forecasts, by Application (2020-2032) (USD Billion)
11.3.2.10 Italy
11.3.2.10.1 Italy Medical Display Market Estimates and Forecasts, by Device Type (2020-2032) (USD Billion)
11.3.2.10.2 Italy Medical Display Market Estimates and Forecasts, By Panel Size Type (2020-2032) (USD Billion)
11.3.2.10.3 Italy Medical Display Market Estimates and Forecasts, By Resolution (2020-2032) (USD Billion)
11.3.2.10.4 Italy Medical Display Market Estimates and Forecasts, by Application (2020-2032) (USD Billion)
11.3.2.11 Spain
11.3.2.11.1 Spain Medical Display Market Estimates and Forecasts, by Device Type (2020-2032) (USD Billion)
11.3.2.11.2 Spain Medical Display Market Estimates and Forecasts, By Panel Size Type (2020-2032) (USD Billion)
11.3.2.11.3 Spain Medical Display Market Estimates and Forecasts, By Resolution (2020-2032) (USD Billion)
11.3.2.11.4 Spain Medical Display Market Estimates and Forecasts, by Application (2020-2032) (USD Billion)
11.3.2.12 Netherlands
11.3.2.12.1 Netherlands Medical Display Market Estimates and Forecasts, by Device Type (2020-2032) (USD Billion)
11.3.2.12.2 Netherlands Medical Display Market Estimates and Forecasts, By Panel Size Type (2020-2032) (USD Billion)
11.3.2.12.3 Netherlands Medical Display Market Estimates and Forecasts, By Resolution (2020-2032) (USD Billion)
11.3.2.12.4 Netherlands Medical Display Market Estimates and Forecasts, by Application (2020-2032) (USD Billion)
11.3.2.13 Switzerland
11.3.2.13.1 Switzerland Medical Display Market Estimates and Forecasts, by Device Type (2020-2032) (USD Billion)
11.3.2.13.2 Switzerland Medical Display Market Estimates and Forecasts, By Panel Size Type (2020-2032) (USD Billion)
11.3.2.13.3 Switzerland Medical Display Market Estimates and Forecasts, By Resolution (2020-2032) (USD Billion)
11.3.2.13.4 Switzerland Medical Display Market Estimates and Forecasts, by Application (2020-2032) (USD Billion)
11.3.2.14 Austria
11.3.2.14.1 Austria Medical Display Market Estimates and Forecasts, by Device Type (2020-2032) (USD Billion)
11.3.2.14.2 Austria Medical Display Market Estimates and Forecasts, By Panel Size Type (2020-2032) (USD Billion)
11.3.2.14.3 Austria Medical Display Market Estimates and Forecasts, By Resolution (2020-2032) (USD Billion)
11.3.2.14.4 Austria Medical Display Market Estimates and Forecasts, by Application (2020-2032) (USD Billion)
11.3.2.15 Rest of Western Europe
11.3.2.15.1 Rest of Western Europe Medical Display Market Estimates and Forecasts, by Device Type (2020-2032) (USD Billion)
11.3.2.15.2 Rest of Western Europe Medical Display Market Estimates and Forecasts, By Panel Size Type (2020-2032) (USD Billion)
11.3.2.15.3 Rest of Western Europe Medical Display Market Estimates and Forecasts, By Resolution (2020-2032) (USD Billion)
11.3.2.15.4 Rest of Western Europe Medical Display Market Estimates and Forecasts, by Application (2020-2032) (USD Billion)
11.4 Asia-Pacific
11.4.1 Trends Analysis
11.4.2 Asia-Pacific Medical Display Market Estimates and Forecasts, by Country (2020-2032) (USD Billion)
11.4.3 Asia-Pacific Medical Display Market Estimates and Forecasts, by Device Type (2020-2032) (USD Billion)
11.4.4 Asia-Pacific Medical Display Market Estimates and Forecasts, By Panel Size Type (2020-2032) (USD Billion)
11.4.5 Asia-Pacific Medical Display Market Estimates and Forecasts, By Resolution (2020-2032) (USD Billion)
11.4.6 Asia-Pacific Medical Display Market Estimates and Forecasts, by Application (2020-2032) (USD Billion)
11.4.7 China
11.4.7.1 China Medical Display Market Estimates and Forecasts, by Device Type (2020-2032) (USD Billion)
11.4.7.2 China Medical Display Market Estimates and Forecasts, By Panel Size Type (2020-2032) (USD Billion)
11.4.7.3 China Medical Display Market Estimates and Forecasts, By Resolution (2020-2032) (USD Billion)
11.4.7.4 China Medical Display Market Estimates and Forecasts, by Application (2020-2032) (USD Billion)
11.4.8 India
11.4.8.1 India Medical Display Market Estimates and Forecasts, by Device Type (2020-2032) (USD Billion)
11.4.8.2 India Medical Display Market Estimates and Forecasts, By Panel Size Type (2020-2032) (USD Billion)
11.4.8.3 India Medical Display Market Estimates and Forecasts, By Resolution (2020-2032) (USD Billion)
11.4.8.4 India Medical Display Market Estimates and Forecasts, by Application (2020-2032) (USD Billion)
11.4.9 Japan
11.4.9.1 Japan Medical Display Market Estimates and Forecasts, by Device Type (2020-2032) (USD Billion)
11.4.9.2 Japan Medical Display Market Estimates and Forecasts, By Panel Size Type (2020-2032) (USD Billion)
11.4.9.3 Japan Medical Display Market Estimates and Forecasts, By Resolution (2020-2032) (USD Billion)
11.4.9.4 Japan Medical Display Market Estimates and Forecasts, by Application (2020-2032) (USD Billion)
11.4.10 South Korea
11.4.10.1 South Korea Medical Display Market Estimates and Forecasts, by Device Type (2020-2032) (USD Billion)
11.4.10.2 South Korea Medical Display Market Estimates and Forecasts, By Panel Size Type (2020-2032) (USD Billion)
11.4.10.3 South Korea Medical Display Market Estimates and Forecasts, By Resolution (2020-2032) (USD Billion)
11.4.10.4 South Korea Medical Display Market Estimates and Forecasts, by Application (2020-2032) (USD Billion)
11.4.11 Vietnam
11.4.11.1 Vietnam Medical Display Market Estimates and Forecasts, by Device Type (2020-2032) (USD Billion)
11.4.11.2 Vietnam Medical Display Market Estimates and Forecasts, By Panel Size Type (2020-2032) (USD Billion)
11.4.11.3 Vietnam Medical Display Market Estimates and Forecasts, By Resolution (2020-2032) (USD Billion)
11.4.11.4 Vietnam Medical Display Market Estimates and Forecasts, by Application (2020-2032) (USD Billion)
11.4.12 Singapore
11.4.12.1 Singapore Medical Display Market Estimates and Forecasts, by Device Type (2020-2032) (USD Billion)
11.4.12.2 Singapore Medical Display Market Estimates and Forecasts, By Panel Size Type (2020-2032) (USD Billion)
11.4.12.3 Singapore Medical Display Market Estimates and Forecasts, By Resolution (2020-2032) (USD Billion)
11.4.12.4 Singapore Medical Display Market Estimates and Forecasts, by Application (2020-2032) (USD Billion)
11.4.13 Australia
11.4.13.1 Australia Medical Display Market Estimates and Forecasts, by Device Type (2020-2032) (USD Billion)
11.4.13.2 Australia Medical Display Market Estimates and Forecasts, By Panel Size Type (2020-2032) (USD Billion)
11.4.13.3 Australia Medical Display Market Estimates and Forecasts, By Resolution (2020-2032) (USD Billion)
11.4.13.4 Australia Medical Display Market Estimates and Forecasts, by Application (2020-2032) (USD Billion)
11.4.14 Rest of Asia-Pacific
11.4.14.1 Rest of Asia-Pacific Medical Display Market Estimates and Forecasts, by Device Type (2020-2032) (USD Billion)
11.4.14.2 Rest of Asia-Pacific Medical Display Market Estimates and Forecasts, By Panel Size Type (2020-2032) (USD Billion)
11.4.14.3 Rest of Asia-Pacific Medical Display Market Estimates and Forecasts, By Resolution (2020-2032) (USD Billion)
11.4.14.4 Rest of Asia-Pacific Medical Display Market Estimates and Forecasts, by Application (2020-2032) (USD Billion)
11.5 Middle East and Africa
11.5.1 Middle East
11.5.1.1 Trends Analysis
11.5.1.2 Middle East Medical Display Market Estimates and Forecasts, by Country (2020-2032) (USD Billion)
11.5.1.3 Middle East Medical Display Market Estimates and Forecasts, by Device Type (2020-2032) (USD Billion)
11.5.1.4 Middle East Medical Display Market Estimates and Forecasts, By Panel Size Type (2020-2032) (USD Billion)
11.5.1.5 Middle East Medical Display Market Estimates and Forecasts, By Resolution (2020-2032) (USD Billion)
11.5.1.6 Middle East Medical Display Market Estimates and Forecasts, by Application (2020-2032) (USD Billion)
11.5.1.7 UAE
11.5.1.7.1 UAE Medical Display Market Estimates and Forecasts, by Device Type (2020-2032) (USD Billion)
11.5.1.7.2 UAE Medical Display Market Estimates and Forecasts, By Panel Size Type (2020-2032) (USD Billion)
11.5.1.7.3 UAE Medical Display Market Estimates and Forecasts, By Resolution (2020-2032) (USD Billion)
11.5.1.7.4 UAE Medical Display Market Estimates and Forecasts, by Application (2020-2032) (USD Billion)
11.5.1.8 Egypt
11.5.1.8.1 Egypt Medical Display Market Estimates and Forecasts, by Device Type (2020-2032) (USD Billion)
11.5.1.8.2 Egypt Medical Display Market Estimates and Forecasts, By Panel Size Type (2020-2032) (USD Billion)
11.5.1.8.3 Egypt Medical Display Market Estimates and Forecasts, By Resolution (2020-2032) (USD Billion)
11.5.1.8.4 Egypt Medical Display Market Estimates and Forecasts, by Application (2020-2032) (USD Billion)
11.5.1.9 Saudi Arabia
11.5.1.9.1 Saudi Arabia Medical Display Market Estimates and Forecasts, by Device Type (2020-2032) (USD Billion)
11.5.1.9.2 Saudi Arabia Medical Display Market Estimates and Forecasts, By Panel Size Type (2020-2032) (USD Billion)
11.5.1.9.3 Saudi Arabia Medical Display Market Estimates and Forecasts, By Resolution (2020-2032) (USD Billion)
11.5.1.9.4 Saudi Arabia Medical Display Market Estimates and Forecasts, by Application (2020-2032) (USD Billion)
11.5.1.10 Qatar
11.5.1.10.1 Qatar Medical Display Market Estimates and Forecasts, by Device Type (2020-2032) (USD Billion)
11.5.1.10.2 Qatar Medical Display Market Estimates and Forecasts, By Panel Size Type (2020-2032) (USD Billion)
11.5.1.10.3 Qatar Medical Display Market Estimates and Forecasts, By Resolution (2020-2032) (USD Billion)
11.5.1.10.4 Qatar Medical Display Market Estimates and Forecasts, by Application (2020-2032) (USD Billion)
11.5.1.11 Rest of Middle East
11.5.1.11.1 Rest of Middle East Medical Display Market Estimates and Forecasts, by Device Type (2020-2032) (USD Billion)
11.5.1.11.2 Rest of Middle East Medical Display Market Estimates and Forecasts, By Panel Size Type (2020-2032) (USD Billion)
11.5.1.11.3 Rest of Middle East Medical Display Market Estimates and Forecasts, By Resolution (2020-2032) (USD Billion)
11.5.1.11.4 Rest of Middle East Medical Display Market Estimates and Forecasts, by Application (2020-2032) (USD Billion)
11.5.2 Africa
11.5.2.1 Trends Analysis
11.5.2.2 Africa Medical Display Market Estimates and Forecasts, by Country (2020-2032) (USD Billion)
11.5.2.3 Africa Medical Display Market Estimates and Forecasts, by Device Type (2020-2032) (USD Billion)
11.5.2.4 Africa Medical Display Market Estimates and Forecasts, By Panel Size Type (2020-2032) (USD Billion)
11.5.2.5 Africa Medical Display Market Estimates and Forecasts, By Resolution (2020-2032) (USD Billion)
11.5.2.6 Africa Medical Display Market Estimates and Forecasts, by Application (2020-2032) (USD Billion)
11.5.2.7 South Africa
11.5.2.7.1 South Africa Medical Display Market Estimates and Forecasts, by Device Type (2020-2032) (USD Billion)
11.5.2.7.2 South Africa Medical Display Market Estimates and Forecasts, By Panel Size Type (2020-2032) (USD Billion)
11.5.2.7.3 South Africa Medical Display Market Estimates and Forecasts, By Resolution (2020-2032) (USD Billion)
11.5.2.7.4 South Africa Medical Display Market Estimates and Forecasts, by Application (2020-2032) (USD Billion)
11.5.2.8 Nigeria
11.5.2.8.1 Nigeria Medical Display Market Estimates and Forecasts, by Device Type (2020-2032) (USD Billion)
11.5.2.8.2 Nigeria Medical Display Market Estimates and Forecasts, By Panel Size Type (2020-2032) (USD Billion)
11.5.2.8.3 Nigeria Medical Display Market Estimates and Forecasts, By Resolution (2020-2032) (USD Billion)
11.5.2.8.4 Nigeria Medical Display Market Estimates and Forecasts, by Application (2020-2032) (USD Billion)
11.5.2.9 Rest of Africa
11.5.2.9.1 Rest of Africa Medical Display Market Estimates and Forecasts, by Device Type (2020-2032) (USD Billion)
11.5.2.9.2 Rest of Africa Medical Display Market Estimates and Forecasts, By Panel Size Type (2020-2032) (USD Billion)
11.5.2.9.3 Rest of Africa Medical Display Market Estimates and Forecasts, By Resolution (2020-2032) (USD Billion)
11.5.2.9.4 Rest of Africa Medical Display Market Estimates and Forecasts, by Application (2020-2032) (USD Billion)
11.6 Latin America
11.6.1 Trends Analysis
11.6.2 Latin America Medical Display Market Estimates and Forecasts, by Country (2020-2032) (USD Billion)
11.6.3 Latin America Medical Display Market Estimates and Forecasts, by Device Type (2020-2032) (USD Billion)
11.6.4 Latin America Medical Display Market Estimates and Forecasts, By Panel Size Type (2020-2032) (USD Billion)
11.6.5 Latin America Medical Display Market Estimates and Forecasts, By Resolution (2020-2032) (USD Billion)
11.6.6 Latin America Medical Display Market Estimates and Forecasts, by Application (2020-2032) (USD Billion)
11.6.7 Brazil
11.6.7.1 Brazil Medical Display Market Estimates and Forecasts, by Device Type (2020-2032) (USD Billion)
11.6.7.2 Brazil Medical Display Market Estimates and Forecasts, By Panel Size Type (2020-2032) (USD Billion)
11.6.7.3 Brazil Medical Display Market Estimates and Forecasts, By Resolution (2020-2032) (USD Billion)
11.6.7.4 Brazil Medical Display Market Estimates and Forecasts, by Application (2020-2032) (USD Billion)
11.6.8 Argentina
11.6.8.1 Argentina Medical Display Market Estimates and Forecasts, by Device Type (2020-2032) (USD Billion)
11.6.8.2 Argentina Medical Display Market Estimates and Forecasts, By Panel Size Type (2020-2032) (USD Billion)
11.6.8.3 Argentina Medical Display Market Estimates and Forecasts, By Resolution (2020-2032) (USD Billion)
11.6.8.4 Argentina Medical Display Market Estimates and Forecasts, by Application (2020-2032) (USD Billion)
11.6.9 Colombia
11.6.9.1 Colombia Medical Display Market Estimates and Forecasts, by Device Type (2020-2032) (USD Billion)
11.6.9.2 Colombia Medical Display Market Estimates and Forecasts, By Panel Size Type (2020-2032) (USD Billion)
11.6.9.3 Colombia Medical Display Market Estimates and Forecasts, By Resolution (2020-2032) (USD Billion)
11.6.9.4 Colombia Medical Display Market Estimates and Forecasts, by Application (2020-2032) (USD Billion)
11.6.10 Rest of Latin America
11.6.10.1 Rest of Latin America Medical Display Market Estimates and Forecasts, by Device Type (2020-2032) (USD Billion)
11.6.10.2 Rest of Latin America Medical Display Market Estimates and Forecasts, By Panel Size Type (2020-2032) (USD Billion)
11.6.10.3 Rest of Latin America Medical Display Market Estimates and Forecasts, By Resolution (2020-2032) (USD Billion)
11.6.10.4 Rest of Latin America Medical Display Market Estimates and Forecasts, by Application (2020-2032) (USD Billion)
12. Company Profiles
12.1 Barco NV
12.1.1 Company Overview
12.1.2 Financial
12.1.3 Products/ Services Offered
12.1.4 SWOT Analysis
12.2 EIZO Corporation
12.2.1 Company Overview
12.2.2 Financial
12.2.3 Products/ Services Offered
12.2.4 SWOT Analysis
12.3 Sony Electronics Inc.
12.3.1 Company Overview
12.3.2 Financial
12.3.3 Products/ Services Offered
12.3.4 SWOT Analysis
12.4 LG Electronics
12.4.1 Company Overview
12.4.2 Financial
12.4.3 Products/ Services Offered
12.4.4 SWOT Analysis
12.5 Siemens Healthineers AG
12.5.1 Company Overview
12.5.2 Financial
12.5.3 Products/ Services Offered
12.5.4 SWOT Analysis
12.6 Advantech Co., Ltd.
12.6.1 Company Overview
12.6.2 Financial
12.6.3 Products/ Services Offered
12.6.4 SWOT Analysis
12.7 NEC Display Solutions
12.7.1 Company Overview
12.7.2 Financial
12.7.3 Products/ Services Offered
12.7.4 SWOT Analysis
12.8 AsusTek Computer Inc.
12.8.1 Company Overview
12.8.2 Financial
12.8.3 Products/ Services Offered
12.8.4 SWOT Analysis
12.9 JVC Kenwood Corporation
12.9.1 Company Overview
12.9.2 Financial
12.9.3 Products/ Services Offered
12.9.4 SWOT Analysis
12.10 FSN Medical Technologies
12.10.1 Company Overview
12.10.2 Financial
12.10.3 Products/ Services Offered
12.10.4 SWOT Analysis
13. Use Cases and Best Practices
14. Conclusion
An accurate research report requires proper strategizing as well as implementation. There are multiple factors involved in the completion of good and accurate research report and selecting the best methodology to compete the research is the toughest part. Since the research reports we provide play a crucial role in any company’s decision-making process, therefore we at SNS Insider always believe that we should choose the best method which gives us results closer to reality. This allows us to reach at a stage wherein we can provide our clients best and accurate investment to output ratio.
Each report that we prepare takes a timeframe of 350-400 business hours for production. Starting from the selection of titles through a couple of in-depth brain storming session to the final QC process before uploading our titles on our website we dedicate around 350 working hours. The titles are selected based on their current market cap and the foreseen CAGR and growth.
The 5 steps process:
Step 1: Secondary Research:
Secondary Research or Desk Research is as the name suggests is a research process wherein, we collect data through the readily available information. In this process we use various paid and unpaid databases which our team has access to and gather data through the same. This includes examining of listed companies’ annual reports, Journals, SEC filling etc. Apart from this our team has access to various associations across the globe across different industries. Lastly, we have exchange relationships with various university as well as individual libraries.

Step 2: Primary Research
When we talk about primary research, it is a type of study in which the researchers collect relevant data samples directly, rather than relying on previously collected data. This type of research is focused on gaining content specific facts that can be sued to solve specific problems. Since the collected data is fresh and first hand therefore it makes the study more accurate and genuine.
We at SNS Insider have divided Primary Research into 2 parts.
Part 1 wherein we interview the KOLs of major players as well as the upcoming ones across various geographic regions. This allows us to have their view over the market scenario and acts as an important tool to come closer to the accurate market numbers. As many as 45 paid and unpaid primary interviews are taken from both the demand and supply side of the industry to make sure we land at an accurate judgement and analysis of the market.
This step involves the triangulation of data wherein our team analyses the interview transcripts, online survey responses and observation of on filed participants. The below mentioned chart should give a better understanding of the part 1 of the primary interview.

Part 2: In this part of primary research the data collected via secondary research and the part 1 of the primary research is validated with the interviews from individual consultants and subject matter experts.
Consultants are those set of people who have at least 12 years of experience and expertise within the industry whereas Subject Matter Experts are those with at least 15 years of experience behind their back within the same space. The data with the help of two main processes i.e., FGDs (Focused Group Discussions) and IDs (Individual Discussions). This gives us a 3rd party nonbiased primary view of the market scenario making it a more dependable one while collation of the data pointers.
Step 3: Data Bank Validation
Once all the information is collected via primary and secondary sources, we run that information for data validation. At our intelligence centre our research heads track a lot of information related to the market which includes the quarterly reports, the daily stock prices, and other relevant information. Our data bank server gets updated every fortnight and that is how the information which we collected using our primary and secondary information is revalidated in real time.

Step 4: QA/QC Process
After all the data collection and validation our team does a final level of quality check and quality assurance to get rid of any unwanted or undesired mistakes. This might include but not limited to getting rid of the any typos, duplication of numbers or missing of any important information. The people involved in this process include technical content writers, research heads and graphics people. Once this process is completed the title gets uploader on our platform for our clients to read it.
Step 5: Final QC/QA Process:
This is the last process and comes when the client has ordered the study. In this process a final QA/QC is done before the study is emailed to the client. Since we believe in giving our clients a good experience of our research studies, therefore, to make sure that we do not lack at our end in any way humanly possible we do a final round of quality check and then dispatch the study to the client.
Key Segments:
By Device Type
Desktop
Mobile
All-in-one
By Panel Size Type
Up to-22.9-inch panels
23.0–26.9-inch panels
27.0–41.9-inch panels
Above-42-inch panels
By Resolution
Up to 2MP
2.1 to 4MP
4.1 to 8MP
Above 8MP
By Application
Radiology
Multi-modality
Surgical
Mammography
Others
Request for Segment Customization as per your Business Requirement: Segment Customization Request
Regional Coverage:
North America
US
Canada
Mexico
Europe
Eastern Europe
Poland
Romania
Hungary
Turkey
Rest of Eastern Europe
Western Europe
Germany
France
UK
Italy
Spain
Netherlands
Switzerland
Austria
Rest of Western Europe
Asia Pacific
China
India
Japan
South Korea
Vietnam
Singapore
Australia
Rest of Asia Pacific
Middle East & Africa
Middle East
UAE
Egypt
Saudi Arabia
Qatar
Rest of Middle East
Africa
Nigeria
South Africa
Rest of Africa
Latin America
Brazil
Argentina
Colombia
Rest of Latin America
Request for Country Level Research Report: Country Level Customization Request
Available Customization
With the given market data, SNS Insider offers customization as per the company’s specific needs. The following customization options are available for the report:
Detailed Volume Analysis
Criss-Cross segment analysis (e.g. Product X Application)
Competitive Product Benchmarking
Geographic Analysis
Additional countries in any of the regions
Customized Data Representation
Detailed analysis and profiling of additional market players
The Inflation Devices Market was USD 577.91 million in 2023 and is expected to reach USD 937.09 million by 2032, growing at a CAGR of 5.01% by 2024-2032.
The Biological Safety Testing Products and Services Market was valued at USD 4.62 billion in 2023 and is expected to reach USD 11.58 billion by 2032, growing at a CAGR of 10.77% over the forecast period of 2024-2032.
The Dual Chamber Prefilled Syringes market size was USD 163.02 million in 2023 and is expected to reach USD 283.01 million by 2032 and grow at a CAGR of 6.32% over the forecast period of 2024-2032.
Veterinary Parasiticides Market Size was valued at USD 9.2 Billion in 2023 and is expected to reach USD 18.03 Billion by 2032, growing at a CAGR of 7.8% over the forecast period 2024-2032.
The Molecular Quality Controls Market size was estimated at USD 0.1 billion in 2023 and is expected to reach USD 0.16 billion by 2031 with a growing CAGR of 6.7% during the forecast period of 2024-2031.
The ATP Assays Market valued USD 0.93 billion in 2023 which is expected to boost USD 1.98 billion by 2032, CAGR 8.77% over the forecast period 2024-2032.

Hi! Click one of our member below to chat on Phone
© 2025 All Rights Reserved by SNS Insider Pvt Ltd


