image

Medical Billing Market Report Scope & Overview:

The Medical Billing Market was valued at USD 15.43 billion in 2023 and is expected to reach USD 41.32 billion by 2032, growing at a CAGR of 11.58% over the forecast period 2024-2032.
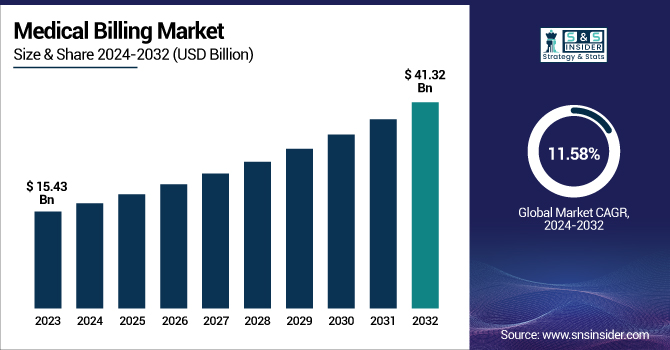
The Medical Billing Market report highlights in-depth insights about the key industry trends impacting the growth of the Medical Billing market. The report discusses the growth of the market and adoption trends for such technologies, and it shows an increasing move to automated billing solutions. The report also reviewed trends around claims processing, including acceptance/rejection rates and processing efficiency. It explores billing mistakes and denial rates and searches for common challenges that hinder revenue cycles. It also helps decipher technology and automation adoption with an extra emphasis on AI-powered solutions and EHR-integrated billing. Revenue distribution and payer mix, which show contributions from Medicare, Medicaid, private insurance, and out-of-pocket payments, are also presented in the study. The report examines regulatory and compliance trends, including policy changes such as ICD-11 and HIPAA updates. It also allows stakeholders to manage intelligently changing billing trends. Rising healthcare spending and regulatory compliance are driving the medical billing market. Market growth is further fueled by the shift toward value-based care and electronic health records (EHRs).

Market Dynamics

Drivers:

  • The integration of artificial intelligence and machine learning enhances accuracy in billing and coding.

Artificial intelligence (AI) and machine learning have revolutionized the field of medical billing, making it more accurate and efficient than ever before. Claims are now processed with over 95% accuracy by AI-powered coding systems that significantly reduce errors compared to traditional manual methods. Such extreme accuracy helps avoid claim denials, leading to speedy reimbursements and an effective revenue cycle for the medical practice. Additionally, approximately 50% to 75% of time spent on billing can be automated by AI, improving operational efficiency and decreasing administrative workload. This automation speeds up the billing process by 30% to 40% and reduces operational costs by 10% to 20%. AI-powered systems, on the other hand, process an average of 750 claims a minute at a single instance of time.

Apart from processing efficiency, AI promotes compliance by sifting through billing patterns to detect possible fraud with 95% accuracy. Such functionality ensures compliance with regulatory requirements and minimizes the potential for financial penalties. Moreover, AI-powered predictive analytics accurately predicts patient payment behaviours with 80% accuracy and equips healthcare organizations to implement proactive revenue collection strategies.  The use of AI in medical billing comes with its own set of challenges. As the example of the algorithm that devolved without supervision illustrates, AI systems cannot function properly without lots of human oversight. Therefore, while AI offers substantial benefits in enhancing billing accuracy and efficiency, continuous human involvement remains crucial to address complexities and maintain system effectiveness.

Restraint:

  • Shortage of skilled professionals in the medical billing industry leads to inefficiencies.

The medical billing industry is currently facing a significant challenge due to a shortage of skilled professionals, leading to inefficiencies and increased operational stress. This shortage contributes to heightened stress among healthcare providers, with 68% identifying medical billing as their primary source of stress. The complexity of billing processes exacerbates this issue, as over 50% of providers consider it a major challenge. Despite the industry's growth, with the U.S. medical billing industry employing over 206,000 people, the demand for skilled professionals continues to outpace supply, leading to inefficiencies in billing operations. This imbalance underscores the need for training programs and technological solutions to mitigate the impact of this workforce shortage.

Opportunity:

  • Developing specialized billing services for niche medical specialties captures untapped market segments.

The medical billing market is witnessing a significant opportunity in developing specialized billing services tailored to niche medical specialties. This trend caters to the domain-specific billing needs of different medical practices, resulting in improved revenue cycle management as well as operational efficiency. Offshore medical billing is one of the most commonly adopted strategies by healthcare providers. This is due in part to third-party providers' extensive services that facilitate billing, cut down on administrative work, and increase performance efficiency. Service providers must mitigate billing errors and comply with constant regulations by integrating advanced technologies. The use of such technology streamlines billing processes, making specialty billing services accurate and efficient.

Outsourced billing service vendors offer the freedom to adapt to changing patient volumes without the added management burden of hiring in-house billing staff. This versatility is especially useful for niche specialties that may get more or less activity, allowing for stable and productive billing processes. This growth is propelled by an influx of patients, increasing complexity in medical billing & coding procedures, broadened coverage of healthcare insurance, and growing healthcare expenditure.

Challenge:

  • Integration of advanced technologies and AI solutions in medical billing systems presents complexities.

Integrating advanced technologies and artificial intelligence (AI) into medical billing systems presents significant challenges, primarily due to the need for substantial human oversight and the potential for AI-driven errors. Despite the promise of AI to automate healthcare processes, in practice, every implementation must be watched over and adjusted by humans. The University of Pennsylvania Health System reported a similar decline from an AI algorithm used to produce support/prognostic tools for its oncologists, an instance that emphasizes the need for continued human oversight to monitor and control the performance of AI over time. Health insurers have also been criticized for using AI in claims decision-making. There are companies, including Cigna, that have done this, using AI algorithms to deny massive numbers of care requests in an instant, at a rate of a decision every 1.2 seconds on average. These practices have led to legislative proposals aimed at restricting the use of AI in patient care, like the bill proposed by Connecticut Senator Saud Anwar, which seeks to limit the use of AI to improve patient care while ensuring that profit is not prioritized over patients. These examples underscore the complexities and ethical considerations associated with integrating AI into medical billing, emphasizing the critical role of human oversight to prevent potential errors and ensure equitable patient care.

Segment Analysis

By Component

The services segment held the largest market share in the medical billing industry in 2023. Services lead this dominance owing to their extensive provision of complete billing solutions and specialized expertise, which enhance healthcare providers billing process. Services range from critical functions such as medical coding, claims submission, denial management, and revenue cycle management, which ensure maximum reimbursement and financial performance. Compliance is mandated by government regulations such as HIPAA, which drives the service segment to contribute the maximum share. This scalability enables these services to adapt to shifting patient volumes and practice scales, rendering them essential for healthcare practices. Advanced technologies such as AI and machine learning in billing services increase efficiency and accuracy, which is one of the reasons behind their growing popularity. Additionally, the need for regulatory compliance and the complexity of billing processes make specialized services essential for healthcare providers.
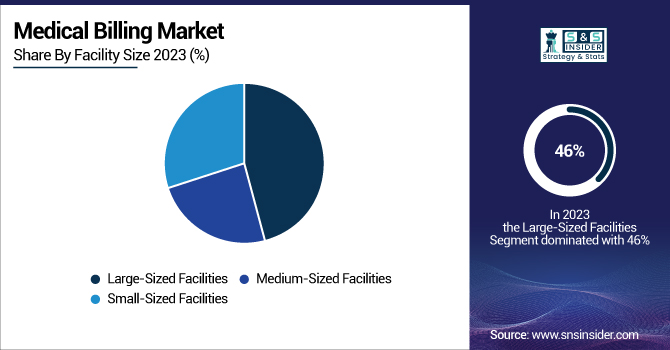
By Facility Size

In 2023, large sized facilities accounted for around 46% of the market. This is due to their extensive resources and ability to invest in advanced billing systems, which streamline revenue cycle management and improve reimbursement rates. Large facilities typically have more advanced billing requirements, and as a result, they require advanced solutions that can process a lot of claims and do it quickly. The government initiatives in support of digital health technologies further spur large facilities to embrace modernized billing systems, improving their operational efficiency and readiness for the future. Large facilities benefit from economies of scale in billing operations and are, therefore more likely to invest in state-of-the-art technologies that can help to lower administrative costs and increase billing accuracy.

By End User

In 2023, the hospitals segment accounted for approximately 45% of the global market share. Hospitals also require a complete billing solution because they perform a high volume of services, and services can be complex. Government policies and regulations, like Medicare and Medicaid, play a very important role in how hospitals submit their bills for services rendered to patients, and this results in complex systems of billing to take care of such legislative avenues to maximise the reimbursement to the hospitals. Hospitals adopting EHR and digital billing systems reinforce their dominance in the market because these technologies improve billing efficiency and accuracy. The billing demands are even more complicated for hospitals, which provide everything from emergency care and surgeries to life-long treatments. This complexity requires advanced billing systems capable of handling diverse claims and ensuring timely reimbursement.
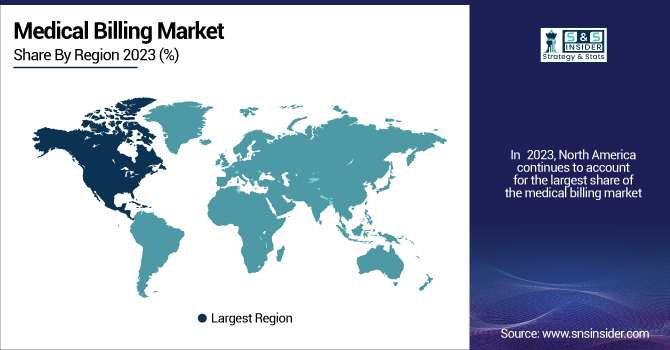
Regional Analysis

In 2023, North America continues to account for the largest share of the medical billing market, with considerable regional disparities. The reason behind this dominance is attributed to the advanced healthcare infrastructure, greater healthcare spending, and higher adoption rate of electronic health records (EHRs) in the region. The healthcare market in the U.S. is already mature, with a focus on digital technologies, paving a suitable platform for the medical billing market to grow. Regulatory Initiatives by the government, including the Centers for Medicare & Medicaid Services (CMS), also significantly influence markets, establishing mandates that require billing to be efficient. The Asia-Pacific region is growing the fastest due to rising investments in healthcare infrastructure and the adoption of digital health. This growth is being driven by countries such as India and China with government initiatives to enhance healthcare accessibility and efficiency. For example, India's National Digital Health Mission (NDHM) envisages a digital health ecosystem, replete with an advanced billing infrastructure to facilitate healthcare services. The growth in this region is also a result of the demand for efficient billing solutions to accommodate the increasing volume of healthcare services.

Key Players

Key Service Providers/Manufacturers

  • Kareo (EHR, Practice Management Software)

  • Infinitercm (Revenue Cycle Management, Credentialing Services)

  • Cerner (PowerChart, Millennium)

  • eClinicalWorks (eClinicalWorks EHR, eClinicalWorks PM)

  • R1 RCM (Revenue Cycle Management Services, Physician Advisory Services)

  • CureMD (CureMD EHR, Practice Management)

  • AdvancedMD (AdvancedMD EHR, Practice Management)

  • PracticeSuite (PracticeSuite EHR, Medical Billing Software)

  • BillingParadise (Medical Billing Services, Denial Management)

  • GeBBS Healthcare Solutions (Revenue Cycle Management, Health Information Management)

  • Tebra (Practice Operations Platform, Patient Experience Enhancements)

  • Veradigm (Practice Management Solutions, EHR Technology)

  • Hyland Software (OnBase, Alfresco)

  • McKesson Corporation (Pharmaceutical Distribution, Health Information Technology)

  • Abridge (AI-Powered Documentation Platform, Clinical Note Transcription)

  • CodaMetrix (AI for Medical Coding, Revenue Cycle Automation)

  • Cohere Health (Prior Authorization Automation, Care Coordination)

  • Anysphere (AI Coding Assistant, Cursor)

  • Attention (CRM Automation, Natural Language Processing Tools)

  • Decagon (AI Support Agents, Customer Inquiry Management)

Recent Developments

  • Veradigm, LLC (US) announced in November 2023, the launch of Veradigm Intelligent Payments, powered by RevSpring within Veradigm Payerpath, which streamlines payment processing and minimizes manual reconciliation for healthcare providers.

  • The U.S. Department of Health and Human Services has made operating EHRs in concert with billing systems a priority to help streamline error reduction and improve reimbursement rates. This integration is expected to become more widespread as healthcare providers seek to optimize their billing processes.

Medical Billing Market Report Scope:

Report Attributes Details
Market Size in 2023 USD 15.43 Billion 
Market Size by 2032 USD 41.32 Billion 
CAGR CAGR of 11.58% From 2024 to 2032
Base Year 2023
Forecast Period 2024-2032
Historical Data 2020-2022
Report Scope & Coverage Market Size, Segments Analysis, Competitive  Landscape, Regional Analysis, DROC & SWOT Analysis, Forecast Outlook
Key Segments • By Component (Software, Services {Professional Services, Managed Services})
• By Facility Size (Large-Sized Facilities, Medium-Sized Facilities, Small-Sized Facilities)
• By End User (Ambulatory Surgery Centers, Hospitals, Specialty Centers {Orthopedic Centers, Oncology Centers, Cardiology Centers, Radiology & Imaging Centers, Other Specialty Centers}, Others)
Regional Analysis/Coverage North America (US, Canada, Mexico), Europe (Eastern Europe [Poland, Romania, Hungary, Turkey, Rest of Eastern Europe] Western Europe] Germany, France, UK, Italy, Spain, Netherlands, Switzerland, Austria, Rest of Western Europe]), Asia Pacific (China, India, Japan, South Korea, Vietnam, Singapore, Australia, Rest of Asia Pacific), Middle East & Africa (Middle East [UAE, Egypt, Saudi Arabia, Qatar, Rest of Middle East], Africa [Nigeria, South Africa, Rest of Africa], Latin America (Brazil, Argentina, Colombia, Rest of Latin America)
Company Profiles Kareo, Infinitercm, Cerner, eClinicalWorks, R1 RCM, CureMD, AdvancedMD, PracticeSuite, BillingParadise, GeBBS Healthcare Solutions, Tebra, Veradigm, Hyland Software, McKesson Corporation, Abridge, CodaMetrix, Cohere Health, Anysphere, Attention, Decagon

Frequently Asked Questions

Ans. The projected market size for the Medical Billing Market is USD 41.32 billion by 2032.

Ans: The North American region dominated the Medical Billing Market in 2023.

Ans. The CAGR of the Medical Billing Market is 11.58% during the forecast period of 2024-2032.

Ans:  The integration of artificial intelligence and machine learning enhances accuracy in billing and coding.

Ans:  The Large-Sized Facilities segment dominated the Medical Billing Market.

Table of Contents

1. Introduction

1.1 Market Definition

1.2 Scope (Inclusion and Exclusions)

1.3 Research Assumptions

2. Executive Summary

2.1 Market Overview

2.2 Regional Synopsis

2.3 Competitive Summary

3. Research Methodology

3.1 Top-Down Approach

3.2 Bottom-up Approach

3.3. Data Validation

3.4 Primary Interviews

4. Market Dynamics Impact Analysis

4.1 Market Driving Factors Analysis

4.1.1 Drivers

4.1.2 Restraints

4.1.3 Opportunities

4.1.4 Challenges

4.2 PESTLE Analysis

4.3 Porter’s Five Forces Model

5. Statistical Insights and Trends Reporting

5.1 Market Growth & Adoption Trends (2023-2032)

5.2 Claim Processing Trends (2023)

5.3 Billing Errors & Denial Rates (2023)

5.4 Technology & Automation Adoption (2023)

5.5 Revenue Distribution & Payer Mix (2023)

6. Competitive Landscape

6.1 List of Major Companies, By Region

6.2 Market Share Analysis, By Region

6.3 Product Benchmarking

6.3.1 Product specifications and features

6.3.2 Pricing

6.4 Strategic Initiatives

6.4.1 Marketing and promotional activities

6.4.2 Distribution and Supply Chain Strategies

6.4.3 Expansion plans and new product launches

6.4.4 Strategic partnerships and collaborations

6.5 Technological Advancements

6.6 Market Positioning and Branding

7. Medical Billing Market Segmentation, By Component

7.1 Chapter Overview

7.2 Software

7.2.1 Software Market Trends Analysis (2020-2032)

7.2.2 Software Market Size Estimates and Forecasts to 2032 (USD Billion)

7.3 Services

7.3.1 Services Market Trends Analysis (2020-2032)

7.3.2 Services Market Size Estimates and Forecasts to 2032 (USD Billion)

7.3.3 Professional Services

7.3.3.1 Professional Services Market Trends Analysis (2020-2032)

7.3.3.2 Professional Services Market Size Estimates and Forecasts to 2032 (USD Billion)

7.3.4 Managed Services

7.3.4.1 Managed Services Market Trends Analysis (2020-2032)

7.3.4.2 Managed Services Market Size Estimates and Forecasts to 2032 (USD Billion)

8. Medical Billing Market Segmentation, By Facility Size

8.1 Chapter Overview

8.2 Large-Sized Facilities

8.2.1 Large-Sized Facilities Market Trends Analysis (2020-2032)

8.2.2 Large-Sized Facilities Market Size Estimates and Forecasts to 2032 (USD Billion)

8.3 Medium-Sized Facilities

8.3.1 Medium-Sized Facilities Market Trends Analysis (2020-2032)

8.3.2 Medium-Sized Facilities Market Size Estimates and Forecasts to 2032 (USD Billion)

8.4 Small-Sized Facilities

8.4.1 Small-Sized Facilities Market Trends Analysis (2020-2032)

8.4.2 Small-Sized Facilities Market Size Estimates and Forecasts to 2032 (USD Billion)

9. Medical Billing Market Segmentation, By End User

9.1 Chapter Overview

9.2 Ambulatory Surgery Centers

9.2.1 Ambulatory Surgery Centers Market Trends Analysis (2020-2032)

9.2.2 Ambulatory Surgery Centers Market Size Estimates and Forecasts to 2032 (USD Billion)

9.3 Hospitals

9.3.1 Hospitals Market Trends Analysis (2020-2032)

9.3.2 Hospitals Market Size Estimates and Forecasts to 2032 (USD Billion)

9.4 Specialty Centers

9.4.1 Specialty Centers Market Trends Analysis (2020-2032)

9.4.2 Specialty Centers Market Size Estimates and Forecasts to 2032 (USD Billion)

9.4.3 Orthopedic Centers

9.4.3.1 Orthopedic Centers Market Trends Analysis (2020-2032)

9.4.3.2 Orthopedic Centers Market Size Estimates and Forecasts to 2032 (USD Billion)

9.4.4 Oncology Centers

9.4.4.1 Oncology Centers Market Trends Analysis (2020-2032)

9.4.4.2 Oncology Centers Market Size Estimates and Forecasts to 2032 (USD Billion)

9.4.5 Cardiology Centers

9.4.5.1 Cardiology Centers Market Trends Analysis (2020-2032)

9.4.5.2 Cardiology Centers Market Size Estimates and Forecasts to 2032 (USD Billion)

9.4.6 Radiology & Imaging Centers

9.4.6.1 Radiology & Imaging Centers Market Trends Analysis (2020-2032)

9.4.6.2 Radiology & Imaging Centers Market Size Estimates and Forecasts to 2032 (USD Billion)

9.4.7 Other Specialty Centers

9.4.7.1 Other Specialty Centers Market Trends Analysis (2020-2032)

9.4.7.2 Other Specialty Centers Market Size Estimates and Forecasts to 2032 (USD Billion)

9.5 Others

9.5.1 Others Market Trends Analysis (2020-2032)

9.5.2 Others Market Size Estimates and Forecasts to 2032 (USD Billion)

10. Regional Analysis

10.1 Chapter Overview

10.2 North America

10.2.1 Trends Analysis

10.2.2 North America Medical Billing Market Estimates and Forecasts, by Country (2020-2032) (USD Billion)

10.2.3 North America Medical Billing Market Estimates and Forecasts, By Component (2020-2032) (USD Billion) 

10.2.4 North America Medical Billing Market Estimates and Forecasts, By Facility Size (2020-2032) (USD Billion)

10.2.5 North America Medical Billing Market Estimates and Forecasts, By End User (2020-2032) (USD Billion)

10.2.6 USA

10.2.6.1 USA Medical Billing Market Estimates and Forecasts, By Component (2020-2032) (USD Billion)

10.2.6.2 USA Medical Billing Market Estimates and Forecasts, By Facility Size (2020-2032) (USD Billion)

10.2.6.3 USA Medical Billing Market Estimates and Forecasts, By End User (2020-2032) (USD Billion)

10.2.7 Canada

10.2.7.1 Canada Medical Billing Market Estimates and Forecasts, By Component (2020-2032) (USD Billion)

10.2.7.2 Canada Medical Billing Market Estimates and Forecasts, By Facility Size (2020-2032) (USD Billion)

10.2.7.3 Canada Medical Billing Market Estimates and Forecasts, By End User (2020-2032) (USD Billion)

10.2.8 Mexico

10.2.8.1 Mexico Medical Billing Market Estimates and Forecasts, By Component (2020-2032) (USD Billion)

10.2.8.2 Mexico Medical Billing Market Estimates and Forecasts, By Facility Size (2020-2032) (USD Billion)

10.2.8.3 Mexico Medical Billing Market Estimates and Forecasts, By End User (2020-2032) (USD Billion)

10.3 Europe

10.3.1 Eastern Europe

10.3.1.1 Trends Analysis

10.3.1.2 Eastern Europe Medical Billing Market Estimates and Forecasts, by Country (2020-2032) (USD Billion)

10.3.1.3 Eastern Europe Medical Billing Market Estimates and Forecasts, By Component (2020-2032) (USD Billion) 

10.3.1.4 Eastern Europe Medical Billing Market Estimates and Forecasts, By Facility Size (2020-2032) (USD Billion)

10.3.1.5 Eastern Europe Medical Billing Market Estimates and Forecasts, By End User (2020-2032) (USD Billion)

10.3.1.6 Poland

10.3.1.6.1 Poland Medical Billing Market Estimates and Forecasts, By Component (2020-2032) (USD Billion)

10.3.1.6.2 Poland Medical Billing Market Estimates and Forecasts, By Facility Size (2020-2032) (USD Billion)

10.3.1.6.3 Poland Medical Billing Market Estimates and Forecasts, By End User (2020-2032) (USD Billion)

10.3.1.7 Romania

10.3.1.7.1 Romania Medical Billing Market Estimates and Forecasts, By Component (2020-2032) (USD Billion)

10.3.1.7.2 Romania Medical Billing Market Estimates and Forecasts, By Facility Size (2020-2032) (USD Billion)

10.3.1.7.3 Romania Medical Billing Market Estimates and Forecasts, By End User (2020-2032) (USD Billion)

10.3.1.8 Hungary

10.3.1.8.1 Hungary Medical Billing Market Estimates and Forecasts, By Component (2020-2032) (USD Billion)

10.3.1.8.2 Hungary Medical Billing Market Estimates and Forecasts, By Facility Size (2020-2032) (USD Billion)

10.3.1.8.3 Hungary Medical Billing Market Estimates and Forecasts, By End User (2020-2032) (USD Billion)

10.3.1.9 Turkey

10.3.1.9.1 Turkey Medical Billing Market Estimates and Forecasts, By Component (2020-2032) (USD Billion)

10.3.1.9.2 Turkey Medical Billing Market Estimates and Forecasts, By Facility Size (2020-2032) (USD Billion)

10.3.1.9.3 Turkey Medical Billing Market Estimates and Forecasts, By End User (2020-2032) (USD Billion)

10.3.1.10 Rest of Eastern Europe

10.3.1.10.1 Rest of Eastern Europe Medical Billing Market Estimates and Forecasts, By Component (2020-2032) (USD Billion)

10.3.1.10.2 Rest of Eastern Europe Medical Billing Market Estimates and Forecasts, By Facility Size (2020-2032) (USD Billion)

10.3.1.10.3 Rest of Eastern Europe Medical Billing Market Estimates and Forecasts, By End User (2020-2032) (USD Billion)

10.3.2 Western Europe

10.3.2.1 Trends Analysis

10.3.2.2 Western Europe Medical Billing Market Estimates and Forecasts, by Country (2020-2032) (USD Billion)

10.3.2.3 Western Europe Medical Billing Market Estimates and Forecasts, By Component (2020-2032) (USD Billion) 

10.3.2.4 Western Europe Medical Billing Market Estimates and Forecasts, By Facility Size (2020-2032) (USD Billion)

10.3.2.5 Western Europe Medical Billing Market Estimates and Forecasts, By End User (2020-2032) (USD Billion)

10.3.2.6 Germany

10.3.2.6.1 Germany Medical Billing Market Estimates and Forecasts, By Component (2020-2032) (USD Billion)

10.3.2.6.2 Germany Medical Billing Market Estimates and Forecasts, By Facility Size (2020-2032) (USD Billion)

10.3.2.6.3 Germany Medical Billing Market Estimates and Forecasts, By End User (2020-2032) (USD Billion)

10.3.2.7 France

10.3.2.7.1 France Medical Billing Market Estimates and Forecasts, By Component (2020-2032) (USD Billion)

10.3.2.7.2 France Medical Billing Market Estimates and Forecasts, By Facility Size (2020-2032) (USD Billion)

10.3.2.7.3 France Medical Billing Market Estimates and Forecasts, By End User (2020-2032) (USD Billion)

10.3.2.8 UK

10.3.2.8.1 UK Medical Billing Market Estimates and Forecasts, By Component (2020-2032) (USD Billion)

10.3.2.8.2 UK Medical Billing Market Estimates and Forecasts, By Facility Size (2020-2032) (USD Billion)

10.3.2.8.3 UK Medical Billing Market Estimates and Forecasts, By End User (2020-2032) (USD Billion)

10.3.2.9 Italy

10.3.2.9.1 Italy Medical Billing Market Estimates and Forecasts, By Component (2020-2032) (USD Billion)

10.3.2.9.2 Italy Medical Billing Market Estimates and Forecasts, By Facility Size (2020-2032) (USD Billion)

10.3.2.9.3 Italy Medical Billing Market Estimates and Forecasts, By End User (2020-2032) (USD Billion)

10.3.2.10 Spain

10.3.2.10.1 Spain Medical Billing Market Estimates and Forecasts, By Component (2020-2032) (USD Billion)

10.3.2.10.2 Spain Medical Billing Market Estimates and Forecasts, By Facility Size (2020-2032) (USD Billion)

10.3.2.10.3 Spain Medical Billing Market Estimates and Forecasts, By End User (2020-2032) (USD Billion)

10.3.2.11 Netherlands

10.3.2.11.1 Netherlands Medical Billing Market Estimates and Forecasts, By Component (2020-2032) (USD Billion)

10.3.2.11.2 Netherlands Medical Billing Market Estimates and Forecasts, By Facility Size (2020-2032) (USD Billion)

10.3.2.11.3 Netherlands Medical Billing Market Estimates and Forecasts, By End User (2020-2032) (USD Billion)

10.3.2.12 Switzerland

10.3.2.12.1 Switzerland Medical Billing Market Estimates and Forecasts, By Component (2020-2032) (USD Billion)

10.3.2.12.2 Switzerland Medical Billing Market Estimates and Forecasts, By Facility Size (2020-2032) (USD Billion)

10.3.2.12.3 Switzerland Medical Billing Market Estimates and Forecasts, By End User (2020-2032) (USD Billion)

10.3.2.13 Austria

10.3.2.13.1 Austria Medical Billing Market Estimates and Forecasts, By Component (2020-2032) (USD Billion)

10.3.2.13.2 Austria Medical Billing Market Estimates and Forecasts, By Facility Size (2020-2032) (USD Billion)

10.3.2.13.3 Austria Medical Billing Market Estimates and Forecasts, By End User (2020-2032) (USD Billion)

10.3.2.14 Rest of Western Europe

10.3.2.14.1 Rest of Western Europe Medical Billing Market Estimates and Forecasts, By Component (2020-2032) (USD Billion)

10.3.2.14.2 Rest of Western Europe Medical Billing Market Estimates and Forecasts, By Facility Size (2020-2032) (USD Billion)

10.3.2.14.3 Rest of Western Europe Medical Billing Market Estimates and Forecasts, By End User (2020-2032) (USD Billion)

10.4 Asia Pacific

10.4.1 Trends Analysis

10.4.2 Asia Pacific Medical Billing Market Estimates and Forecasts, by Country (2020-2032) (USD Billion)

10.4.3 Asia Pacific Medical Billing Market Estimates and Forecasts, By Component (2020-2032) (USD Billion) 

10.4.4 Asia Pacific Medical Billing Market Estimates and Forecasts, By Facility Size (2020-2032) (USD Billion)

10.4.5 Asia Pacific Medical Billing Market Estimates and Forecasts, By End User (2020-2032) (USD Billion)

10.4.6 China

10.4.6.1 China Medical Billing Market Estimates and Forecasts, By Component (2020-2032) (USD Billion)

10.4.6.2 China Medical Billing Market Estimates and Forecasts, By Facility Size (2020-2032) (USD Billion)

10.4.6.3 China Medical Billing Market Estimates and Forecasts, By End User (2020-2032) (USD Billion)

10.4.7 India

10.4.7.1 India Medical Billing Market Estimates and Forecasts, By Component (2020-2032) (USD Billion)

10.4.7.2 India Medical Billing Market Estimates and Forecasts, By Facility Size (2020-2032) (USD Billion)

10.4.7.3 India Medical Billing Market Estimates and Forecasts, By End User (2020-2032) (USD Billion)

10.4.8 Japan

10.4.8.1 Japan Medical Billing Market Estimates and Forecasts, By Component (2020-2032) (USD Billion)

10.4.8.2 Japan Medical Billing Market Estimates and Forecasts, By Facility Size (2020-2032) (USD Billion)

10.4.8.3 Japan Medical Billing Market Estimates and Forecasts, By End User (2020-2032) (USD Billion)

10.4.9 South Korea

10.4.9.1 South Korea Medical Billing Market Estimates and Forecasts, By Component (2020-2032) (USD Billion)

10.4.9.2 South Korea Medical Billing Market Estimates and Forecasts, By Facility Size (2020-2032) (USD Billion)

10.4.9.3 South Korea Medical Billing Market Estimates and Forecasts, By End User (2020-2032) (USD Billion)

10.4.10 Vietnam

10.4.10.1 Vietnam Medical Billing Market Estimates and Forecasts, By Component (2020-2032) (USD Billion)

10.4.10.2 Vietnam Medical Billing Market Estimates and Forecasts, By Facility Size (2020-2032) (USD Billion)

10.4.10.3 Vietnam Medical Billing Market Estimates and Forecasts, By End User (2020-2032) (USD Billion)

10.4.11 Singapore

10.4.11.1 Singapore Medical Billing Market Estimates and Forecasts, By Component (2020-2032) (USD Billion)

10.4.11.2 Singapore Medical Billing Market Estimates and Forecasts, By Facility Size (2020-2032) (USD Billion)

10.4.11.3 Singapore Medical Billing Market Estimates and Forecasts, By End User (2020-2032) (USD Billion)

10.4.12 Australia

10.4.12.1 Australia Medical Billing Market Estimates and Forecasts, By Component (2020-2032) (USD Billion)

10.4.12.2 Australia Medical Billing Market Estimates and Forecasts, By Facility Size (2020-2032) (USD Billion)

10.4.12.3 Australia Medical Billing Market Estimates and Forecasts, By End User (2020-2032) (USD Billion)

10.4.13 Rest of Asia Pacific

10.4.13.1 Rest of Asia Pacific Medical Billing Market Estimates and Forecasts, By Component (2020-2032) (USD Billion)

10.4.13.2 Rest of Asia Pacific Medical Billing Market Estimates and Forecasts, By Facility Size (2020-2032) (USD Billion)

10.4.13.3 Rest of Asia Pacific Medical Billing Market Estimates and Forecasts, By End User (2020-2032) (USD Billion)

10.5 Middle East and Africa

10.5.1 Middle East

10.5.1.1 Trends Analysis

10.5.1.2 Middle East Medical Billing Market Estimates and Forecasts, by Country (2020-2032) (USD Billion)

10.5.1.3 Middle East Medical Billing Market Estimates and Forecasts, By Component (2020-2032) (USD Billion) 

10.5.1.4 Middle East Medical Billing Market Estimates and Forecasts, By Facility Size (2020-2032) (USD Billion)

10.5.1.5 Middle East Medical Billing Market Estimates and Forecasts, By End User (2020-2032) (USD Billion)

10.5.1.6 UAE

10.5.1.6.1 UAE Medical Billing Market Estimates and Forecasts, By Component (2020-2032) (USD Billion)

10.5.1.6.2 UAE Medical Billing Market Estimates and Forecasts, By Facility Size (2020-2032) (USD Billion)

10.5.1.6.3 UAE Medical Billing Market Estimates and Forecasts, By End User (2020-2032) (USD Billion)

10.5.1.7 Egypt

10.5.1.7.1 Egypt Medical Billing Market Estimates and Forecasts, By Component (2020-2032) (USD Billion)

10.5.1.7.2 Egypt Medical Billing Market Estimates and Forecasts, By Facility Size (2020-2032) (USD Billion)

10.5.1.7.3 Egypt Medical Billing Market Estimates and Forecasts, By End User (2020-2032) (USD Billion)

10.5.1.8 Saudi Arabia

10.5.1.8.1 Saudi Arabia Medical Billing Market Estimates and Forecasts, By Component (2020-2032) (USD Billion)

10.5.1.8.2 Saudi Arabia Medical Billing Market Estimates and Forecasts, By Facility Size (2020-2032) (USD Billion)

10.5.1.8.3 Saudi Arabia Medical Billing Market Estimates and Forecasts, By End User (2020-2032) (USD Billion)

10.5.1.9 Qatar

10.5.1.9.1 Qatar Medical Billing Market Estimates and Forecasts, By Component (2020-2032) (USD Billion)

10.5.1.9.2 Qatar Medical Billing Market Estimates and Forecasts, By Facility Size (2020-2032) (USD Billion)

10.5.1.9.3 Qatar Medical Billing Market Estimates and Forecasts, By End User (2020-2032) (USD Billion)

10.5.1.10 Rest of Middle East

10.5.1.10.1 Rest of Middle East Medical Billing Market Estimates and Forecasts, By Component (2020-2032) (USD Billion)

10.5.1.10.2 Rest of Middle East Medical Billing Market Estimates and Forecasts, By Facility Size (2020-2032) (USD Billion)

10.5.1.10.3 Rest of Middle East Medical Billing Market Estimates and Forecasts, By End User (2020-2032) (USD Billion)

10.5.2 Africa

10.5.2.1 Trends Analysis

10.5.2.2 Africa Medical Billing Market Estimates and Forecasts, by Country (2020-2032) (USD Billion)

10.5.2.3 Africa Medical Billing Market Estimates and Forecasts, By Component (2020-2032) (USD Billion) 

10.5.2.4 Africa Medical Billing Market Estimates and Forecasts, By Facility Size (2020-2032) (USD Billion)

10.5.2.5 Africa Medical Billing Market Estimates and Forecasts, By End User (2020-2032) (USD Billion)

10.5.2.6 South Africa

10.5.2.6.1 South Africa Medical Billing Market Estimates and Forecasts, By Component (2020-2032) (USD Billion)

10.5.2.6.2 South Africa Medical Billing Market Estimates and Forecasts, By Facility Size (2020-2032) (USD Billion)

10.5.2.6.3 South Africa Medical Billing Market Estimates and Forecasts, By End User (2020-2032) (USD Billion)

10.5.2.7 Nigeria

10.5.2.7.1 Nigeria Medical Billing Market Estimates and Forecasts, By Component (2020-2032) (USD Billion)

10.5.2.7.2 Nigeria Medical Billing Market Estimates and Forecasts, By Facility Size (2020-2032) (USD Billion)

10.5.2.7.3 Nigeria Medical Billing Market Estimates and Forecasts, By End User (2020-2032) (USD Billion)

10.5.2.8 Rest of Africa

10.5.2.8.1 Rest of Africa Medical Billing Market Estimates and Forecasts, By Component (2020-2032) (USD Billion)

10.5.2.8.2 Rest of Africa Medical Billing Market Estimates and Forecasts, By Facility Size (2020-2032) (USD Billion)

10.5.2.8.3 Rest of Africa Medical Billing Market Estimates and Forecasts, By End User (2020-2032) (USD Billion)

10.6 Latin America

10.6.1 Trends Analysis

10.6.2 Latin America Medical Billing Market Estimates and Forecasts, by Country (2020-2032) (USD Billion)

10.6.3 Latin America Medical Billing Market Estimates and Forecasts, By Component (2020-2032) (USD Billion) 

10.6.4 Latin America Medical Billing Market Estimates and Forecasts, By Facility Size (2020-2032) (USD Billion)

10.6.5 Latin America Medical Billing Market Estimates and Forecasts, By End User (2020-2032) (USD Billion)

10.6.6 Brazil

10.6.6.1 Brazil Medical Billing Market Estimates and Forecasts, By Component (2020-2032) (USD Billion)

10.6.6.2 Brazil Medical Billing Market Estimates and Forecasts, By Facility Size (2020-2032) (USD Billion)

10.6.6.3 Brazil Medical Billing Market Estimates and Forecasts, By End User (2020-2032) (USD Billion)

10.6.7 Argentina

10.6.7.1 Argentina Medical Billing Market Estimates and Forecasts, By Component (2020-2032) (USD Billion)

10.6.7.2 Argentina Medical Billing Market Estimates and Forecasts, By Facility Size (2020-2032) (USD Billion)

10.6.7.3 Argentina Medical Billing Market Estimates and Forecasts, By End User (2020-2032) (USD Billion)

10.6.8 Colombia

10.6.8.1 Colombia Medical Billing Market Estimates and Forecasts, By Component (2020-2032) (USD Billion)

10.6.8.2 Colombia Medical Billing Market Estimates and Forecasts, By Facility Size (2020-2032) (USD Billion)

10.6.8.3 Colombia Medical Billing Market Estimates and Forecasts, By End User (2020-2032) (USD Billion)

10.6.9 Rest of Latin America

10.6.9.1 Rest of Latin America Medical Billing Market Estimates and Forecasts, By Component (2020-2032) (USD Billion)

10.6.9.2 Rest of Latin America Medical Billing Market Estimates and Forecasts, By Facility Size (2020-2032) (USD Billion)

10.6.9.3 Rest of Latin America Medical Billing Market Estimates and Forecasts, By End User (2020-2032) (USD Billion)

11. Company Profiles

11.1 Kareo

11.1.1 Company Overview

11.1.2 Financial

11.1.3 Products/ Services Offered

11.1.4 SWOT Analysis

11.2 Infinitercm

11.2.1 Company Overview

11.2.2 Financial

11.2.3 Products/ Services Offered

11.2.4 SWOT Analysis

11.3 Cerner

11.3.1 Company Overview

11.3.2 Financial

11.3.3 Products/ Services Offered

11.3.4 SWOT Analysis

11.4 eClinicalWorks

11.4.1 Company Overview

11.4.2 Financial

11.4.3 Products/ Services Offered

11.4.4 SWOT Analysis

11.5 R1 RCM

11.5.1 Company Overview

11.5.2 Financial

11.5.3 Products/ Services Offered

11.5.4 SWOT Analysis

11.6 CureMD

11.6.1 Company Overview

11.6.2 Financial

11.6.3 Products/ Services Offered

11.6.4 SWOT Analysis

11.7 AdvancedMD

11.7.1 Company Overview

11.7.2 Financial

11.7.3 Products/ Services Offered

11.7.4 SWOT Analysis

11.8 PracticeSuite

11.8.1 Company Overview

11.8.2 Financial

11.8.3 Products/ Services Offered

11.8.4 SWOT Analysis

11.9 BillingParadise

11.9.1 Company Overview

11.9.2 Financial

11.9.3 Products/ Services Offered

11.9.4 SWOT Analysis

11.10 GeBBS Healthcare Solutions

11.10.1 Company Overview

11.10.2 Financial

11.10.3 Products/ Services Offered

11.10.4 SWOT Analysis

12. Use Cases and Best Practices

13. Conclusion

An accurate research report requires proper strategizing as well as implementation. There are multiple factors involved in the completion of good and accurate research report and selecting the best methodology to compete the research is the toughest part. Since the research reports we provide play a crucial role in any company’s decision-making process, therefore we at SNS Insider always believe that we should choose the best method which gives us results closer to reality. This allows us to reach at a stage wherein we can provide our clients best and accurate investment to output ratio.

Each report that we prepare takes a timeframe of 350-400 business hours for production. Starting from the selection of titles through a couple of in-depth brain storming session to the final QC process before uploading our titles on our website we dedicate around 350 working hours. The titles are selected based on their current market cap and the foreseen CAGR and growth.


The 5 steps process:

Step 1: Secondary Research:

Secondary Research or Desk Research is as the name suggests is a research process wherein, we collect data through the readily available information. In this process we use various paid and unpaid databases which our team has access to and gather data through the same. This includes examining of listed companies’ annual reports, Journals, SEC filling etc. Apart from this our team has access to various associations across the globe across different industries. Lastly, we have exchange relationships with various university as well as individual libraries.

Secondary Research

Step 2: Primary Research

When we talk about primary research, it is a type of study in which the researchers collect relevant data samples directly, rather than relying on previously collected data.  This type of research is focused on gaining content specific facts that can be sued to solve specific problems. Since the collected data is fresh and first hand therefore it makes the study more accurate and genuine.

We at SNS Insider have divided Primary Research into 2 parts.

Part 1 wherein we interview the KOLs of major players as well as the upcoming ones across various geographic regions. This allows us to have their view over the market scenario and acts as an important tool to come closer to the accurate market numbers. As many as 45 paid and unpaid primary interviews are taken from both the demand and supply side of the industry to make sure we land at an accurate judgement and analysis of the market.

This step involves the triangulation of data wherein our team analyses the interview transcripts, online survey responses and observation of on filed participants. The below mentioned chart should give a better understanding of the part 1 of the primary interview.

Primary Research

Part 2: In this part of primary research the data collected via secondary research and the part 1 of the primary research is validated with the interviews from individual consultants and subject matter experts.

Consultants are those set of people who have at least 12 years of experience and expertise within the industry whereas Subject Matter Experts are those with at least 15 years of experience behind their back within the same space. The data with the help of two main processes i.e., FGDs (Focused Group Discussions) and IDs (Individual Discussions). This gives us a 3rd party nonbiased primary view of the market scenario making it a more dependable one while collation of the data pointers.

Step 3: Data Bank Validation

Once all the information is collected via primary and secondary sources, we run that information for data validation. At our intelligence centre our research heads track a lot of information related to the market which includes the quarterly reports, the daily stock prices, and other relevant information. Our data bank server gets updated every fortnight and that is how the information which we collected using our primary and secondary information is revalidated in real time.

Data Bank Validation

Step 4: QA/QC Process

After all the data collection and validation our team does a final level of quality check and quality assurance to get rid of any unwanted or undesired mistakes. This might include but not limited to getting rid of the any typos, duplication of numbers or missing of any important information. The people involved in this process include technical content writers, research heads and graphics people. Once this process is completed the title gets uploader on our platform for our clients to read it.

Step 5: Final QC/QA Process:

This is the last process and comes when the client has ordered the study. In this process a final QA/QC is done before the study is emailed to the client. Since we believe in giving our clients a good experience of our research studies, therefore, to make sure that we do not lack at our end in any way humanly possible we do a final round of quality check and then dispatch the study to the client.

Key Segments:

By Component

  • Software

  • Services

    • Professional Services

    • Managed Services

By Facility Size

  • Large-Sized Facilities

  • Medium-Sized Facilities

  • Small-Sized Facilities

By End User

  • Ambulatory Surgery Centers

  • Hospitals

  • Specialty Centers

    • Orthopedic Centers

    • Oncology Centers

    • Cardiology Centers

    • Radiology & Imaging Centers

    • Other Specialty Centers

  • Other End Users

Request for Segment Customization as per your Business Requirement: Segment Customization Request

Regional Coverage:

North America

  • US

  • Canada

  • Mexico

Europe

  • Eastern Europe

    • Poland

    • Romania

    • Hungary

    • Turkey

    • Rest of Eastern Europe

  • Western Europe

    • Germany

    • France

    • UK

    • Italy

    • Spain

    • Netherlands

    • Switzerland

    • Austria

    • Rest of Western Europe

Asia Pacific

  • China

  • India

  • Japan

  • South Korea

  • Vietnam

  • Singapore

  • Australia

  • Rest of Asia Pacific

Middle East & Africa

  • Middle East

    • UAE

    • Egypt

    • Saudi Arabia

    • Qatar

    • Rest of Middle East

  • Africa

    • Nigeria

    • South Africa

    • Rest of Africa

Latin America

  • Brazil

  • Argentina

  • Colombia

  • Rest of Latin America

Request for Country Level Research Report: Country Level Customization Request

Available Customization

With the given market data, SNS Insider offers customization as per the company’s specific needs. The following customization options are available for the report:

  • Detailed Volume Analysis

  • Criss-Cross segment analysis (e.g. Product X Application)

  • Competitive Product Benchmarking

  • Geographic Analysis

  • Additional countries in any of the regions

  • Customized Data Representation

  • Detailed analysis and profiling of additional market players


  •            5000 (33% Discount)


  •            8950 (40% Discount)


  •            3050 (23% Discount)

Start a Conversation

Hi! Click one of our member below to chat on Phone