image

Marine Electric Vehicle Market Report Scope & Overview:
Marine Electric Vehicle Market Revenue Analysis

To get more information on Marine Electric Vehicle Market - Request Free Sample Report

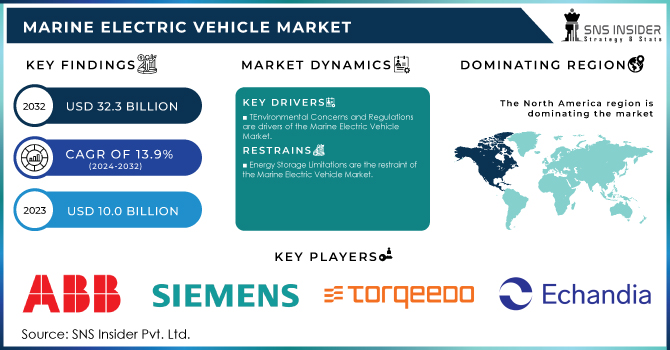
The Marine Electric Vehicle Market Size was valued at USD 10.0 billion in 2023 and is expected to reach USD 32.3 billion by 2032 and grow at a CAGR of 13.9% over the forecast period 2024-2032.

Marine electric vehicles (EVs) are zero-emission transportation systems powered by renewable energy sources (RES). When compared to fossil-fuel-powered maritime vessels, these vehicles require less maintenance, have lower operating expenses, and are more environmentally benign. Marine EVs are also suited for wildlife trips since they lessen waves, boost speed, and produce less noise. Furthermore, a substantial movement in preference from diesel-powered to hybrid electric boats is favourably boosting marine EV sales for both commercial and recreational purposes.

Because of expanding shipping demand and growing environmental concerns, there is a greater need for low and zero-emission vessels (ZEVs). This, together with the rising trend of digitization and automation, as well as the depletion of fossil fuels, is one of the major drivers driving the growth of the marine EV industry. Furthermore, rising discretionary incomes are fuelling sales of seagoing enclosed yachts, ferries, workboats, personal submarines, scuba sea scooters, and autonomous underwater vehicles (AUVs). This is also backed by the expanding travel and tourist industry, which is boosting the use of surface boats for leisure and recreational purposes.

The push for cleaner and more sustainable transportation solutions has driven interest in electrification across industries, including marine transportation. Stringent emissions regulations and policies aimed at reducing the carbon footprint of maritime activities have encouraged the adoption of electric propulsion systems. Improvements in battery technology, energy storage, and electric motor efficiency have made electric propulsion more feasible for marine applications.

Over the long term, electric propulsion systems can offer operational cost savings through reduced fuel consumption and maintenance requirements. Short-distance passenger ferries have been a primary focus for electrification due to their predictable routes and relatively short operating ranges. Electric propulsion is becoming popular among boaters looking for quieter, emission-free, and lower-maintenance alternatives to traditional gasoline-powered engines. Electric propulsion systems are being explored for various cargo and workboats operating in ports, harbours, and inland waterways.

Scientific research vessels often prioritize low emissions and quiet operation, making electric propulsion an attractive option. The development of charging or refuelling infrastructure for electric marine vehicles, especially for larger vessels, can be a challenge. Range limitations due to the energy density of batteries can be a concern for vessels that need to operate over longer distances.

MARKET DYNAMICS

DRIVERS:

  • Many countries and international organizations set emission reduction targets for the shipping industry

  • Environmental Concerns and Regulations are drivers of the Marine Electric Vehicle Market.

Concerns about climate change and air quality have led to increased pressure on industries to reduce their carbon footprint. Maritime transportation, traditionally reliant on fossil fuels, has faced scrutiny due to its emissions. Stringent regulations, such as emissions caps and fuel efficiency standards, have encouraged the maritime industry to explore cleaner alternatives like electric propulsion to meet these requirements.

RESTRAIN:

  • The size and weight of batteries can be a challenge for vessels with limited space available for energy storage.

  • Energy Storage Limitations are the restraint of the Marine Electric Vehicle Market.

Electric marine vehicles, especially those with higher power requirements and longer operational ranges, may face range limitations due to the energy density and weight of available batteries. This could impact their ability to operate over extended distances without frequent recharging.

OPPORTUNITY:

  • The shift towards cleaner and more sustainable transportation solutions offers a significant opportunity for electric marine vehicles.

  • Innovation and Technological Advancement is an opportunity for the Marine Electric Vehicle Market.

Continued advancements in battery technology, energy storage, electric motors, and power electronics can lead to more efficient and powerful electric propulsion systems, overcoming some of the current limitations.

CHALLENGES:

  • The maritime industry is subject to strict safety regulations and certification standards.

  • Initial Costs are the challenges of the Marine Electric Vehicle Market.

The initial capital cost of purchasing electric marine vehicles and setting up the required charging infrastructure can be higher compared to traditional vessels with internal combustion engines.

IMPACT OF RUSSIAN UKRAINE WAR

Russia launched a large-scale invasion of Ukraine, marching its borders with some 150,000 troops. At the time, the global economy was on its path to recovering and regaining its pre-pandemic strength. However, this onslaught not only harmed Ukraine's and Russia's economies, but also those of nearby European nations such as Moldova, Hungary, Poland, Slovakia, and Romania; the United Kingdom is no exception. Aside from the human tragedy and death toll, this also had an impact on the e-mobility sector in the UK and other European nations due to their reliance on Russia for raw materials and energy required for the progress of electric cars. The United Kingdom manufactured 2.8 million electric commercial cars. The UK economy is distinct from that of the EU, although they are inextricably linked. The EU has awarded the United Kingdom 4.8 billion pounds for automotive sector innovation.

Aside from its global fame, it is not without its difficulties. The Russia-Ukraine war is the most significant obstacle it will confront during its growth. In the Ukraine-Russia war, the Marine Electric Vehicle Market gained less profit up to 1.2-1.8%

IMPACT OF ONGOING RECESSION

According to conventional wisdom, inflation is beneficial to commodities because it correlates with robust economic activity, which stimulates demand. Higher prices result when marginal supply costs rise and supply tries to keep up. However, the advantages may be fleeting. Higher inflation leads to higher interest rates, which dampens economic growth. Furthermore, there is a significant negative relationship between the US dollar and commodities prices. At a high level, robust US activity raises commodities prices. This causes inflation, which leads to increased US interest rates, which dampens demand.

waxed poetic about metals-intensive EVs' revolutionary need for mined commodities. Forecasts for EV penetration has just been revised to reflect the remarkable surge in sales expected in 2021. Battery electric vehicle (BEV) and plug-in hybrid (PHEV) passenger car sales are expected to quadruple over the next five years, from just under 9% of the worldwide total in 2021. Commercial BEV/PHEV sales will expand at a similar rate, growing from 6% of total sales in 2021 to 13% in 2026. In the ongoing recession, the marine electric market is gaining profit up to 4.2-4.6%.

KEY MARKET SEGMENTATION

By Vehicle Type

  • Plug-In Hybrid Electric

  • Battery Electric

  • Hybrid Electric

By Platform

  • Underwater

  • On-water

By Craft Application

  • Personal Tourist Submarine

  • Leisure Tourist Surface Boat

  • Military

  • Autonomous Underwater Vehicle

  • Work Boat

  • Others

REGIONAL ANALYSIS

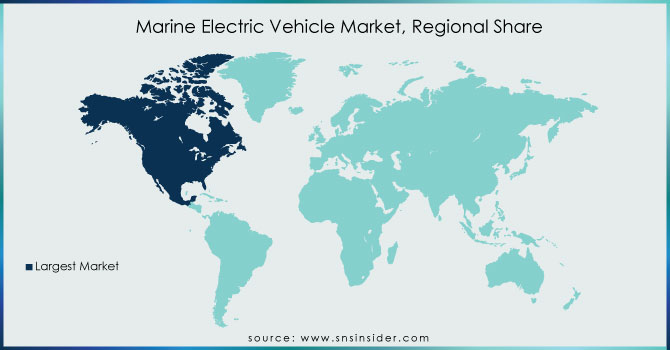
North America: The marine electric vehicle market in North America is well-established, owing to rigorous pollution rules, technical improvements, and government incentives. Adoption is highest in the United States and Canada, with an emphasis on electric ferries, leisure boats, and research vessels.

Europe: Europe had the greatest market share in 2023 and is expected to have the fastest CAGR during the forecast period. The market is expected to see favourable conditions as a result of trade activity and marine vessel electrification. This tendency is backed by an increase in defence spending as a result of rising geopolitical tensions, which force major economies to bolster their military capabilities. In addition, increased R&D expenditure by leading players and OEMs in order to develop superior electrical solutions to fulfil future sustainable and operational needs will boost the market.

Asia Pacific: For the marine electric vehicle industry, the Asia-Pacific area provides a considerable potential opportunity. Countries such as Japan, China, and South Korea are spending extensively on R&D, infrastructure development, and incentives to encourage electric propulsion in the marine industry. Electric passenger ferries, recreational boats, and small commercial vessels are becoming popular in the region.
Marine-Electric-Vehicle-Market-Regional-Share

Need any customization research on Marine Electric Vehicle Market - Enquiry Now

REGIONAL COVERAGE:

North America

  • US

  • Canada

  • Mexico

Europe

  • Eastern Europe

    • Poland

    • Romania

    • Hungary

    • Turkey

    • Rest of Eastern Europe

  • Western Europe

    • Germany

    • France

    • UK

    • Italy

    • Spain

    • Netherlands

    • Switzerland

    • Austria

    • Rest of Western Europe

Asia Pacific

  • China

  • India

  • Japan

  • South Korea

  • Vietnam

  • Singapore

  • Australia

  • Rest of Asia Pacific

Middle East & Africa

  • Middle East

    • UAE

    • Egypt

    • Saudi Arabia

    • Qatar

    • Rest of Middle East

  • Africa

    • Nigeria

    • South Africa

    • Rest of Africa

Latin America

  • Brazil

  • Argentina

  • Colombia

  • Rest of Latin America

Key Players

The Major Players are ABB Ltd., Siemens AG, Torgeedo GmbH, Echandia Marine AB, Rolls-Royce Holdings pic, BAE Systems, Wärtsilä Corporation, Saft Batteries, General Electric Company, Leclanché SA and other players

RECENT DEVELOPMENT

In 2021: To minimise traffic and pollution, the Bangkok Metropolitan Authority has committed to building 12 new zero-emission all-electric boats.

In 2021: Sumitomo Corporation and Corvus Energy formed a partnership to create zero-emission solutions for Japanese ships.

In 2021: Fassmer, a leader in the production of composite boats, collaborated with Toqee to introduce the Fassmer CIT-E Ferry, a totally electric ferry for public transportation.

Marine Electric Vehicle Market Report Scope:

Report Attributes Details
Market Size in 2023  US$ 10.0 Bn
Market Size by 2032  US$ 32.3 Bn
CAGR   CAGR of 13.9% From 2024 to 2032
Base Year 2023
Forecast Period  2024-2032
Historical Data  2020-2022
Report Scope & Coverage Market Size, Segments Analysis, Competitive  Landscape, Regional Analysis, DROC & SWOT Analysis, Forecast Outlook
Key Segments • By Vehicle Type (Plug-In Hybrid Electric, Battery Electric, Hybrid Electric)
• By Platform (Underwater and On-water)
• By Craft Application (Personal Tourist Submarine, Leisure Tourist Surface Boat, Military, Autonomous Underwater Vehicle (AUV), Work Boat, others)
Regional Analysis/Coverage North America (US, Canada, Mexico), Europe (Eastern Europe [Poland, Romania, Hungary, Turkey, Rest of Eastern Europe] Western Europe] Germany, France, UK, Italy, Spain, Netherlands, Switzerland, Austria, Rest of Western Europe]), Asia Pacific (China, India, Japan, South Korea, Vietnam, Singapore, Australia, Rest of Asia Pacific), Middle East & Africa (Middle East [UAE, Egypt, Saudi Arabia, Qatar, Rest of Middle East], Africa [Nigeria, South Africa, Rest of Africa], Latin America (Brazil, Argentina, Colombia Rest of Latin America)
Company Profiles ABB Ltd., Siemens AG, Torgeedo GmbH, Echandia Marine AB, Rolls-Royce Holdings pic, BAE Systems, Wärtsilä Corporation, Saft Batteries, General Electric Company, Leclanché SA
Key Drivers • Many countries and international organizations set emission reduction targets for the shipping industry
• Environmental Concerns and Regulations are drivers of the Marine Electric Vehicle Market.
Market Restraints • The size and weight of batteries can be a challenge for vessels with limited space available for energy storage.
• Energy Storage Limitations are the restraint of the Marine Electric Vehicle Market.


Frequently Asked Questions

Ans. The Compound Annual Growth rate for the Marine Electric Vehicle Market over the forecast period is 16.2%.

Ans. USD 29.41 Billion is the projected Marine Electric Vehicle Market size of the market by 2030.

Ans. The Marine Electric Vehicle Market is anticipated to reach USD 8.85 Billion by 2022.

Ans. Because of the existence of numerous prominent marine electric vehicle solution providers in the area, the Marine Electric Vehicle Market in Europe is expected to have the greatest market share throughout the forecast period. The region also boasts a number of significant shipyards that produce both manned and unmanned electric vessels.

Ans. High-energy batteries and research into the deployment of hydrogen fuel cells are two of the primary developing technologies and application cases challenging the industry. Manufacturers of recreational boats are already adding solar panels to power their vessels and are investigating ways to employ renewable energy sources to power low-load watercraft.

Table of Contents

1. Introduction
1.1 Market Definition
1.2 Scope
1.3 Research Assumptions

2. Research Methodology

3. Market Dynamics
3.1 Drivers
3.2 Restraints
3.3 Opportunities
3.4 Challenges

4. Impact Analysis
4.1 Impact of Russia-Ukraine War
4.2 Impact of Ongoing Recession
4.2.1 Introduction
4.2.2 Impact on major economies
4.2.2.1 US
4.2.2.2 Canada
4.2.2.3 Germany
4.2.2.4 France
4.2.2.5 United Kingdom
4.2.2.6 China
4.2.2.7 Japan
4.2.2.8 South Korea
4.2.2.9 Rest of the World

5. Value Chain Analysis

6. Porter’s 5 forces model

7. PEST Analysis

8. Marine Electric Vehicle Market, By Vehicle Type
8.1 Plug-In Hybrid Electric
8.2 Battery Electric
8.3 Hybrid Electric

9. Marine Electric Vehicle Market, By Platform
9.1 Underwater
9.2 On-water

10. Marine Electric Vehicle Market, By Craft Application
10.1 Personal Tourist Submarine
10.2 Leisure Tourist Surface Boat
10.3 Military
10.4 Autonomous Underwater Vehicle (AUV)
10.5 Work Boat
10.6 Others

11. Regional Analysis
11.1 Introduction
11.2 North America
11.2.1 North America Marine Electric Vehicle Market by Country
11.2.2 North America Marine Electric Vehicle Market by Vehicle Type
11.2.3 North America Marine Electric Vehicle Market by Platform
11.2.4 North America Marine Electric Vehicle Market by Craft Application
11.2.5 USA
11.2.5.1 USA Marine Electric Vehicle Market by Vehicle Type
11.2.5.2 USA Marine Electric Vehicle Market by Platform
11.2.5.3 USA Marine Electric Vehicle Market by Craft Application
11.2.6 Canada
11.2.6.1 Canada Marine Electric Vehicle Market by Vehicle Type
11.2.6.2 Canada Marine Electric Vehicle Market by Platform
11.2.6.3 Canada Marine Electric Vehicle Market by Craft Application
11.2.7 Mexico
11.2.7.1 Mexico Marine Electric Vehicle Market by Vehicle Type
11.2.7.2 Mexico Marine Electric Vehicle Market by Platform
11.2.7.3 Mexico Marine Electric Vehicle Market by Craft Application
11.3 Europe
11.3.1 Eastern Europe
11.3.1.1 Eastern Europe Marine Electric Vehicle Market by country
11.3.1.2 Eastern Europe Marine Electric Vehicle Market by Vehicle Type
11.3.1.3 Eastern Europe Marine Electric Vehicle Market by Platform
11.3.1.4 Eastern Europe Marine Electric Vehicle Market by Craft Application
11.3.1.5 Poland
11.3.1.5.1 Poland Marine Electric Vehicle Market by Vehicle Type
11.3.1.5.2 Poland Marine Electric Vehicle Market by Platform
11.3.1.5.3 Poland Marine Electric Vehicle Market by Craft Application
11.3.1.6 Romania
11.3.1.6.1 Romania Marine Electric Vehicle Market by Vehicle Type
11.3.1.6.2 Romania Marine Electric Vehicle Market by Platform
11.3.1.6.4 Romania Marine Electric Vehicle Market by Craft Application
11.3.1.7 Turkey
11.3.1.7.1 Turkey Marine Electric Vehicle Market by Vehicle Type
11.3.1.7.2 Turkey Marine Electric Vehicle Market by Platform
11.3.1.7.3 Turkey Marine Electric Vehicle Market by Craft Application
11.3.1.8 Rest of Eastern Europe
11.3.1.8.1 Rest of Eastern Europe Marine Electric Vehicle Market by Vehicle Type
11.3.1.8.2 Rest of Eastern Europe Marine Electric Vehicle Market by Platform
11.3.1.8.3 Rest of Eastern Europe Marine Electric Vehicle Market by Craft Application
11.3.2 Western Europe
11.3.2.1 Western Europe Marine Electric Vehicle Market by Vehicle Type
11.3.2.2 Western Europe Marine Electric Vehicle Market by Platform
11.3.2.3 Western Europe Marine Electric Vehicle Market by Craft Application
11.3.2.4 Germany
11.3.2.4.1 Germany Marine Electric Vehicle Market by Vehicle Type
11.3.2.4.2 Germany Marine Electric Vehicle Market by Platform
11.3.2.4.3 Germany Marine Electric Vehicle Market by Craft Application
11.3.2.5 France
11.3.2.5.1 France Marine Electric Vehicle Market by Vehicle Type
11.3.2.5.2 France Marine Electric Vehicle Market by Platform
11.3.2.5.3 France Marine Electric Vehicle Market by Craft Application
11.3.2.6 UK
11.3.2.6.1 UK Marine Electric Vehicle Market by Vehicle Type
11.3.2.6.2 UK Marine Electric Vehicle Market by Platform
11.3.2.6.3 UK Marine Electric Vehicle Market by Craft Application
11.3.2.7 Italy
11.3.2.7.1 Italy Marine Electric Vehicle Market by Vehicle Type
11.3.2.7.2 Italy Marine Electric Vehicle Market by Platform
11.3.2.7.3 Italy Marine Electric Vehicle Market by Craft Application
11.3.2.8 Spain
11.3.2.8.1 Spain Marine Electric Vehicle Market by Vehicle Type
11.3.2.8.2 Spain Marine Electric Vehicle Market by Platform
11.3.2.8.3 Spain Marine Electric Vehicle Market by Craft Application
11.3.2.9 Netherlands
11.3.2.9.1 Netherlands Marine Electric Vehicle Market by Vehicle Type
11.3.2.9.2 Netherlands Marine Electric Vehicle Market by Platform
11.3.2.9.3 Netherlands Marine Electric Vehicle Market by Craft Application
11.3.2.10 Switzerland
11.3.2.10.1 Switzerland Marine Electric Vehicle Market by Vehicle Type
11.3.2.10.2 Switzerland Marine Electric Vehicle Market by Platform
11.3.2.10.3 Switzerland Marine Electric Vehicle Market by Craft Application
11.3.2.11.1 Austria
11.3.2.11.2 Austria Marine Electric Vehicle Market by Vehicle Type
11.3.2.11.3 Austria Marine Electric Vehicle Market by Platform
11.3.2.11.4 Austria Marine Electric Vehicle Market by Craft Application
11.3.2.12 Rest of Western Europe
11.3.2.12.1 Rest of Western Europe Marine Electric Vehicle Market by Vehicle Type
11.3.2.12.2 Rest of Western Europe Marine Electric Vehicle Market by Platform
11.3.2.12.3 Rest of Western Europe Marine Electric Vehicle Market by Craft Application
11.4 Asia-Pacific
11.4.1 Asia-Pacific Marine Electric Vehicle Market by country
11.4.2 Asia-Pacific Marine Electric Vehicle Market by Vehicle Type
11.4.3 Asia-Pacific Marine Electric Vehicle Market by Platform
11.4.4 Asia-Pacific Marine Electric Vehicle Market by Craft Application
11.4.5 China
11.4.5.1 China Marine Electric Vehicle Market by Vehicle Type
11.4.5.2 China Marine Electric Vehicle Market by Platform
11.4.5.3 China Marine Electric Vehicle Market by Craft Application
11.4.6 India
11.4.6.1 India Marine Electric Vehicle Market by Vehicle Type
11.4.6.2 India Marine Electric Vehicle Market by Platform
11.4.6.3 India Marine Electric Vehicle Market by Craft Application
11.4.7 Japan
11.4.7.1 Japan Marine Electric Vehicle Market by Vehicle Type
11.4.7.2 Japan Marine Electric Vehicle Market by Platform
11.4.7.3 Japan Marine Electric Vehicle Market by Craft Application
11.4.8 South Korea
11.4.8.1 South Korea Marine Electric Vehicle Market by Vehicle Type
11.4.8.2 South Korea Marine Electric Vehicle Market by Platform
11.4.8.3 South Korea Marine Electric Vehicle Market by Craft Application
11.4.9 Vietnam
11.4.9.1 Vietnam Marine Electric Vehicle Market by Vehicle Type
11.4.9.2 Vietnam Marine Electric Vehicle Market by Platform
11.4.9.3 Vietnam Marine Electric Vehicle Market by Craft Application
11.4.10 Singapore
11.4.10.1 Singapore Marine Electric Vehicle Market by Vehicle Type
11.4.10.2 Singapore Marine Electric Vehicle Market by Platform
11.4.10.3 Singapore Marine Electric Vehicle Market by Craft Application
11.4.11 Australia
11.4.11.1 Australia Marine Electric Vehicle Market by Vehicle Type
11.4.11.2 Australia Marine Electric Vehicle Market by Platform
11.4.11.3 Australia Marine Electric Vehicle Market by Craft Application
11.4.12 Rest of Asia-Pacific
11.4.12.1 Rest of Asia-Pacific Marine Electric Vehicle Market by Vehicle Type
11.4.12.2 Rest of Asia-Pacific Marine Electric Vehicle Market by Platform
11.4.12.3 Rest of Asia-Pacific Marine Electric Vehicle Market by Craft Application
11.5 Middle East & Africa
11.5.1 Middle East
11.5.1.1 Middle East Marine Electric Vehicle Market by country
11.5.1.2 Middle East Marine Electric Vehicle Market by Vehicle Type
11.5.1.3 Middle East Marine Electric Vehicle Market by Platform
11.5.1.4 Middle East Marine Electric Vehicle Market by Craft Application
11.5.1.5 UAE
11.5.1.5.1 UAE Marine Electric Vehicle Market by Vehicle Type
11.5.1.5.2 UAE Marine Electric Vehicle Market by Platform
11.5.1.5.3 UAE Marine Electric Vehicle Market by Craft Application
11.5.1.6 Egypt
11.5.1.6.1 Egypt Marine Electric Vehicle Market by Vehicle Type
11.5.1.6.2 Egypt Marine Electric Vehicle Market by Platform
11.5.1.6.3 Egypt Marine Electric Vehicle Market by Craft Application
11.5.1.7 Saudi Arabia
11.5.1.7.1 Saudi Arabia Marine Electric Vehicle Market by Vehicle Type
11.5.1.7.2 Saudi Arabia Marine Electric Vehicle Market by Platform
11.5.1.7.3 Saudi Arabia Marine Electric Vehicle Market by Craft Application
11.5.1.8 Qatar
11.5.1.8.1 Qatar Marine Electric Vehicle Market by Vehicle Type
11.5.1.8.2 Qatar Marine Electric Vehicle Market by Platform
11.5.1.8.3 Qatar Marine Electric Vehicle Market by Craft Application
11.5.1.9 Rest of Middle East
11.5.1.9.1 Rest of Middle East Marine Electric Vehicle Market by Vehicle Type
11.5.1.9.2 Rest of Middle East Marine Electric Vehicle Market by Platform
11.5.1.9.3 Rest of Middle East Marine Electric Vehicle Market by Craft Application
11.5.2 Africa
11.5.2.1 Africa Marine Electric Vehicle Market by country
11.5.2.2 Africa Marine Electric Vehicle Market by Vehicle Type
11.5.2.3 Africa Marine Electric Vehicle Market by Platform
11.5.2.4 Africa Marine Electric Vehicle Market by Craft Application
11.5.2.5 Nigeria
11.5.2.5.1 Nigeria Marine Electric Vehicle Market by Vehicle Type
11.5.2.5.2 Nigeria Marine Electric Vehicle Market by Platform
11.5.2.5.3 Nigeria Marine Electric Vehicle Market by Craft Application
11.5.2.6 South Africa
11.5.2.6.1 South Africa Marine Electric Vehicle Market by Vehicle Type
11.5.2.6.2 South Africa Marine Electric Vehicle Market by Platform
11.5.2.6.3 South Africa Marine Electric Vehicle Market by Craft Application
11.5.2.7 Rest of Africa
11.5.2.7.1 Rest of Africa Marine Electric Vehicle Market by Vehicle Type
11.5.2.7.2 Rest of Africa Marine Electric Vehicle Market by Platform
11.5.2.7.3 Rest of Africa Marine Electric Vehicle Market by Craft Application
11.6 Latin America
11.6.1 Latin America Marine Electric Vehicle Market by Country
11.6.2 Latin America Marine Electric Vehicle Market by Vehicle Type
11.6.3 Latin America Marine Electric Vehicle Market by Platform
11.6.4 Latin America Marine Electric Vehicle Market by Craft Application
11.6.5 Brazil
11.6.5.1 Brazil Marine Electric Vehicle Market by Vehicle Type
11.6.5.2 Brazil Marine Electric Vehicle Market by Platform
11.6.5.3 Brazil Marine Electric Vehicle Market by Craft Application
11.6.6 Argentina
11.6.6.1 Argentina Marine Electric Vehicle Market by Vehicle Type
11.6.6.2 Argentina Marine Electric Vehicle Market by Platform
11.6.6.3 Argentina Marine Electric Vehicle Market by Craft Application
11.6.7 Colombia
11.6.7.1 Colombia Marine Electric Vehicle Market by Vehicle Type
11.6.7.2 Colombia Marine Electric Vehicle Market by Platform
11.6.7.3 Colombia Marine Electric Vehicle Market by Craft Application
11.6.8 Rest of Latin America
11.6.8.1 Rest of Latin America Marine Electric Vehicle Market by Vehicle Type
11.6.8.2 Rest of Latin America Marine Electric Vehicle Market by Platform
11.6.8.3 Rest of Latin America Marine Electric Vehicle Market by Craft Application

12 Company profile
12.1 ABB Ltd.
12.1.1 Company Overview
12.1.2 Financials
12.1.3 Product/Services Offered
12.1.4 SWOT Analysis
12.1.5 The SNS View
12.2 Siemens AG
12.2.1 Company Overview
12.2.2 Financials
12.2.3 Product/Services Offered
12.2.4 SWOT Analysis
12.2.5 The SNS View
12.3 Torgeedo GmbH
12.3.1 Company Overview
12.3.2 Financials
12.3.3 Product/Services Offered
12.3.4 SWOT Analysis
12.3.5 The SNS View
12.4 Echandia Marine AB
12.4.1 Company Overview
12.4.2 Financials
12.4.3 Product/Services Offered
12.4.4 SWOT Analysis
12.4.5 The SNS View
12.5 Rolls-Royce Holdings pic
12.5.1 Company Overview
12.5.2 Financials
12.5.3 Product/Services Offered
12.5.4 SWOT Analysis
12.5.5 The SNS View
12.6 BAE Systems
12.6.1 Company Overview
12.6.2 Financials
12.6.3 Product/Services Offered
12.6.4 SWOT Analysis
12.6.5 The SNS View
12.7 Wärtsilä Corporation
12.7.1 Company Overview
12.7.2 Financials
12.7.3 Product/Services Offered
12.7.4 SWOT Analysis
12.7.5 The SNS View
12.8 Saft Batteries
12.8.1 Company Overview
12.8.2 Financials
12.8.3 Product/Services Offered
12.8.4 SWOT Analysis
12.8.5 The SNS View
12.9 General Electric Company
12.9.1 Company Overview
12.9.2 Financials
12.9.3 Product/Services Offered
12.9.4 SWOT Analysis
12.9.5 The SNS View
12.10 Leclanché SA
12.10.1 Company Overview
12.10.2 Financials
12.10.3 Product/Services Offered
12.10.4 SWOT Analysis
12.10.5 The SNS View

13. Competitive Landscape
13.1 Competitive Benchmarking
13.2 Market Share Analysis
13.3 Recent Developments
13.3.1 Industry News
13.3.2 Company News
13.3.3 Mergers & Acquisitions

14. Use Case and Best Practices

15. Conclusion

An accurate research report requires proper strategizing as well as implementation. There are multiple factors involved in the completion of good and accurate research report and selecting the best methodology to compete the research is the toughest part. Since the research reports we provide play a crucial role in any company’s decision-making process, therefore we at SNS Insider always believe that we should choose the best method which gives us results closer to reality. This allows us to reach at a stage wherein we can provide our clients best and accurate investment to output ratio.

Each report that we prepare takes a timeframe of 350-400 business hours for production. Starting from the selection of titles through a couple of in-depth brain storming session to the final QC process before uploading our titles on our website we dedicate around 350 working hours. The titles are selected based on their current market cap and the foreseen CAGR and growth.


The 5 steps process:

Step 1: Secondary Research:

Secondary Research or Desk Research is as the name suggests is a research process wherein, we collect data through the readily available information. In this process we use various paid and unpaid databases which our team has access to and gather data through the same. This includes examining of listed companies’ annual reports, Journals, SEC filling etc. Apart from this our team has access to various associations across the globe across different industries. Lastly, we have exchange relationships with various university as well as individual libraries.

Secondary Research

Step 2: Primary Research

When we talk about primary research, it is a type of study in which the researchers collect relevant data samples directly, rather than relying on previously collected data.  This type of research is focused on gaining content specific facts that can be sued to solve specific problems. Since the collected data is fresh and first hand therefore it makes the study more accurate and genuine.

We at SNS Insider have divided Primary Research into 2 parts.

Part 1 wherein we interview the KOLs of major players as well as the upcoming ones across various geographic regions. This allows us to have their view over the market scenario and acts as an important tool to come closer to the accurate market numbers. As many as 45 paid and unpaid primary interviews are taken from both the demand and supply side of the industry to make sure we land at an accurate judgement and analysis of the market.

This step involves the triangulation of data wherein our team analyses the interview transcripts, online survey responses and observation of on filed participants. The below mentioned chart should give a better understanding of the part 1 of the primary interview.

Primary Research

Part 2: In this part of primary research the data collected via secondary research and the part 1 of the primary research is validated with the interviews from individual consultants and subject matter experts.

Consultants are those set of people who have at least 12 years of experience and expertise within the industry whereas Subject Matter Experts are those with at least 15 years of experience behind their back within the same space. The data with the help of two main processes i.e., FGDs (Focused Group Discussions) and IDs (Individual Discussions). This gives us a 3rd party nonbiased primary view of the market scenario making it a more dependable one while collation of the data pointers.

Step 3: Data Bank Validation

Once all the information is collected via primary and secondary sources, we run that information for data validation. At our intelligence centre our research heads track a lot of information related to the market which includes the quarterly reports, the daily stock prices, and other relevant information. Our data bank server gets updated every fortnight and that is how the information which we collected using our primary and secondary information is revalidated in real time.

Data Bank Validation

Step 4: QA/QC Process

After all the data collection and validation our team does a final level of quality check and quality assurance to get rid of any unwanted or undesired mistakes. This might include but not limited to getting rid of the any typos, duplication of numbers or missing of any important information. The people involved in this process include technical content writers, research heads and graphics people. Once this process is completed the title gets uploader on our platform for our clients to read it.

Step 5: Final QC/QA Process:

This is the last process and comes when the client has ordered the study. In this process a final QA/QC is done before the study is emailed to the client. Since we believe in giving our clients a good experience of our research studies, therefore, to make sure that we do not lack at our end in any way humanly possible we do a final round of quality check and then dispatch the study to the client.


  •            5000 (33% Discount)


  •            8950 (40% Discount)


  •            3050 (23% Discount)

Start a Conversation

Hi! Click one of our member below to chat on Phone