image

Malonic Acid Market Report Scope & Overview:

Malonic Acid Market Revenue Analysis

Get E-PDF Sample Report on Malonic Acid Market - Request Sample Report

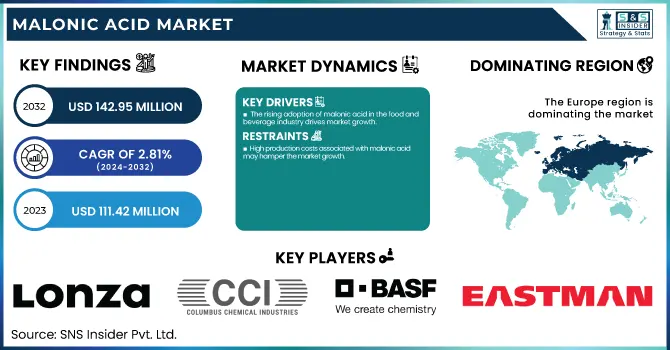
The Malonic Acid Market size was valued at USD 111.42 Million in 2023 and is expected to reach USD 142.95 Million by 2032, growing at a CAGR of 2.81% over the forecast period of 2024-2032. This report gives a comprehensive overview of the recent pricing patterns, supply chain challenges, and investments by the key players in the malonic acid market. Depending on the use case, it provides insight into production capacity and utilization rates by country, as well as feedstock pricing and the regulatory landscape by country. It provides insights into the current market size and future projections, analyzing production and consumption patterns across various sectors.

Drivers

  • The rising adoption of malonic acid in the food and beverage industry drives market growth.

Increasing usage of malonic acid in the food & beverages industry as acidulants, preservatives, and pH regulators is a key growth factor for the market. Malonic acid and its derivatives have broad food applications with application functions in flavor stability, shelf-life extension, and product consistency. Such an overarching shift towards more natural and clean-label ingredients has driven additional demand as malonic acid being bio-based (natural) can prove to be a more suitable substitute over synthetic additives. Moreover, the expanding food processing sector, especially behind several end-use application industries such as bakery, dairy, and beverages in the developing regions across Asia-Pacific and Latin America, has driven the demand for efficient acidity regulators in the finished products and is expected to achieve hydrophilic balance during the forecast period.

Various regulatory bodies, including the US FDA and the EFSA, have prepared guidelines for the safe limits of organic acids, providing guidelines for compliance with the safe use of organic acids in food. The growing demand for malonic acid due to the change of trend in manufacturers to ensure higher standards of food safety regulations and learning functional food icing ingredients has led to the great ball rolling of new systems consumed in the malonic acid market. In addition, improved bio-based production techniques with increased sustainability and reduced production costs are attracting malonic acid as a food and beverage additive. Over the forecast period, this trend is expected to strengthen further and gain traction boosting the market growth.

Restraint

  • High production costs associated with malonic acid may hamper the market growth.

The high cost associated with the manufacturing of malonic acid is a major restraint and challenge in terms of market growth, which can mainly be attributed to the complicated manufacturing process and its expensive raw materials. In traditional chemical synthesis, malonic acid is constructed from chloroacetic acid through a series of cyanation and hydrolysis steps, which demand rigorous handling protocols and high energy consumption. This dependency on petrochemical feedstocks increases production costs, now the entire process is not cost-effective relative to other organic acids. Moreover, increases in feedstock prices and supply chain disruptions may have a bearing on the production costs and margins of manufacturers.

Opportunities

  • The growing trend of using bio-based chemicals in various industries creates an opportunity for the market.

An increase in the usage of bio-based chemicals in various end-use industries is an opportunity for the malonic acid market, as the trend continues for the manufacturers to seek for greener alternatives to petrochemical-based chemicals. Malonic acid, one of the major platform chemicals, has been historically produced from fossil resources but is now a good candidate for sustainable chemical applications to biotechnological fermentative production methods from a variety of renewable feedstocks, such as sugar and biomass. Pharmaceuticals, food & beverages, personal care, and specialty chemicals industries are increasingly integrating bio-based ingredients to conform with the global sustainability agenda. Malonic acid is an important building block in the production of green solvents, biodegradable coatings, and bio-based polymers, which are expected to witness a surge in demand. Moreover, with rising investments in bio-manufacturing facilities and advanced biorefinery technologies, costs are expected to be diminished in the time to come, making bio-based malonic acid even more of an attractive option. The movement towards bio-based chemicals is likely to include new sources of growth for the malonic acid market in the forecast period as companies try to meet their carbon-neutral and circular economy targets.

Challenges

  • The availability of alternative products in the market may challenge the market.

Alternative products available in market act as a major threat to the malonic acid market as there are many organic acids performing similar functions with lower price range. Citric acid, succinic acid, and tartaric acid are the most commonly used compounds for different applications in food & beverages, pharmaceuticals and specialty chemicals industries as acidulants, pH regulators and intermediates in chemical synthesis. Such substitutes are generally cheaper and more abundant, which make them more desirable by manufacturers who want to minimize production costs.

Market segmentation

By Application

Flavor enhancers held the largest market share of about 32% in 2023. It is widely used in the food and beverage industry. Malonic acid also and its derivatives have been used extensively as a pH regulator, acidity enhancer, and buffering agent, especially because it can stabilize and improve the taste of processed foods, confectionery, and beverages. The adoption of malonic acid is further driven due to increasing consumer preference for clean-label and natural flavoring agents as it fits industry trends for bio-based and non-synthetic additives.

By End-Use Industry

Food & Beverage held the largest market share around 34% in 2023. This is owing to malonic acid being a key component for maintaining the quality, flavor, and preservation of products. Malonic acid is an effective acidulant that is used in a wide range of food and beverages, including carbonated beverages, fruit juices, bakery goods, dairy products, and desserts and confections. This regulation is critical for pH, flavor stability, and shelf life of processed foods to ensure consumers have needs for associated freshness and consistency. Due to the shift of consumers towards clean-label products, malonic acid, owing to its natural properties, has also garnered popularity as an alternative to synthetic additives, in concordance with increasing demand for more natural and healthier food products.

Regional Analysis

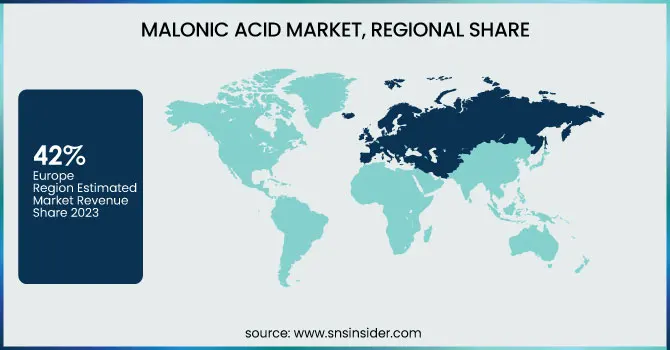
Europe held the largest market share around 42% in 2023. The growth can largely be attributed to the rise in consumption of malic acid across end-use segments. Sectors like food & beverages, pharmaceuticals, and cosmetics have realized the multidimensional advantages of malic acid, and this has given rise to its increasing deployment. They are of interest to the pharmaceutical industry for their potential pharmacological properties. It has been discovered to help in the making of drugs, especially for diseases like kidney stones and fibromyalgia. The demand for malic acid in the pharmaceutical sector has witnessed a surge due to the escalating incidence of such diseases and rising knowledge regarding the merits of malic acid. Even the cosmetic industry has identified the importance of malic acid in skin and hair products. With remarkable exfoliating and skin-nurturing properties and the potential to contribute to improved hair, it has earned its place in some beauty formulations. A constant increase in sales of malic acid is anticipated shortly, as the European cosmetic business grows larger. With a whopping number of $4.65 billion, Germany is at the top of the national cosmetics and personal care market in Europe.

North America is the fastest growing region in the market. Malonic acid is used as a chemical intermediate in multiple chemicals including acetic acid, and North America has a strong industrial base that utilizes these chemicals. A large, prepared infrastructure, technological know-how, and ambiance favorable to doing business have created markets ready for growth in the region. Moreover, the rising awareness and progressive adoption of sustainable practices also play a role in the expansion of the market within North America. Malonic Acid is an eco-friendly product which perfectly fits with the sustainability vision of the region.


Malonic Acid Market By Region

Get Customized Report as Per Your Business Requirement - Request For Customized Report


Key Players

  • Shanghai Nanxiang Reagent Co. Ltd. (Malonic Acid, Sodium Malonate)

  • Lonza Group (Malonic Acid, Biocatalysts)

  • Wuhan Kemi-Works Chemical Co. Ltd. (Malonic Acid, Potassium Malonate)

  • Columbus Chemical Industries Inc. (Malonic Acid, Sodium Malonate)

  • Trace Zero LLC (Malonic Acid, Green Chemicals)

  • J&K Scientific Ltd. (Malonic Acid, Reagents)

  • Medical Chem (Yancheng) Manufacturing Co. Ltd. (Malonic Acid, Dimethyl Malonate)

  • Hefei TNJ Chemical Industry Co. Ltd. (Malonic Acid, Dimethyl Malonate)

  • Lygos Inc. Co. Ltd. (Malonic Acid, Bio-based Chemicals)

  • Tateyama Kasei Co. Ltd. (Malonic Acid, Acidulants)

  • Wuhan Fortuna Chemical Co. Ltd. (Malonic Acid, Malonates)

  • Sigma-Aldrich Co. (Malonic Acid, Malonic Ester)

  • Kraton Polymers (Malonic Acid, Polymers)

  • Suzhou Taiyue Chemical Co. Ltd. (Malonic Acid, Biochemical Products)

  • Hunan Huaxia Shenzhou New Material Co. Ltd. (Malonic Acid, Malonate Esters)

  • Hubei Jusheng Technology Co. Ltd. (Malonic Acid, Solvents)

  • Eastman Chemical Company (Malonic Acid, Chemical Intermediates)

  • BASF SE (Malonic Acid, Specialty Chemicals)

  • Shandong Xindongfang Chemical Co. Ltd. (Malonic Acid, Organic Acids)

  • Zhejiang Yangfan New Materials Co. Ltd. (Malonic Acid, Chemical Products)

Recent Development:

  • In 2023, Lonza Group announced the expansion of its biotechnology-based production capabilities for bio-based chemicals, including malonic acid derivatives, to meet the growing demand for sustainable ingredients in industries such as food, pharmaceuticals, and specialty chemicals.

  • In 2023, Wuhan Kemi-Works Chemical Co. launched a new line of high-purity malonic acid with improved bio-based synthesis methods, aligning with global demand for greener and cost-effective production

Malonic Acid Market Report Scope:

Report Attributes Details
Market Size in 2023 USD 111.42 Million
Market Size by 2032 USD 142.95 Million
CAGR CAGR of2.81% From 2024 to 2032
Base Year 2023
Forecast Period 2024-2032
Historical Data 2020-2022
Report Scope & Coverage Market Size, Segments Analysis, Competitive  Landscape, Regional Analysis, DROC & SWOT Analysis, Forecast Outlook
Key Segments • By Application (API, Flavor Enhancer, pH Controller, Additive, Precursor, and Other)
• By End-use (Pharmaceuticals, Food & Beverage, Agriculture, Paints & Coatings, Plastics, and Others)
Regional Analysis/Coverage North America (US, Canada, Mexico), Europe (Eastern Europe [Poland, Romania, Hungary, Turkey, Rest of Eastern Europe] Western Europe] Germany, France, UK, Italy, Spain, Netherlands, Switzerland, Austria, Rest of Western Europe]), Asia Pacific (China, India, Japan, South Korea, Vietnam, Singapore, Australia, Rest of Asia Pacific), Middle East & Africa (Middle East [UAE, Egypt, Saudi Arabia, Qatar, Rest of Middle East], Africa [Nigeria, South Africa, Rest of Africa], Latin America (Brazil, Argentina, Colombia, Rest of Latin America)
Company Profiles Shanghai Nanxiang Reagent Co. Ltd., Lonza Group, Wuhan Kemi-Works Chemical Co. Ltd., Columbus Chemical Industries Inc., Trace Zero LLC, J&K Scientific Ltd., Medical Chem (Yancheng) Manufacturing Co. Ltd., Hefei TNJ Chemical Industry Co. Ltd., Lygos Inc. Co. Ltd., Tateyama Kasei Co. Ltd., Wuhan Fortuna Chemical Co. Ltd., Sigma-Aldrich Co., Kraton Polymers, Suzhou Taiyue Chemical Co. Ltd., Hunan Huaxia Shenzhou New Material Co. Ltd., Hubei Jusheng Technology Co. Ltd., Eastman Chemical Company, BASF SE, Shandong Xindongfang Chemical Co. Ltd., Zhejiang Yangfan New Materials Co. Ltd.

Frequently Asked Questions

Ans: The Malonic Acid Market was valued at USD 111.42 Million in 2023.

Ans: The expected CAGR of the global Malonic Acid Market during the forecast period 2.81%.

Ans: The flavour enhancer will grow rapidly in the Malonic Acid Market from 2024-2032.

Ans:   The rising adoption of malonic acid in the food and beverage industry drives market growth.

Ans: The Europe led the Malonic Acid Market in the region with the highest revenue share in 2023.

Table of Content

1. Introduction

1.1 Market Definition

1.2 Scope (Inclusion and Exclusions)

1.3 Research Assumptions

2. Executive Summary

2.1 Market Overview

2.2 Regional Synopsis

2.3 Competitive Summary

3. Research Methodology

3.1 Top-Down Approach

3.2 Bottom-up Approach

3.3. Data Validation

3.4 Primary Interviews

4. Market Dynamics Impact Analysis

4.1 Market Driving Factors Analysis

4.1.2 Drivers

4.1.2 Restraints

4.1.3 Opportunities

4.1.4 Challenges

4.2 PESTLE Analysis

4.3 Porter’s Five Forces Model

5. Statistical Insights and Trends Reporting

5.1 Production Capacity and Utilization, by Country, By Application, 2023

5.2 Feedstock Prices, by Country, By Application, 2023

5.3   Regulatory Impact, by Country, By Application 2023.

5.4 Environmental Metrics: Emissions Data, Waste Management Practices, and     Sustainability Initiatives, by Region

5.5 Innovation and R&D, Type, 2023

6. Competitive Landscape

6.1 List of Major Companies, By Region

6.2 Market Share Analysis, By Region

6.3 Product Benchmarking

6.3.1 Product specifications and features

6.3.2 Pricing

6.4 Strategic Initiatives

6.4.1 Marketing and promotional activities

6.4.2 Distribution and Supply Chain Strategies

6.4.3 Expansion Plans and New Product Launches

6.4.4 Strategic partnerships and collaborations

6.5 Technological Advancements

6.6 Market Positioning and Branding

7. Malonic Acid Market Segmentation, By Application

7.1 Chapter Overview

7.2 Flavor Enhancer

        7.2.1 Flavor Enhancer Trends Analysis (2020-2032)

7.2.2 Flavor Enhancer Market Size Estimates and Forecasts to 2032 (USD Million)

7.3 API

       7.3.1 API Market Trends Analysis (2020-2032)

       7.3.2 API Market Size Estimates and Forecasts to 2032 (USD Million)

7.4 Additive

        7.4.1 Additive Trends Analysis (2020-2032)

7.4.2 Additive Market Size Estimates and Forecasts to 2032 (USD Million)

7.5 pH Controller

       7.5.1 pH Controller Market Trends Analysis (2020-2032)

       7.5.2 pH Controller Market Size Estimates and Forecasts to 2032 (USD Million)

7.6 Precursor

        7.6.1 Precursor Trends Analysis (2020-2032)

7.6.2 Precursor Market Size Estimates and Forecasts to 2032 (USD Million)

7.7 Others

       7.7.1 Others Market Trends Analysis (2020-2032)

       7.7.2 Others Market Size Estimates and Forecasts to 2032 (USD Million)

8. Malonic Acid Market Segmentation, by End-Use Industry

8.1 Chapter Overview

8.2 Food & Beverage

        8.2.1 Food & Beverage Market Trends Analysis (2020-2032)

8.2.2 Food & Beverage Market Size Estimates and Forecasts to 2032 (USD Million)

8.2.3. Confectionery

                   8.2.3.1 Confectionery Market Trends Analysis (2020-2032)

           8.2.3.2 Confectionery Market Size Estimates and Forecasts to 2032 (USD Million)

8.2.4. Beverages

                   8.2.4.1 Beverages Market Trends Analysis (2020-2032)

           8.2.4.2 Beverages Market Size Estimates and Forecasts to 2032 (USD Million)

8.2.5. Fruit Preparations & Preserves

                   8.2.5.1 Fruit Preparations & Preserves Market Trends Analysis (2020-2032)

           8.2.5.2 Fruit Preparations & Preserves Market Size Estimates and Forecasts to 2032 (USD Million)

8.2.6. Baked Items

                   8.2.6.1 Baked Items Market Trends Analysis (2020-2032)

           8.2.6.2 Baked Items Market Size Estimates and Forecasts to 2032 (USD Million)

8.2.7. Others

                   8.2.7.1 Others Market Trends Analysis (2020-2032)

           8.2.7.2 Others Market Size Estimates and Forecasts to 2032 (USD Million)

8.3 Pharmaceutical

      8.3.1 Pharmaceutical Market Trends Analysis (2020-2032)

      8.3.2 Pharmaceutical Market Size Estimates and Forecasts to 2032 (USD Million)

8.4 Agriculture

        8.4.1 Agriculture Market Trends Analysis (2020-2032)

8.4.2 Agriculture Market Size Estimates and Forecasts to 2032 (USD Million)

8.5 Plastics

        8.5.1 Plastics Market Trends Analysis (2020-2032)

8.5.2 Plastics Market Size Estimates and Forecasts to 2032 (USD Million)

8.6 Paints & Coatings

        8.6.1 Paints & Coatings Market Trends Analysis (2020-2032)

8.6.2 Paints & Coatings Market Size Estimates and Forecasts to 2032 (USD Million)

8.7 Others

        8.7.1 Others Market Trends Analysis (2020-2032)

8.7.2 Others Market Size Estimates and Forecasts to 2032 (USD Million)

9. Regional Analysis

9.1 Chapter Overview

9.2 North America

9.2.1 Trends Analysis

9.2.2 North America Malonic Acid Market Estimates and Forecasts, by Country (2020-2032) (USD Million)

9.2.3 North America Malonic Acid Market Estimates and Forecasts, By Application (2020-2032) (USD Million)  

9.2.4 North America Malonic Acid Market Estimates and Forecasts, by End-Use Industry (2020-2032) (USD Million)

9.2.5 USA

9.2.5.1 USA Malonic Acid Market Estimates and Forecasts, By Application (2020-2032) (USD Million)

9.2.5.2 USA Malonic Acid Market Estimates and Forecasts, by End-Use Industry (2020-2032) (USD Million)

9.2.6 Canada

9.2.6.1 Canada Malonic Acid Market Estimates and Forecasts, By Application (2020-2032) (USD Million)

9.2.6.2 Canada Malonic Acid Market Estimates and Forecasts, by End-Use Industry (2020-2032) (USD Million)

9.2.7 Mexico

9.2.7.1 Mexico Malonic Acid Market Estimates and Forecasts, By Application (2020-2032) (USD Million)

9.2.7.2 Mexico Malonic Acid Market Estimates and Forecasts, by End-Use Industry (2020-2032) (USD Million)

9.3 Europe

9.3.1 Eastern Europe

9.3.1.1 Trends Analysis

9.3.1.2 Eastern Europe Malonic Acid Market Estimates and Forecasts, by Country (2020-2032) (USD Million)

9.3.1.3 Eastern Europe Malonic Acid Market Estimates and Forecasts, By Application (2020-2032) (USD Million)  

9.3.1.4 Eastern Europe Malonic Acid Market Estimates and Forecasts, by End-Use Industry (2020-2032) (USD Million)

9.3.1.5 Poland

9.3.1.5.1 Poland Malonic Acid Market Estimates and Forecasts, By Application (2020-2032) (USD Million)

9.3.1.5.2 Poland Malonic Acid Market Estimates and Forecasts, by End-Use Industry (2020-2032) (USD Million)

9.3.1.6 Romania

9.3.1.6.1 Romania Malonic Acid Market Estimates and Forecasts, By Application (2020-2032) (USD Million)

9.3.1.6.2 Romania Malonic Acid Market Estimates and Forecasts, by End-Use Industry (2020-2032) (USD Million)

9.3.1.7 Hungary

9.3.1.7.1 Hungary Malonic Acid Market Estimates and Forecasts, By Application (2020-2032) (USD Million)

9.3.1.7.2 Hungary Malonic Acid Market Estimates and Forecasts, by End-Use Industry (2020-2032) (USD Million)

9.3.1.8 Turkey

9.3.1.8.1 Turkey Malonic Acid Market Estimates and Forecasts, By Application (2020-2032) (USD Million)

9.3.1.8.2 Turkey Malonic Acid Market Estimates and Forecasts, by End-Use Industry (2020-2032) (USD Million)

9.3.1.9 Rest of Eastern Europe

9.3.1.9.1 Rest of Eastern Europe Malonic Acid Market Estimates and Forecasts, By Application (2020-2032) (USD Million)

9.3.1.9.2 Rest of Eastern Europe Malonic Acid Market Estimates and Forecasts, by End-Use Industry (2020-2032) (USD Million)

9.3.2 Western Europe

9.3.2.1 Trends Analysis

9.3.2.2 Western Europe Malonic Acid Market Estimates and Forecasts, by Country (2020-2032) (USD Million)

9.3.2.3 Western Europe Malonic Acid Market Estimates and Forecasts, By Application (2020-2032) (USD Million)  

9.3.2.4 Western Europe Malonic Acid Market Estimates and Forecasts, by End-Use Industry (2020-2032) (USD Million)

9.3.2.5 Germany

9.3.2.5.1 Germany Malonic Acid Market Estimates and Forecasts, By Application (2020-2032) (USD Million)

9.3.2.5.2 Germany Malonic Acid Market Estimates and Forecasts, by End-Use Industry (2020-2032) (USD Million)

9.3.2.6 France

9.3.2.6.1 France Malonic Acid Market Estimates and Forecasts, By Application (2020-2032) (USD Million)

9.3.2.6.2 France Malonic Acid Market Estimates and Forecasts, by End-Use Industry (2020-2032) (USD Million)

9.3.2.7 UK

9.3.2.7.1 UK Malonic Acid Market Estimates and Forecasts, By Application (2020-2032) (USD Million)

9.3.2.7.2 UK Malonic Acid Market Estimates and Forecasts, by End-Use Industry (2020-2032) (USD Million)

9.3.2.8 Italy

9.3.2.8.1 Italy Malonic Acid Market Estimates and Forecasts, By Application (2020-2032) (USD Million)

9.3.2.8.2 Italy Malonic Acid Market Estimates and Forecasts, by End-Use Industry (2020-2032) (USD Million)

9.3.2.9 Spain

9.3.2.9.1 Spain Malonic Acid Market Estimates and Forecasts, By Application (2020-2032) (USD Million)

9.3.2.9.2 Spain Malonic Acid Market Estimates and Forecasts, by End-Use Industry (2020-2032) (USD Million)

9.3.2.10 Netherlands

9.3.2.10.1 Netherlands Malonic Acid Market Estimates and Forecasts, By Application (2020-2032) (USD Million)

9.3.2.10.2 Netherlands Malonic Acid Market Estimates and Forecasts, by End-Use Industry (2020-2032) (USD Million)

9.3.2.11 Switzerland

9.3.2.11.1 Switzerland Malonic Acid Market Estimates and Forecasts, By Application (2020-2032) (USD Million)

9.3.2.11.2 Switzerland Malonic Acid Market Estimates and Forecasts, by End-Use Industry (2020-2032) (USD Million)

9.3.2.12 Austria

9.3.2.12.1 Austria Malonic Acid Market Estimates and Forecasts, By Application (2020-2032) (USD Million)

9.3.2.12.2 Austria Malonic Acid Market Estimates and Forecasts, by End-Use Industry (2020-2032) (USD Million)

9.3.2.13 Rest of Western Europe

9.3.2.13.1 Rest of Western Europe Malonic Acid Market Estimates and Forecasts, By Application (2020-2032) (USD Million)

9.3.2.13.2 Rest of Western Europe Malonic Acid Market Estimates and Forecasts, by End-Use Industry (2020-2032) (USD Million)

9.4 Asia Pacific

9.4.1 Trends Analysis

9.4.2 Asia Pacific Malonic Acid Market Estimates and Forecasts, by Country (2020-2032) (USD Million)

9.4.3 Asia Pacific Malonic Acid Market Estimates and Forecasts, By Application (2020-2032) (USD Million)  

9.4.4 Asia Pacific Malonic Acid Market Estimates and Forecasts, by End-Use Industry (2020-2032) (USD Million)

9.4.5 China

9.4.5.1 China Malonic Acid Market Estimates and Forecasts, By Application (2020-2032) (USD Million)

9.4.5.2 China Malonic Acid Market Estimates and Forecasts, by End-Use Industry (2020-2032) (USD Million)

9.4.6 India

9.4.5.1 India Malonic Acid Market Estimates and Forecasts, By Application (2020-2032) (USD Million)

9.4.5.2 India Malonic Acid Market Estimates and Forecasts, by End-Use Industry (2020-2032) (USD Million)

9.4.5 Japan

9.4.5.1 Japan Malonic Acid Market Estimates and Forecasts, By Application (2020-2032) (USD Million)

9.4.5.2 Japan Malonic Acid Market Estimates and Forecasts, by End-Use Industry (2020-2032) (USD Million)

9.4.6 South Korea

9.4.6.1 South Korea Malonic Acid Market Estimates and Forecasts, By Application (2020-2032) (USD Million)

9.4.6.2 South Korea Malonic Acid Market Estimates and Forecasts, by End-Use Industry (2020-2032) (USD Million)

9.4.7 Vietnam

9.4.7.1 Vietnam Malonic Acid Market Estimates and Forecasts, By Application (2020-2032) (USD Million)

9.2.7.2 Vietnam Malonic Acid Market Estimates and Forecasts, by End-Use Industry (2020-2032) (USD Million)

9.4.8 Singapore

9.4.8.1 Singapore Malonic Acid Market Estimates and Forecasts, By Application (2020-2032) (USD Million)

9.4.8.2 Singapore Malonic Acid Market Estimates and Forecasts, by End-Use Industry (2020-2032) (USD Million)

9.4.9 Australia

9.4.9.1 Australia Malonic Acid Market Estimates and Forecasts, By Application (2020-2032) (USD Million)

9.4.9.2 Australia Malonic Acid Market Estimates and Forecasts, by End-Use Industry (2020-2032) (USD Million)

9.4.10 Rest of Asia Pacific

9.4.10.1 Rest of Asia Pacific Malonic Acid Market Estimates and Forecasts, By Application (2020-2032) (USD Million)

9.4.10.2 Rest of Asia Pacific Malonic Acid Market Estimates and Forecasts, by End-Use Industry (2020-2032) (USD Million)

9.5 Middle East and Africa

9.5.1 Middle East

9.5.1.1 Trends Analysis

9.5.1.2 Middle East Malonic Acid Market Estimates and Forecasts, by Country (2020-2032) (USD Million)

9.5.1.3 Middle East Malonic Acid Market Estimates and Forecasts, By Application (2020-2032) (USD Million)  

9.5.1.4 Middle East Malonic Acid Market Estimates and Forecasts, by End-Use Industry (2020-2032) (USD Million)

9.5.1.5 UAE

9.5.1.5.1 UAE Malonic Acid Market Estimates and Forecasts, By Application (2020-2032) (USD Million)

9.5.1.5.2 UAE Malonic Acid Market Estimates and Forecasts, by End-Use Industry (2020-2032) (USD Million)

9.5.1.6 Egypt

9.5.1.6.1 Egypt Malonic Acid Market Estimates and Forecasts, By Application (2020-2032) (USD Million)

9.5.1.6.2 Egypt Malonic Acid Market Estimates and Forecasts, by End-Use Industry (2020-2032) (USD Million)

9.5.1.7 Saudi Arabia

9.5.1.7.1 Saudi Arabia Malonic Acid Market Estimates and Forecasts, By Application (2020-2032) (USD Million)

9.5.1.7.2 Saudi Arabia Malonic Acid Market Estimates and Forecasts, by End-Use Industry (2020-2032) (USD Million)

9.5.1.8 Qatar

9.5.1.8.1 Qatar Malonic Acid Market Estimates and Forecasts, By Application (2020-2032) (USD Million)

9.5.1.8.2 Qatar Malonic Acid Market Estimates and Forecasts, by End-Use Industry (2020-2032) (USD Million)

9.5.1.9 Rest of Middle East

9.5.1.9.1 Rest of Middle East Malonic Acid Market Estimates and Forecasts, By Application (2020-2032) (USD Million)

9.5.1.9.2 Rest of Middle East Malonic Acid Market Estimates and Forecasts, by End-Use Industry (2020-2032) (USD Million)

9.5.2 Africa

9.5.2.1 Trends Analysis

9.5.2.2 Africa Malonic Acid Market Estimates and Forecasts, by Country (2020-2032) (USD Million)

9.5.2.3 Africa Malonic Acid Market Estimates and Forecasts, By Application (2020-2032) (USD Million)  

9.5.2.4 Africa Malonic Acid Market Estimates and Forecasts, by End-Use Industry (2020-2032) (USD Million)

9.5.2.5 South Africa

9.5.2.5.1 South Africa Malonic Acid Market Estimates and Forecasts, By Application (2020-2032) (USD Million)

9.5.2.5.2 South Africa Malonic Acid Market Estimates and Forecasts, by End-Use Industry (2020-2032) (USD Million)

9.5.2.6 Nigeria

9.5.2.6.1 Nigeria Malonic Acid Market Estimates and Forecasts, By Application (2020-2032) (USD Million)

9.5.2.6.2 Nigeria Malonic Acid Market Estimates and Forecasts, by End-Use Industry (2020-2032) (USD Million)

9.6 Latin America

9.6.1 Trends Analysis

9.6.2 Latin America Malonic Acid Market Estimates and Forecasts, by Country (2020-2032) (USD Million)

9.6.3 Latin America Malonic Acid Market Estimates and Forecasts, By Application (2020-2032) (USD Million)  

9.6.4 Latin America Malonic Acid Market Estimates and Forecasts, by End-Use Industry (2020-2032) (USD Million)

9.6.5 Brazil

9.6.5.1 Brazil Malonic Acid Market Estimates and Forecasts, By Application (2020-2032) (USD Million)

9.6.5.2 Brazil Malonic Acid Market Estimates and Forecasts, by End-Use Industry (2020-2032) (USD Million)

9.6.6 Argentina

9.6.6.1 Argentina Malonic Acid Market Estimates and Forecasts, By Application (2020-2032) (USD Million)

9.6.6.2 Argentina Malonic Acid Market Estimates and Forecasts, by End-Use Industry (2020-2032) (USD Million)

9.6.7 Colombia

9.6.7.1 Colombia Malonic Acid Market Estimates and Forecasts, By Application (2020-2032) (USD Million)

9.6.7.2 Colombia Malonic Acid Market Estimates and Forecasts, by End-Use Industry (2020-2032) (USD Million)

9.6.8 Rest of Latin America

9.6.8.1 Rest of Latin America Malonic Acid Market Estimates and Forecasts, By Application (2020-2032) (USD Million)

9.6.8.2 Rest of Latin America Malonic Acid Market Estimates and Forecasts, by End-Use Industry (2020-2032) (USD Million)

10. Company Profiles

           10.1     Shanghai Nanxiang Reagent Co. Ltd.

                          10.1.1 Company Overview

10.1.2 Financial

10.1.3 Product / Services Offered

10.1.4 SWOT Analysis

           10.2      Lonza Group

                           10.2.1 Company Overview

10.2.2 Financial

10.2.3 Product/ Services Offered

10.2.4 SWOT Analysis

10.3 Wuhan Kemi-Works Chemical Co. Ltd.

              10.3.1 Company Overview

10.3.2 Financial

10.3.3 Product/ Services Offered

10.3.4 SWOT Analysis

10.4 Columbus Chemical Industries Inc.

             10.4.1 Company Overview

10.4.2 Financial

10.4.3 Product/ Services Offered

10.4.4 SWOT Analysis

10.5 Trace Zero LLC

             10.5.1 Company Overview

10.5.2 Financial

10.5.3 Product/ Services Offered

10.5.4 SWOT Analysis

10.6 J&K Scientific Ltd.

             10.6.1 Company Overview

10.6.2 Financial

10.6.3 Product/ Services Offered

10.6.4 SWOT Analysis

10.7 Medical Chem (Yancheng) Manufacturing Co. Ltd.

             10.7.1 Company Overview

10.7.2 Financial

10.7.3 Product/ Services Offered

10.7.4 SWOT Analysis

10.8 Hefei TNJ Chemical Industry Co. Ltd.

             10.8.1 Company Overview

10.8.2 Financial

10.8.3 Product/ Services Offered

10.8.4 SWOT Analysis

10.9 Lygos Inc. Co. Ltd.

             10.9.1 Company Overview

10.9.2 Financial

10.9.3 Product/ Services Offered

10.9.4 SWOT Analysis

10.10 Tateyama Kasei Co. Ltd.

             10.10.1 Company Overview

10.10.2 Financial

10.10.3 Product/ Services Offered

10.10.4 SWOT Analysis

11. Use Cases and Best Practices

12. Conclusion

An accurate research report requires proper strategizing as well as implementation. There are multiple factors involved in the completion of good and accurate research report and selecting the best methodology to compete the research is the toughest part. Since the research reports we provide play a crucial role in any company’s decision-making process, therefore we at SNS Insider always believe that we should choose the best method which gives us results closer to reality. This allows us to reach at a stage wherein we can provide our clients best and accurate investment to output ratio.

Each report that we prepare takes a timeframe of 350-400 business hours for production. Starting from the selection of titles through a couple of in-depth brain storming session to the final QC process before uploading our titles on our website we dedicate around 350 working hours. The titles are selected based on their current market cap and the foreseen CAGR and growth.


The 5 steps process:

Step 1: Secondary Research:

Secondary Research or Desk Research is as the name suggests is a research process wherein, we collect data through the readily available information. In this process we use various paid and unpaid databases which our team has access to and gather data through the same. This includes examining of listed companies’ annual reports, Journals, SEC filling etc. Apart from this our team has access to various associations across the globe across different industries. Lastly, we have exchange relationships with various university as well as individual libraries.

Secondary Research

Step 2: Primary Research

When we talk about primary research, it is a type of study in which the researchers collect relevant data samples directly, rather than relying on previously collected data.  This type of research is focused on gaining content specific facts that can be sued to solve specific problems. Since the collected data is fresh and first hand therefore it makes the study more accurate and genuine.

We at SNS Insider have divided Primary Research into 2 parts.

Part 1 wherein we interview the KOLs of major players as well as the upcoming ones across various geographic regions. This allows us to have their view over the market scenario and acts as an important tool to come closer to the accurate market numbers. As many as 45 paid and unpaid primary interviews are taken from both the demand and supply side of the industry to make sure we land at an accurate judgement and analysis of the market.

This step involves the triangulation of data wherein our team analyses the interview transcripts, online survey responses and observation of on filed participants. The below mentioned chart should give a better understanding of the part 1 of the primary interview.

Primary Research

Part 2: In this part of primary research the data collected via secondary research and the part 1 of the primary research is validated with the interviews from individual consultants and subject matter experts.

Consultants are those set of people who have at least 12 years of experience and expertise within the industry whereas Subject Matter Experts are those with at least 15 years of experience behind their back within the same space. The data with the help of two main processes i.e., FGDs (Focused Group Discussions) and IDs (Individual Discussions). This gives us a 3rd party nonbiased primary view of the market scenario making it a more dependable one while collation of the data pointers.

Step 3: Data Bank Validation

Once all the information is collected via primary and secondary sources, we run that information for data validation. At our intelligence centre our research heads track a lot of information related to the market which includes the quarterly reports, the daily stock prices, and other relevant information. Our data bank server gets updated every fortnight and that is how the information which we collected using our primary and secondary information is revalidated in real time.

Data Bank Validation

Step 4: QA/QC Process

After all the data collection and validation our team does a final level of quality check and quality assurance to get rid of any unwanted or undesired mistakes. This might include but not limited to getting rid of the any typos, duplication of numbers or missing of any important information. The people involved in this process include technical content writers, research heads and graphics people. Once this process is completed the title gets uploader on our platform for our clients to read it.

Step 5: Final QC/QA Process:

This is the last process and comes when the client has ordered the study. In this process a final QA/QC is done before the study is emailed to the client. Since we believe in giving our clients a good experience of our research studies, therefore, to make sure that we do not lack at our end in any way humanly possible we do a final round of quality check and then dispatch the study to the client.

Key Segments

By Application

  • Flavor Enhancer

  • API

  • Additive

  • pH Controller

  • Precursor

  • Others

By End-Use Industry

  • Food & Beverage

    • Confectionery

    • Beverages

    • Fruit Preparations & Preserves

    • Baked Items

    • Others

  • Pharmaceutical

  • Agriculture

  • Plastics

  • Paints & Coatings

  • Others

Request for Segment Customization as per your Business Requirement: Segment Customization Request

Regional Coverage:

North America

  • US

  • Canada

  • Mexico

Europe

  • Eastern Europe

    • Poland

    • Romania

    • Hungary

    • Turkey

    • Rest of Eastern Europe

  • Western Europe

    • Germany

    • France

    • UK

    • Italy

    • Spain

    • Netherlands

    • Switzerland

    • Austria

    • Rest of Western Europe

Asia Pacific

  • China

  • India

  • Japan

  • South Korea

  • Vietnam

  • Singapore

  • Australia

  • Rest of Asia Pacific

Middle East & Africa

  • Middle East

    • UAE

    • Egypt

    • Saudi Arabia

    • Qatar

    • Rest of Middle East

  • Africa

    • Nigeria

    • South Africa

    • Rest of Africa

  • Latin America

  • Brazil

  • Argentina

  • Colombia

  • Rest of Latin America

Request for Country Level Research Report: Country Level Customization Request

Available Customization

With the given market data, SNS Insider offers customization as per the company’s specific needs. The following customization options are available for the report:

  • Product Analysis

  • Criss-Cross segment analysis (e.g. Product X Application)

  • Product Matrix which gives a detailed comparison of the product portfolio of each company

  • Geographic Analysis

  • Additional countries in any of the regions

  • Company Information

  • Detailed analysis and profiling of additional market players (Up to five)


  •            5000 (33% Discount)


  •            8950 (40% Discount)


  •            3050 (23% Discount)

Start a Conversation

Hi! Click one of our member below to chat on Phone