Lottery Market Report Scope & Overview:
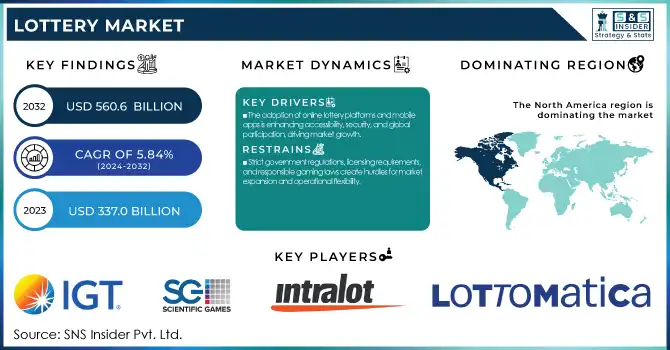
The Lottery Market was valued at USD 337.0 Billion in 2023 and is expected to reach USD 560.6 Billion by 2032, growing at a CAGR of 5.84% from 2024-2032.
The Lottery Market is experiencing rapid growth in digital lottery adoption worldwide, driven by rising smartphone usage and improved internet connectivity. Online lottery platforms are expanding, with operators leveraging blockchain and advanced payment solutions to enhance security and transparency. However, lottery fraud incidents have increased from 2020 to 2023, leading to stricter regulations and improved verification processes. Meanwhile, mobile and online ticket sales continue to rise, supported by intuitive lottery apps and government-backed initiatives promoting digital gaming.
To get more information on Lottery Market - Request Free Sample Report
Lottery Market Dynamics
Drivers
-
The adoption of online lottery platforms and mobile apps is enhancing accessibility, security, and global participation, driving market growth.
Digital technology adoption has accelerated, leading to changes in lottery market dynamics as people access lotteries via online platforms and mobile apps. The income of participants is backed up with payments to the hosting country, creating solidity and ease in the digital payments integration; blockchain proves plurality transparency, and randomization is AI-driven. Official digital lottery platforms are launched by both governments and operators to meet the needs of tech-savvy users once again. Thus, the increasing adoption of online systems over traditional paper-based lotteries is driving the growth of market share, an adoption that is now more common in areas with a large number of smartphone users. The purchase and the online participation in international lotteries also add up to the market growth.
Restraints
-
Strict government regulations, licensing requirements, and responsible gaming laws create hurdles for market expansion and operational flexibility.
One of the major factors that is creating hindrances to the expansion of the market is the strict regulatory policies of the lottery industry across several nations and states. This access is often restricted, with tight licensing requirements, age limits, and taxation from the governments over it. Moreover, gambling addiction and responsible gaming have come under the magnifying glass and the industry has been faced with the highest of compliance requirements. Operators are legally bound to comply with changing regulations and must implement responsible gaming measures, such as self-exclusion facilities and spending limits, to reduce regulatory risk. And penalties, or bans, for the lotteries outside the law, are hindering the expansion of the most traditional and digital lottery markets.
Opportunities
-
Blockchain technology ensures transparency, security, and decentralized lottery operations, attracting digital-native players and boosting trust.
Blockchain is changing the lottery market with transparent, tamper-proof, and decentralized gaming solutions. Smart contracts facilitate payouts without human intervention, which reduces the likelihood of fraud, and ensures fairness. In addition, decentralized lottery platforms can increase trust between players, as all transactions are recorded on an immutable ledger. Given the technological transparency of this system, its attractiveness is even greater in areas where existing lottery systems have been decried as opaque. As interest in crypto-lotteries and blockchain-based gaming solutions rises, the market is poised to draw another wave of users, this time digital natives that favor safe and private transactions.
Challenges
-
Rising cyber threats, fraud schemes, and hacking attempts pose challenges to online lottery platforms, requiring stronger security measures.
The digital shift in the lottery market is creating opportunities for cyberattacks and scams. The risks to operators and players alike; with scammers phishing for details alerting them to non-existent lottery wins or uploading Trojan viruses to online lottery databases. Cybercriminals take advantage of holes in digital payment systems and online ticketing platforms, performing everything from rigging contests to harvesting personal data. This increased risk is driving lottery providers to invest more than ever in cybersecurity, including encryption, multi-factor authentication, and cyber fraud detection through AI. Neglecting these risks can lead to financial loss and reputational damage that would place players' faith in the lottery ecosystem in jeopardy.
Lottery Market Segment Analysis
By Category
In 2023, The draw-based lottery segment dominated the market and represented a significant revenue share. Some of these factors include the appeal and access-enhancing characteristics of draw-based lotteries as the basis for their growing share. The rise of technology, especially smartphones and high-speed Internet, is one of the main drivers.
The sports game lottery segment is expected to register the fastest CAGR from 2024 to 2032, Sports lotteries are also interesting due to the event itself and the excitement with it. Mega events like the World Cup or the Olympics generate specific interest and participants in the game and the same translates to growth in lottery games on these events. These sizable prizes up for grabs during these events also encourage the purchase of tickets.
By Application
The offline lottery segment dominated the market and accounted for a revenue share of more than 73% in 2023, One of the largest drivers of growth is consumers' natural trust in existing lottery systems. Furthermore, offline lotteries are also heavily backed by government regulation. State-run or heavily regulated, lotteries operate on the premise that proceeds go to some public use, such as education or infrastructure. They boost public image and encourage participation due to consumers gaining a sense of contributing to the welfare of society.
The online lottery segment is expected to register the fastest CAGR during the forecast period. The growth can be attributed primarily to the rising internet penetration and the growing number of smartphone users. Hence, with the growing broadband penetration among mass consumers, individuals can easily participate in online lottery games from anywhere, anytime, which reduces the need for purchasing tickets from stores and visiting retail outlets.
Regional Analysis
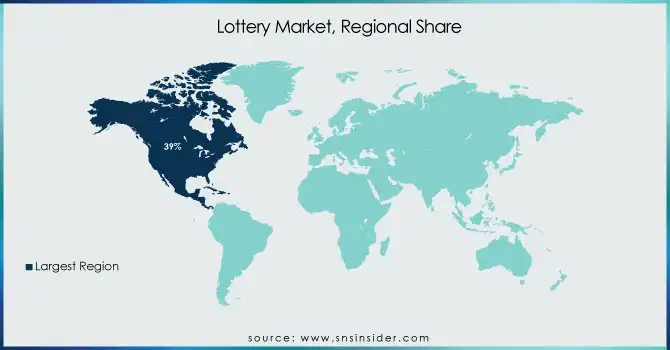
North America dominated the market and accounted for significant revenue share of more than 39% in 2023. There has been a higher penetration of online lottery platforms in this region. Growth of the market is supported through the launch of new games and formats tailored to suit changing consumer preferences. As lottery operators strive to re-engage players, several game formats have popped up alongside the traditional draw-based game. Demand for instant-win scratch-off tickets and interactive games is rising due to overall churn in the market.
The Asia Pacific is expected to register the fastest CAGR during the forecast period. Consumers having larger disposable incomes is a crucial market driver, with more of the population able to play lottery games for fun. With a growing middle class, several people are keen on spending on recreation and the lottery is one among them.
Get Customized Report as per Your Business Requirement - Enquiry Now
Key Players
The major key players along with their products are
-
International Game Technology (IGT) – Aurora Lottery System
-
Scientific Games Corporation – SciQ Lottery Retail Ecosystem
-
Camelot Group – UK National Lottery Platform
-
INTRALOT S.A. – LotosX Lottery Solution
-
Francaise des Jeux (FDJ) – ParionsSport Lottery
-
Lottomatica S.p.A. – My Lotto App
-
Hong Kong Jockey Club – Mark Six Lottery
-
Florida Lottery – Jackpot Triple Play
-
California State Lottery – SuperLotto Plus
-
China Sports Lottery – Welfare Lottery System
-
Tatts Group (The Lott) – Oz Lotto
-
Singapore Pools – TOTO Lottery
-
Camelot Lottery Solutions – iLottery Platform
-
NeoGames S.A. – NeoSphere Lottery Platform
-
Loto-Québec – Lotteries Online
Recent Developments
-
January 2024: Scientific Games Corporation announced the launch of a new instant game platform designed to enhance player engagement and streamline lottery operations.
-
March 2024: INTRALOT S.A. secured a five-year contract extension with a major European lottery operator to provide advanced gaming solutions and services.
-
June 2024: Camelot Group reported a significant increase in digital lottery sales, attributing the growth to the successful implementation of their new mobile application.
| Report Attributes | Details |
|---|---|
| Market Size in 2023 | USD 337.0 Billion |
| Market Size by 2032 | USD 560.6 Billion |
| CAGR | CAGR of 5.84% From 2024 to 2032 |
| Base Year | 2023 |
| Forecast Period | 2024-2032 |
| Historical Data | 2020-2022 |
| Report Scope & Coverage | Market Size, Segments Analysis, Competitive Landscape, Regional Analysis, DROC & SWOT Analysis, Forecast Outlook |
| Key Segments | • By Category (Draw based lottery, Instant games, Sports game) • By Application (Online, Offline) |
| Regional Analysis/Coverage | North America (US, Canada, Mexico), Europe (Eastern Europe [Poland, Romania, Hungary, Turkey, Rest of Eastern Europe] Western Europe] Germany, France, UK, Italy, Spain, Netherlands, Switzerland, Austria, Rest of Western Europe]), Asia Pacific (China, India, Japan, South Korea, Vietnam, Singapore, Australia, Rest of Asia Pacific), Middle East & Africa (Middle East [UAE, Egypt, Saudi Arabia, Qatar, Rest of Middle East], Africa [Nigeria, South Africa, Rest of Africa], Latin America (Brazil, Argentina, Colombia, Rest of Latin America) |
| Company Profiles | International Game Technology (IGT), Scientific Games Corporation, Camelot Group, INTRALOT S.A., Francaise des Jeux (FDJ), Lottomatica S.p.A., Hong Kong Jockey Club, Florida Lottery, California State Lottery, China Sports Lottery, Tatts Group (The Lott), Singapore Pools, Camelot Lottery Solutions, NeoGames S.A., Loto-Québec |
