To get more information on Location-Based Entertainment Market - Request Free Sample Report
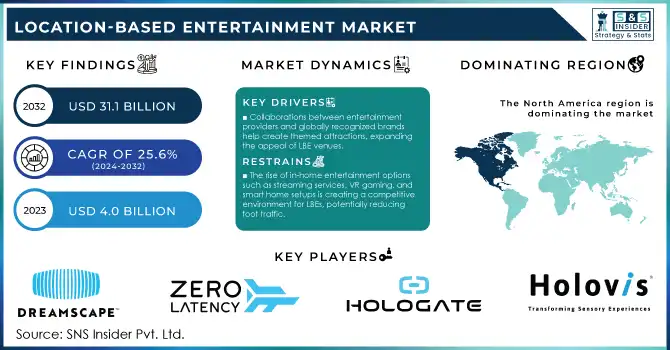
The Location-Based Entertainment Market Size was valued at USD 4.0 Billion in 2023 and is expected to reach USD 31.1 Billion by 2032, growing at a CAGR of 25.6 % over the forecast period 2024-2032.
The global location-based entertainment (LBE) market is experiencing significant growth due to several factors, such as government support, and technological development. U.S. Department of Commerce states the global entertainment and media market grew 6% per year in 2023, affecting the LBE greatly. The demand for immersive attractions, such as augmented reality and virtual reality, stimulates the growth of LBE in amusement parks, arcades, and gaming centers. Moreover, the government’s efforts to develop tourism also stimulate the growth of LBE. For example, the World Tourism Organization reports that international tourists increased by 4% in 2023, making the LBE more attractive for consumers who are looking for unique entertainment experiences. Other factors that also stimulate the growth of the market would be the increasing popularity of themed attractions and interactive exhibits. The technology is also moving forward with advanced technologies, such as 5G, that facilitate the influence of faster data on LBEs. Thanks to modern technologies, LBE can offer its guests high-quality entertainment experiences. The industry also attracts more investments from governments and companies who are creating infrastructure for LBE. The activity is particularly important for development in Asia-Pacific. Consumer spending on recreational leisure is rising, prompting the LBE industry’s growth.
The gaming industry is transforming with more LBE technology-driven initiatives. Consumers are involved more in VR, especially in the multiplayer form. Smaller firms are investing in LBEs as a result of the trend, while the big wigs invest and develop various technologies to make the consumer’s experience more enjoyable, such as AR, VR, MR, IDD, and 3DPM. For example, Apple and Disney communicated their plans for a platform of VR content in 2023. The LBE becomes attractive for consumers since it does not require them any personal simulation gadgets, and on the other hand, provides them with an immersive environment. The LBE also changes consumers’ perception of malls, turning them into social hubs of entertainment and shopping.
Drivers
The integration of advanced virtual and augmented reality experiences into location-based entertainment is driving consumer interest and enhancing immersive experiences, fuelling market growth.
Theme parks, interactive experiences, and immersive installations are gaining popularity as people seek more personalized and engaging entertainment options.
Growing disposable incomes, particularly among younger audiences, are boosting demand for unique, experience-driven entertainment, contributing to the expansion of LBE.
Collaborations between entertainment providers and globally recognized brands help create themed attractions, expanding the appeal of LBE venues.
The location-based entertainment market is primarily driven by extensive developments in virtual reality and augmented reality technologies leading to enhanced immersive entertainment. VR and AR as technologies have been witnessing rapid advancements, and development and location-based entertainment venues, thereby going beyond the traditional amusement parks or cinemas, have become highly interactive and immersive. For example, VR attractions in places like the VOID and Dreamscape have become increasingly popular because they allow users to enter entirely new, virtual worlds while still engaging with real space. Such a development has increased the immersive character of location-based entertainment by several notches. Investing in VR-based entertainment is particularly likely to appeal to Millennials and Gen Z, who tend to value experiences enabled by new, immersive technologies.
According to a recent survey, 65% of consumers are more likely to use entertainment applications or platforms that include VR and AR. The global user base of VR/AR technologies is also growing, and more and more LBEs focusing on immersive entertainment products and services are expected to experience more “foot traffic”. Similarly, theme parks are coming up with high-quality VR rides, such as the VR-based Mario Kart ride at Universal Studios Japan, where riders wear VR glasses and “race” using physical mobility on a track that employs cutting-edge VR technology. Such high-tech experiences that include the perfect combination of physical and digital reality are known to keep driving users back and further engaging with them.
Restraints:
The high cost of developing and maintaining state-of-the-art immersive entertainment environments, including equipment, technology, and venues, limits the entry of smaller players into the market.
The rise of in-home entertainment options such as streaming services, VR gaming, and smart home setups is creating a competitive environment for LBEs, potentially reducing foot traffic.
One of the critical challenges for the location-based entertainment market is the high costs associated with the initial setup. The market is built around a variety of technologies, ensuring immersive experiences and utilizing either virtual reality or augmented reality approaches. Importing these technologies implies investing in a variety of equipment and its extensive reach to the venue, which has to be designed with respective technological support. Some of the equipment includes VR headsets, motion capture systems, high-end projectors, and custom-designed spaces for interactions. Additionally, ongoing maintenance costs and regular technology upgrades are necessary to keep the experience fresh and competitive. This high initial investment may be limiting for emerging market players. These high costs can be prohibitive, especially for smaller players, limiting market entry and innovation. Large entertainment companies and established venues may have the financial capacity to absorb these costs, but newer entrants face challenges in securing the required capital. The need for substantial investment also makes it difficult to offer frequent upgrades or adaptations, potentially limiting the variety and appeal of the entertainment offerings over time.
By Component Type
The hardware segment contributed to around 64% of the total revenue in the location-based entertainment market in 2023. This is due to the high demand for innovative, high-tech equipment that is required to provide a high level of immersion in LBE venues. The growth of smart city projects that is observed in the U.S., China, and other countries in Europe, the Middle East, and Africa, supports the rapid development of the hardware market. VR headsets, motion tracking devices, and other innovative solutions are becoming an integral part of LBE centers. According to the U.S. Bureau of Economic Analysis, the consumption of hardware and equipment in the entertainment domain has already increased by 5% in 2023. It is expected that the ongoing development and popularization of 5G technologies will further support the growth of the hardware domain. Mobile apps and VR glasses utilizing this technology are often used in LBE centers, which stimulates the demand for new devices. The global rise in demand for interactive and immersive experiences, especially among millennials and Gen Z, has also led to an increased focus on upgrading LBE venues with cutting-edge hardware solution
By Technology
In 2023, the 3-Dimensional technology segment was the largest and accounted for over 41% of the market revenue share. The contribution is expected to remain substantial in the future due to the high demand for 3D immersive experiences in various entertainment venues, such as cinemas, museums, and theme parks. Moreover, government-based incentives and programs aimed at promoting technological innovation, such as the Horizon Europe mission of the European Commission, supported the adoption of 3D technology across various LBE locations. The program focused on research in digital technologies and allocated over €10 billion to support innovation. Furthermore, consumer demand for lifelike and immersive experiences propelled entertainment providers to implement 3D technology, increasingly using it in the gaming and movie industries. According to the U.S. National Endowment for the Arts, in 2023, 3D cinema revenue grew by 8%, which reflects the rising public interest in the technology. It is expected that the trend will remain in the future, notwithstanding the fast-paced technological advancement in the field of holography and projection that contributes to the improvement of the quality of 3D experiences.
By End-Use
In 2023, the amusement parks segment accounted for a significant market share of about 40%. This is primarily because of the high demand for outdoor, family-friendly experiences, which offer attraction for tourists. Amusement parks have acquired a central role in the LBE market, as they can provide a wealth of entertainment opportunities, including not only various themed coasters and rides but also AR and VR experiences that fully immerse the customer. This trend is attributable to the worldwide drive towards increasing tourism. According to the United Nations World Tourism Organization, international tourist arrivals have reached 1.4 billion by the year 2023, and as a result, today, amusement parks are more visited than ever both in developed and developing countries. An additional factor that has contributed to the increasing dominance of this market segment is governments’ interest in encouraging the development of new parks and other entertainment centers as a part of broader economic policy that aims to boost the local economy and increase employment. For example, China’s Ministry of Culture and Tourism announced the construction of several large-scale amusement parks, contributing to the segment’s growth.
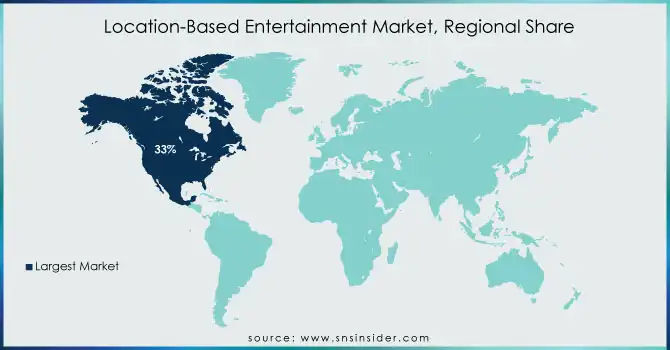
North America region dominated and accounted for 33% revenue share in the LBE market in 2023. The region’s dominance is attributed to its superior technological infrastructure and the high inclination toward immersive entertainment such as virtual reality and augmented reality. The U.S. Department of Commerce reports that consumer expenditure on recreational and entertainment services in the U.S. increased by 7% in 2023, an indication that the demand for entertainment alternatives is high. The increased coverage of 5G in North America is instrumental in the growth of the LBE market. 5G facilitates high-quality interaction during real-time applications at amusement parks, cinemas, and gaming centers. The growth of North America’s LBE market is attributable to the robust tourism industry. The U.S. Travel Association reports that there was a 9% hike in domestic travel in 2023, translating to increased visits to the LBEs, such as theme parks and interactive museums, in the U.S. Notably, North America is home to some of the leading entertainment conglomerates, including Disney and Universal Studios. The corporations are constantly upgrading and innovating to become more interactive and engaging. The recent progressions have been instrumental in consolidating North America’s dominance in the LBE in the worldwide market.
On the other hand, the Asia Pacific LBE industry is growing at a significant growth rate due to the increased consumer demand and government investment in entertainment infrastructure. The fast growth rate is linked to the increased levels of disposable income and the demand for novel entertainment experiences in countries such as China, Japan, and South Korea. The governments in the region have intensified their spending toward the development of their entertainment infrastructure. China’s 14th Five-Year Plan emphasizes the growth of the cultural and entertainment industries. Notably, the country reported a 6% growth in the cultural and entertainment sectors in 2023, according to the National Bureau of Statistics of China. The Asia Pacific region also has a large middle-class population that is inclined towards the consumption of entertainment services.
Get Customized Report as per Your Business Requirement - Enquiry Now
March 2023, Merlin Entertainments posted the announcement of its plans to open a second Peppa Pig Theme Park in North Texas with the expected opening date in 2024. This UK-based company is a global leader in location-based entertainment.
In January 2023, Walt Disney and Apple, Inc. joined their efforts to create a VR content platform for Apple’s headsets. The hardware would be developed with a collaborative establishment, Sony Group Corporation.
July 2023, the U.S. Department of Commerce announced a USD 500 million expenditure on boosting technological development in the LBE sphere. The investment is released to develop next-generation VR and AR technologies to establish a more immersive experience in entertainment places throughout the state.
Key Service Providers/Manufacturers:
The VOID – [Hyper-Reality Experience, Star Wars: Secrets of the Empire]
Dreamscape Immersive – [Alien Zoo, The Blu: Deep Rescue]
Spaces, Inc. – [Terminator Salvation: Fight for the Future, Virtual Reality Arena]
Zero Latency – [Undead Arena, Singularity]
Tyffon Inc. – [Tyffonium Shibuya, Corridor of the Mirror]
Hologate – [Simurai, Cold Clash]
Illuminarium Experiences – [WILD Safari Experience, SPACE: A Journey to the Moon]
Nomadic – [Arizona Sunshine, The House of the Dead]
Holovis International Ltd. – [Immersive Theaters, DomeVR]
VRstudios – [VRcade Arena, PowerPlay]
Disney Parks, Experiences and Products
Universal Parks & Resorts
Merlin Entertainments
Cinemark Theatres
AMC Theatres
Madame Tussauds
IMAX Corporation
SeaWorld Entertainment
Cedar Fair Entertainment Company
Parques Reunidos
| Report Attributes | Details |
|---|---|
| Market Size in 2023 | USD 4.0 Billion |
| Market Size by 2032 | USD 31.1 Billion |
| CAGR | CAGR of 25.6% From 2024 to 2032 |
| Base Year | 2023 |
| Forecast Period | 2024-2032 |
| Historical Data | 2020-2022 |
| Report Scope & Coverage | Market Size, Segments Analysis, Competitive Landscape, Regional Analysis, DROC & SWOT Analysis, Forecast Outlook |
| Key Segments | • By Component Type (Hardware, Software) • By Technology (2 Dimensional (2D), 3 Dimensional (3D), Cloud Merged Reality) • By End-use (Amusement Parks, Arcade Studios, 4D films) |
| Regional Analysis/Coverage | North America (US, Canada, Mexico), Europe (Eastern Europe [Poland, Romania, Hungary, Turkey, Rest of Eastern Europe] Western Europe [Germany, France, UK, Italy, Spain, Netherlands, Switzerland, Austria, Rest of Western Europe]), Asia Pacific (China, India, Japan, South Korea, Vietnam, Singapore, Australia, Rest of Asia Pacific), Middle East & Africa (Middle East [UAE, Egypt, Saudi Arabia, Qatar, Rest of Middle East], Africa [Nigeria, South Africa, Rest of Africa], Latin America (Brazil, Argentina, Colombia, Rest of Latin America) |
| Company Profiles | The VOID, Dreamscape Immersive, Spaces, Inc., Zero Latency, Tyffon Inc., Hologate, Illuminarium Experiences, Nomadic, Holovis International Ltd., VRstudios. |
| Key Drivers | • The integration of advanced virtual and augmented reality experiences into location-based entertainment is driving consumer interest and enhancing immersive experiences, fuelling market growth. • Theme parks, interactive experiences, and immersive installations are gaining popularity as people seek more personalized and engaging entertainment options. |
| RESTRAINTS | • The high cost of developing and maintaining state-of-the-art immersive entertainment environments, including equipment, technology, and venues, limits the entry of smaller players into the market. |
Ans: The projected market size for the Location-Based Entertainment Market is USD 31.1 billion by 2032.
Ans: The North American region dominated the Location-Based Entertainment Market in 2023.
Ans. The CAGR of the Location-Based Entertainment Market is 25.6 % During the forecast period of 2024-2032.
Ans: The Hardware Component Type segment dominated the Location-Based Entertainment Market in 2023.
Ans: The key players in Location-Based Entertainment market are The VOID, Dreamscape Immersive, Spaces, Inc., Zero Latency, Tyffon Inc., Hologate, Illuminarium Experiences, Nomadic, Holovis International Ltd., VRstudios and others
Table of Contents:
1. Introduction
1.1 Market Definition
1.2 Scope (Inclusion and Exclusions)
1.3 Research Assumptions
2. Executive Summary
2.1 Market Overview
2.2 Regional Synopsis
2.3 Competitive Summary
3. Research Methodology
3.1 Top-Down Approach
3.2 Bottom-up Approach
3.3. Data Validation
3.4 Primary Interviews
4. Market Dynamics Impact Analysis
4.1 Market Driving Factors Analysis
4.1.1 Drivers
4.1.2 Restraints
4.1.3 Opportunities
4.1.4 Challenges
4.2 PESTLE Analysis
4.3 Porter’s Five Forces Model
5. Statistical Insights and Trends Reporting
5.1 Adoption Rates of Emerging Technologies
5.2 Network Infrastructure Expansion, by Region
5.3 Cybersecurity Incidents, by Region (2020-2023)
5.4 Cloud Services Usage, by Region
6. Competitive Landscape
6.1 List of Major Companies, By Region
6.2 Market Share Analysis, By Region
6.3 Product Benchmarking
6.3.1 Product specifications and features
6.3.2 Pricing
6.4 Strategic Initiatives
6.4.1 Marketing and promotional activities
6.4.2 Distribution and supply chain strategies
6.4.3 Expansion plans and new product launches
6.4.4 Strategic partnerships and collaborations
6.5 Technological Advancements
6.6 Market Positioning and Branding
7. Location-Based Entertainment Market Segmentation, By Component Type
7.1 Chapter Overview
7.2 Hardware
7.2.1 Hardware Market Trends Analysis (2020-2032)
7.2.2 Hardware Market Size Estimates and Forecasts to 2032 (USD Billion)
7.3 Software
7.3.1 Software Market Trends Analysis (2020-2032)
7.3.2 Software Market Size Estimates and Forecasts to 2032 (USD Billion)
8. Location-Based Entertainment Market Segmentation, By Technology
8.1 Chapter Overview
8.2 Dimensional (2D)
8.2.1 2-Dimensional (2D) Market Trends Analysis (2020-2032)
8.2.2 2-Dimensional (2D) Market Size Estimates and Forecasts to 2032 (USD Billion)
8.3 3 Dimensional (3D)
8.3.1 3-Dimensional (3D) Market Trends Analysis (2020-2032)
8.3.2 3-Dimensional (3D) Market Size Estimates and Forecasts to 2032 (USD Billion)
8.4 IP Cloud Merged Reality
8.4.1 IP Cloud Merged Reality Market Trends Analysis (2020-2032)
8.4.2 IP Cloud Merged Reality Market Size Estimates and Forecasts to 2032 (USD Billion)
9. Location-Based Entertainment Market Segmentation, By End-use
9.1 Chapter Overview
9.2 Amusement Parks
9.2.1 Amusement Parks Market Trends Analysis (2020-2032)
9.2.2 Amusement Parks Market Size Estimates and Forecasts to 2032 (USD Billion)
9.3 Arcade Studios
9.3.1 Arcade Studios Market Trends Analysis (2020-2032)
9.3.2 Arcade Studios Market Size Estimates and Forecasts to 2032 (USD Billion)
9.4 4D films
9.4.1 4D films Market Trends Analysis (2020-2032)
9.4.2 4D films Market Size Estimates and Forecasts to 2032 (USD Billion)
10. Regional Analysis
10.1 Chapter Overview
10.2 North America
10.2.1 Trends Analysis
10.2.2 North America Location-Based Entertainment Market Estimates and Forecasts, by Country (2020-2032) (USD Billion)
10.2.3 North America Location-Based Entertainment Market Estimates and Forecasts, By Component Type (2020-2032) (USD Billion)
10.2.4 North America Location-Based Entertainment Market Estimates and Forecasts, By Technology (2020-2032) (USD Billion)
10.2.5 North America Location-Based Entertainment Market Estimates and Forecasts, By End-use (2020-2032) (USD Billion)
10.2.6 USA
10.2.6.1 USA Location-Based Entertainment Market Estimates and Forecasts, By Component Type (2020-2032) (USD Billion)
10.2.6.2 USA Location-Based Entertainment Market Estimates and Forecasts, By Technology (2020-2032) (USD Billion)
10.2.6.3 USA Location-Based Entertainment Market Estimates and Forecasts, By End-use (2020-2032) (USD Billion)
10.2.7 Canada
10.2.7.1 Canada Location-Based Entertainment Market Estimates and Forecasts, By Component Type (2020-2032) (USD Billion)
10.2.7.2 Canada Location-Based Entertainment Market Estimates and Forecasts, By Technology (2020-2032) (USD Billion)
10.2.7.3 Canada Location-Based Entertainment Market Estimates and Forecasts, By End-use (2020-2032) (USD Billion)
10.2.8 Mexico
10.2.8.1 Mexico Location-Based Entertainment Market Estimates and Forecasts, By Component Type (2020-2032) (USD Billion)
10.2.8.2 Mexico Location-Based Entertainment Market Estimates and Forecasts, By Technology (2020-2032) (USD Billion)
10.2.8.3 Mexico Location-Based Entertainment Market Estimates and Forecasts, By End-use (2020-2032) (USD Billion)
10.3 Europe
10.3.1 Eastern Europe
10.3.1.1 Trends Analysis
10.3.1.2 Eastern Europe Location-Based Entertainment Market Estimates and Forecasts, by Country (2020-2032) (USD Billion)
10.3.1.3 Eastern Europe Location-Based Entertainment Market Estimates and Forecasts, By Component Type (2020-2032) (USD Billion)
10.3.1.4 Eastern Europe Location-Based Entertainment Market Estimates and Forecasts, By Technology (2020-2032) (USD Billion)
10.3.1.5 Eastern Europe Location-Based Entertainment Market Estimates and Forecasts, By End-use (2020-2032) (USD Billion)
10.3.1.6 Poland
10.3.1.6.1 Poland Location-Based Entertainment Market Estimates and Forecasts, By Component Type (2020-2032) (USD Billion)
10.3.1.6.2 Poland Location-Based Entertainment Market Estimates and Forecasts, By Technology (2020-2032) (USD Billion)
10.3.1.6.3 Poland Location-Based Entertainment Market Estimates and Forecasts, By End-use (2020-2032) (USD Billion)
10.3.1.7 Romania
10.3.1.7.1 Romania Location-Based Entertainment Market Estimates and Forecasts, By Component Type (2020-2032) (USD Billion)
10.3.1.7.2 Romania Location-Based Entertainment Market Estimates and Forecasts, By Technology (2020-2032) (USD Billion)
10.3.1.7.3 Romania Location-Based Entertainment Market Estimates and Forecasts, By End-use (2020-2032) (USD Billion)
10.3.1.8 Hungary
10.3.1.8.1 Hungary Location-Based Entertainment Market Estimates and Forecasts, By Component Type (2020-2032) (USD Billion)
10.3.1.8.2 Hungary Location-Based Entertainment Market Estimates and Forecasts, By Technology (2020-2032) (USD Billion)
10.3.1.8.3 Hungary Location-Based Entertainment Market Estimates and Forecasts, By End-use (2020-2032) (USD Billion)
10.3.1.9 Turkey
10.3.1.9.1 Turkey Location-Based Entertainment Market Estimates and Forecasts, By Component Type (2020-2032) (USD Billion)
10.3.1.9.2 Turkey Location-Based Entertainment Market Estimates and Forecasts, By Technology (2020-2032) (USD Billion)
10.3.1.9.3 Turkey Location-Based Entertainment Market Estimates and Forecasts, By End-use (2020-2032) (USD Billion)
10.3.1.10 Rest of Eastern Europe
10.3.1.10.1 Rest of Eastern Europe Location-Based Entertainment Market Estimates and Forecasts, By Component Type (2020-2032) (USD Billion)
10.3.1.10.2 Rest of Eastern Europe Location-Based Entertainment Market Estimates and Forecasts, By Technology (2020-2032) (USD Billion)
10.3.1.10.3 Rest of Eastern Europe Location-Based Entertainment Market Estimates and Forecasts, By End-use (2020-2032) (USD Billion)
10.3.2 Western Europe
10.3.2.1 Trends Analysis
10.3.2.2 Western Europe Location-Based Entertainment Market Estimates and Forecasts, by Country (2020-2032) (USD Billion)
10.3.2.3 Western Europe Location-Based Entertainment Market Estimates and Forecasts, By Component Type (2020-2032) (USD Billion)
10.3.2.4 Western Europe Location-Based Entertainment Market Estimates and Forecasts, By Technology (2020-2032) (USD Billion)
10.3.2.5 Western Europe Location-Based Entertainment Market Estimates and Forecasts, By End-use (2020-2032) (USD Billion)
10.3.2.6 Germany
10.3.2.6.1 Germany Location-Based Entertainment Market Estimates and Forecasts, By Component Type (2020-2032) (USD Billion)
10.3.2.6.2 Germany Location-Based Entertainment Market Estimates and Forecasts, By Technology (2020-2032) (USD Billion)
10.3.2.6.3 Germany Location-Based Entertainment Market Estimates and Forecasts, By End-use (2020-2032) (USD Billion)
10.3.2.7 France
10.3.2.7.1 France Location-Based Entertainment Market Estimates and Forecasts, By Component Type (2020-2032) (USD Billion)
10.3.2.7.2 France Location-Based Entertainment Market Estimates and Forecasts, By Technology (2020-2032) (USD Billion)
10.3.2.7.3 France Location-Based Entertainment Market Estimates and Forecasts, By End-use (2020-2032) (USD Billion)
10.3.2.8 UK
10.3.2.8.1 UK Location-Based Entertainment Market Estimates and Forecasts, By Component Type (2020-2032) (USD Billion)
10.3.2.8.2 UK Location-Based Entertainment Market Estimates and Forecasts, By Technology (2020-2032) (USD Billion)
10.3.2.8.3 UK Location-Based Entertainment Market Estimates and Forecasts, By End-use (2020-2032) (USD Billion)
10.3.2.9 Italy
10.3.2.9.1 Italy Location-Based Entertainment Market Estimates and Forecasts, By Component Type (2020-2032) (USD Billion)
10.3.2.9.2 Italy Location-Based Entertainment Market Estimates and Forecasts, By Technology (2020-2032) (USD Billion)
10.3.2.9.3 Italy Location-Based Entertainment Market Estimates and Forecasts, By End-use (2020-2032) (USD Billion)
10.3.2.10 Spain
10.3.2.10.1 Spain Location-Based Entertainment Market Estimates and Forecasts, By Component Type (2020-2032) (USD Billion)
10.3.2.10.2 Spain Location-Based Entertainment Market Estimates and Forecasts, By Technology (2020-2032) (USD Billion)
10.3.2.10.3 Spain Location-Based Entertainment Market Estimates and Forecasts, By End-use (2020-2032) (USD Billion)
10.3.2.11 Netherlands
10.3.2.11.1 Netherlands Location-Based Entertainment Market Estimates and Forecasts, By Component Type (2020-2032) (USD Billion)
10.3.2.11.2 Netherlands Location-Based Entertainment Market Estimates and Forecasts, By Technology (2020-2032) (USD Billion)
10.3.2.11.3 Netherlands Location-Based Entertainment Market Estimates and Forecasts, By End-use (2020-2032) (USD Billion)
10.3.2.12 Switzerland
10.3.2.12.1 Switzerland Location-Based Entertainment Market Estimates and Forecasts, By Component Type (2020-2032) (USD Billion)
10.3.2.12.2 Switzerland Location-Based Entertainment Market Estimates and Forecasts, By Technology (2020-2032) (USD Billion)
10.3.2.12.3 Switzerland Location-Based Entertainment Market Estimates and Forecasts, By End-use (2020-2032) (USD Billion)
10.3.2.13 Austria
10.3.2.13.1 Austria Location-Based Entertainment Market Estimates and Forecasts, By Component Type (2020-2032) (USD Billion)
10.3.2.13.2 Austria Location-Based Entertainment Market Estimates and Forecasts, By Technology (2020-2032) (USD Billion)
10.3.2.13.3 Austria Location-Based Entertainment Market Estimates and Forecasts, By End-use (2020-2032) (USD Billion)
10.3.2.14 Rest of Western Europe
10.3.2.14.1 Rest of Western Europe Location-Based Entertainment Market Estimates and Forecasts, By Component Type (2020-2032) (USD Billion)
10.3.2.14.2 Rest of Western Europe Location-Based Entertainment Market Estimates and Forecasts, By Technology (2020-2032) (USD Billion)
10.3.2.14.3 Rest of Western Europe Location-Based Entertainment Market Estimates and Forecasts, By End-use (2020-2032) (USD Billion)
10.4 Asia Pacific
10.4.1 Trends Analysis
10.4.2 Asia Pacific Location-Based Entertainment Market Estimates and Forecasts, by Country (2020-2032) (USD Billion)
10.4.3 Asia Pacific Location-Based Entertainment Market Estimates and Forecasts, By Component Type (2020-2032) (USD Billion)
10.4.4 Asia Pacific Location-Based Entertainment Market Estimates and Forecasts, By Technology (2020-2032) (USD Billion)
10.4.5 Asia Pacific Location-Based Entertainment Market Estimates and Forecasts, By End-use (2020-2032) (USD Billion)
10.4.6 China
10.4.6.1 China Location-Based Entertainment Market Estimates and Forecasts, By Component Type (2020-2032) (USD Billion)
10.4.6.2 China Location-Based Entertainment Market Estimates and Forecasts, By Technology (2020-2032) (USD Billion)
10.4.6.3 China Location-Based Entertainment Market Estimates and Forecasts, By End-use (2020-2032) (USD Billion)
10.4.7 India
10.4.7.1 India Location-Based Entertainment Market Estimates and Forecasts, By Component Type (2020-2032) (USD Billion)
10.4.7.2 India Location-Based Entertainment Market Estimates and Forecasts, By Technology (2020-2032) (USD Billion)
10.4.7.3 India Location-Based Entertainment Market Estimates and Forecasts, By End-use (2020-2032) (USD Billion)
10.4.8 Japan
10.4.8.1 Japan Location-Based Entertainment Market Estimates and Forecasts, By Component Type (2020-2032) (USD Billion)
10.4.8.2 Japan Location-Based Entertainment Market Estimates and Forecasts, By Technology (2020-2032) (USD Billion)
10.4.8.3 Japan Location-Based Entertainment Market Estimates and Forecasts, By End-use (2020-2032) (USD Billion)
10.4.9 South Korea
10.4.9.1 South Korea Location-Based Entertainment Market Estimates and Forecasts, By Component Type (2020-2032) (USD Billion)
10.4.9.2 South Korea Location-Based Entertainment Market Estimates and Forecasts, By Technology (2020-2032) (USD Billion)
10.4.9.3 South Korea Location-Based Entertainment Market Estimates and Forecasts, By End-use (2020-2032) (USD Billion)
10.4.10 Vietnam
10.4.10.1 Vietnam Location-Based Entertainment Market Estimates and Forecasts, By Component Type (2020-2032) (USD Billion)
10.4.10.2 Vietnam Location-Based Entertainment Market Estimates and Forecasts, By Technology (2020-2032) (USD Billion)
10.4.10.3 Vietnam Location-Based Entertainment Market Estimates and Forecasts, By End-use (2020-2032) (USD Billion)
10.4.11 Singapore
10.4.11.1 Singapore Location-Based Entertainment Market Estimates and Forecasts, By Component Type (2020-2032) (USD Billion)
10.4.11.2 Singapore Location-Based Entertainment Market Estimates and Forecasts, By Technology (2020-2032) (USD Billion)
10.4.11.3 Singapore Location-Based Entertainment Market Estimates and Forecasts, By End-use (2020-2032) (USD Billion)
10.4.12 Australia
10.4.12.1 Australia Location-Based Entertainment Market Estimates and Forecasts, By Component Type (2020-2032) (USD Billion)
10.4.12.2 Australia Location-Based Entertainment Market Estimates and Forecasts, By Technology (2020-2032) (USD Billion)
10.4.12.3 Australia Location-Based Entertainment Market Estimates and Forecasts, By End-use (2020-2032) (USD Billion)
10.4.13 Rest of Asia Pacific
10.4.13.1 Rest of Asia Pacific Location-Based Entertainment Market Estimates and Forecasts, By Component Type (2020-2032) (USD Billion)
10.4.13.2 Rest of Asia Pacific Location-Based Entertainment Market Estimates and Forecasts, By Technology (2020-2032) (USD Billion)
10.4.13.3 Rest of Asia Pacific Location-Based Entertainment Market Estimates and Forecasts, By End-use (2020-2032) (USD Billion)
10.5 Middle East and Africa
10.5.1 Middle East
10.5.1.1 Trends Analysis
10.5.1.2 Middle East Location-Based Entertainment Market Estimates and Forecasts, by Country (2020-2032) (USD Billion)
10.5.1.3 Middle East Location-Based Entertainment Market Estimates and Forecasts, By Component Type (2020-2032) (USD Billion)
10.5.1.4 Middle East Location-Based Entertainment Market Estimates and Forecasts, By Technology (2020-2032) (USD Billion)
10.5.1.5 Middle East Location-Based Entertainment Market Estimates and Forecasts, By End-use (2020-2032) (USD Billion)
10.5.1.6 UAE
10.5.1.6.1 UAE Location-Based Entertainment Market Estimates and Forecasts, By Component Type (2020-2032) (USD Billion)
10.5.1.6.2 UAE Location-Based Entertainment Market Estimates and Forecasts, By Technology (2020-2032) (USD Billion)
10.5.1.6.3 UAE Location-Based Entertainment Market Estimates and Forecasts, By End-use (2020-2032) (USD Billion)
10.5.1.7 Egypt
10.5.1.7.1 Egypt Location-Based Entertainment Market Estimates and Forecasts, By Component Type (2020-2032) (USD Billion)
10.5.1.7.2 Egypt Location-Based Entertainment Market Estimates and Forecasts, By Technology (2020-2032) (USD Billion)
10.5.1.7.3 Egypt Location-Based Entertainment Market Estimates and Forecasts, By End-use (2020-2032) (USD Billion)
10.5.1.8 Saudi Arabia
10.5.1.8.1 Saudi Arabia Location-Based Entertainment Market Estimates and Forecasts, By Component Type (2020-2032) (USD Billion)
10.5.1.8.2 Saudi Arabia Location-Based Entertainment Market Estimates and Forecasts, By Technology (2020-2032) (USD Billion)
10.5.1.8.3 Saudi Arabia Location-Based Entertainment Market Estimates and Forecasts, By End-use (2020-2032) (USD Billion)
10.5.1.9 Qatar
10.5.1.9.1 Qatar Location-Based Entertainment Market Estimates and Forecasts, By Component Type (2020-2032) (USD Billion)
10.5.1.9.2 Qatar Location-Based Entertainment Market Estimates and Forecasts, By Technology (2020-2032) (USD Billion)
10.5.1.9.3 Qatar Location-Based Entertainment Market Estimates and Forecasts, By End-use (2020-2032) (USD Billion)
10.5.1.10 Rest of Middle East
10.5.1.10.1 Rest of Middle East Location-Based Entertainment Market Estimates and Forecasts, By Component Type (2020-2032) (USD Billion)
10.5.1.10.2 Rest of Middle East Location-Based Entertainment Market Estimates and Forecasts, By Technology (2020-2032) (USD Billion)
10.5.1.10.3 Rest of Middle East Location-Based Entertainment Market Estimates and Forecasts, By End-use (2020-2032) (USD Billion)
10.5.2 Africa
10.5.2.1 Trends Analysis
10.5.2.2 Africa Location-Based Entertainment Market Estimates and Forecasts, by Country (2020-2032) (USD Billion)
10.5.2.3 Africa Location-Based Entertainment Market Estimates and Forecasts, By Component Type (2020-2032) (USD Billion)
10.5.2.4 Africa Location-Based Entertainment Market Estimates and Forecasts, By Technology (2020-2032) (USD Billion)
10.5.2.5 Africa Location-Based Entertainment Market Estimates and Forecasts, By End-use (2020-2032) (USD Billion)
10.5.2.6 South Africa
10.5.2.6.1 South Africa Location-Based Entertainment Market Estimates and Forecasts, By Component Type (2020-2032) (USD Billion)
10.5.2.6.2 South Africa Location-Based Entertainment Market Estimates and Forecasts, By Technology (2020-2032) (USD Billion)
10.5.2.6.3 South Africa Location-Based Entertainment Market Estimates and Forecasts, By End-use (2020-2032) (USD Billion)
10.5.2.7 Nigeria
10.5.2.7.1 Nigeria Location-Based Entertainment Market Estimates and Forecasts, By Component Type (2020-2032) (USD Billion)
10.5.2.7.2 Nigeria Location-Based Entertainment Market Estimates and Forecasts, By Technology (2020-2032) (USD Billion)
10.5.2.7.3 Nigeria Location-Based Entertainment Market Estimates and Forecasts, By End-use (2020-2032) (USD Billion)
10.5.2.8 Rest of Africa
10.5.2.8.1 Rest of Africa Location-Based Entertainment Market Estimates and Forecasts, By Component Type (2020-2032) (USD Billion)
10.5.2.8.2 Rest of Africa Location-Based Entertainment Market Estimates and Forecasts, By Technology (2020-2032) (USD Billion)
10.5.2.8.3 Rest of Africa Location-Based Entertainment Market Estimates and Forecasts, By End-use (2020-2032) (USD Billion)
10.6 Latin America
10.6.1 Trends Analysis
10.6.2 Latin America Location-Based Entertainment Market Estimates and Forecasts, by Country (2020-2032) (USD Billion)
10.6.3 Latin America Location-Based Entertainment Market Estimates and Forecasts, By Component Type (2020-2032) (USD Billion)
10.6.4 Latin America Location-Based Entertainment Market Estimates and Forecasts, By Technology (2020-2032) (USD Billion)
10.6.5 Latin America Location-Based Entertainment Market Estimates and Forecasts, By End-use (2020-2032) (USD Billion)
10.6.6 Brazil
10.6.6.1 Brazil Location-Based Entertainment Market Estimates and Forecasts, By Component Type (2020-2032) (USD Billion)
10.6.6.2 Brazil Location-Based Entertainment Market Estimates and Forecasts, By Technology (2020-2032) (USD Billion)
10.6.6.3 Brazil Location-Based Entertainment Market Estimates and Forecasts, By End-use (2020-2032) (USD Billion)
10.6.7 Argentina
10.6.7.1 Argentina Location-Based Entertainment Market Estimates and Forecasts, By Component Type (2020-2032) (USD Billion)
10.6.7.2 Argentina Location-Based Entertainment Market Estimates and Forecasts, By Technology (2020-2032) (USD Billion)
10.6.7.3 Argentina Location-Based Entertainment Market Estimates and Forecasts, By End-use (2020-2032) (USD Billion)
10.6.8 Colombia
10.6.8.1 Colombia Location-Based Entertainment Market Estimates and Forecasts, By Component Type (2020-2032) (USD Billion)
10.6.8.2 Colombia Location-Based Entertainment Market Estimates and Forecasts, By Technology (2020-2032) (USD Billion)
10.6.8.3 Colombia Location-Based Entertainment Market Estimates and Forecasts, By End-use (2020-2032) (USD Billion)
10.6.9 Rest of Latin America
10.6.9.1 Rest of Latin America Location-Based Entertainment Market Estimates and Forecasts, By Component Type (2020-2032) (USD Billion)
10.6.9.2 Rest of Latin America Location-Based Entertainment Market Estimates and Forecasts, By Technology (2020-2032) (USD Billion)
10.6.9.3 Rest of Latin America Location-Based Entertainment Market Estimates and Forecasts, By End-use (2020-2032) (USD Billion)
11. Company Profiles
11.1 The VOID
11.1.1 Company Overview
11.1.2 Financial
11.1.3 Products/ Services Offered
11.1.4 SWOT Analysis
11.2 Dreamscape Immersive
11.2.1 Company Overview
11.2.2 Financial
11.2.3 Products/ Services Offered
11.2.4 SWOT Analysis
11.3 Spaces, Inc.
11.3.1 Company Overview
11.3.2 Financial
11.3.3 Products/ Services Offered
11.3.4 SWOT Analysis
11.4 Zero Latency
11.4.1 Company Overview
11.4.2 Financial
11.4.3 Products/ Services Offered
11.4.4 SWOT Analysis
11.5 Tyffon Inc.
11.5.1 Company Overview
11.5.2 Financial
11.5.3 Products/ Services Offered
11.5.4 SWOT Analysis
11.6 Hologate
11.6.1 Company Overview
11.6.2 Financial
11.6.3 Products/ Services Offered
11.6.4 SWOT Analysis
11.7 Illuminarium Experiences
11.7.1 Company Overview
11.7.2 Financial
11.7.3 Products/ Services Offered
11.7.4 SWOT Analysis
11.8 Nomadic
11.8.1 Company Overview
11.8.2 Financial
11.8.3 Products/ Services Offered
11.8.4 SWOT Analysis
11.9 Holovis International Ltd.
11.9.1 Company Overview
11.9.2 Financial
11.9.3 Products/ Services Offered
11.9.4 SWOT Analysis
11.10 VRstudios.
11.10.1 Company Overview
11.10.2 Financial
11.10.3 Products/ Services Offered
11.10.4 SWOT Analysis
12. Use Cases and Best Practices
13. Conclusion
An accurate research report requires proper strategizing as well as implementation. There are multiple factors involved in the completion of good and accurate research report and selecting the best methodology to compete the research is the toughest part. Since the research reports we provide play a crucial role in any company’s decision-making process, therefore we at SNS Insider always believe that we should choose the best method which gives us results closer to reality. This allows us to reach at a stage wherein we can provide our clients best and accurate investment to output ratio.
Each report that we prepare takes a timeframe of 350-400 business hours for production. Starting from the selection of titles through a couple of in-depth brain storming session to the final QC process before uploading our titles on our website we dedicate around 350 working hours. The titles are selected based on their current market cap and the foreseen CAGR and growth.
The 5 steps process:
Step 1: Secondary Research:
Secondary Research or Desk Research is as the name suggests is a research process wherein, we collect data through the readily available information. In this process we use various paid and unpaid databases which our team has access to and gather data through the same. This includes examining of listed companies’ annual reports, Journals, SEC filling etc. Apart from this our team has access to various associations across the globe across different industries. Lastly, we have exchange relationships with various university as well as individual libraries.

Step 2: Primary Research
When we talk about primary research, it is a type of study in which the researchers collect relevant data samples directly, rather than relying on previously collected data. This type of research is focused on gaining content specific facts that can be sued to solve specific problems. Since the collected data is fresh and first hand therefore it makes the study more accurate and genuine.
We at SNS Insider have divided Primary Research into 2 parts.
Part 1 wherein we interview the KOLs of major players as well as the upcoming ones across various geographic regions. This allows us to have their view over the market scenario and acts as an important tool to come closer to the accurate market numbers. As many as 45 paid and unpaid primary interviews are taken from both the demand and supply side of the industry to make sure we land at an accurate judgement and analysis of the market.
This step involves the triangulation of data wherein our team analyses the interview transcripts, online survey responses and observation of on filed participants. The below mentioned chart should give a better understanding of the part 1 of the primary interview.

Part 2: In this part of primary research the data collected via secondary research and the part 1 of the primary research is validated with the interviews from individual consultants and subject matter experts.
Consultants are those set of people who have at least 12 years of experience and expertise within the industry whereas Subject Matter Experts are those with at least 15 years of experience behind their back within the same space. The data with the help of two main processes i.e., FGDs (Focused Group Discussions) and IDs (Individual Discussions). This gives us a 3rd party nonbiased primary view of the market scenario making it a more dependable one while collation of the data pointers.
Step 3: Data Bank Validation
Once all the information is collected via primary and secondary sources, we run that information for data validation. At our intelligence centre our research heads track a lot of information related to the market which includes the quarterly reports, the daily stock prices, and other relevant information. Our data bank server gets updated every fortnight and that is how the information which we collected using our primary and secondary information is revalidated in real time.

Step 4: QA/QC Process
After all the data collection and validation our team does a final level of quality check and quality assurance to get rid of any unwanted or undesired mistakes. This might include but not limited to getting rid of the any typos, duplication of numbers or missing of any important information. The people involved in this process include technical content writers, research heads and graphics people. Once this process is completed the title gets uploader on our platform for our clients to read it.
Step 5: Final QC/QA Process:
This is the last process and comes when the client has ordered the study. In this process a final QA/QC is done before the study is emailed to the client. Since we believe in giving our clients a good experience of our research studies, therefore, to make sure that we do not lack at our end in any way humanly possible we do a final round of quality check and then dispatch the study to the client.
Key Segments:
By Component Type
Hardware
Software
By Technology
2 Dimensional (2D)
3 Dimensional (3D)
Cloud Merged Reality
By End-use
Amusement Parks
Arcade Studios
4D films
Request for Segment Customization as per your Business Requirement: Segment Customization Request
REGIONAL COVERAGE:
North America
US
Canada
Mexico
Europe
Eastern Europe
Poland
Romania
Hungary
Turkey
Rest of Eastern Europe
Western Europe
Germany
France
UK
Italy
Spain
Netherlands
Switzerland
Austria
Rest of Western Europe
Asia Pacific
China
India
Japan
South Korea
Vietnam
Singapore
Australia
Rest of Asia Pacific
Middle East & Africa
Middle East
UAE
Egypt
Saudi Arabia
Qatar
Rest of the Middle East
Africa
Nigeria
South Africa
Rest of Africa
Latin America
Brazil
Argentina
Colombia
Rest of Latin America
Request for Country Level Research Report: Country Level Customization Request
Available Customization
With the given market data, SNS Insider offers customization as per the company’s specific needs. The following customization options are available for the report:
Product Analysis
Criss-Cross segment analysis (e.g. Product X Application)
Product Matrix which gives a detailed comparison of product portfolio of each company
Geographic Analysis
Additional countries in any of the regions
Company Information
Detailed analysis and profiling of additional market players (Up to five)
Business Rules Management System Market was valued at USD 1.48 billion in 2023 and is expected to reach USD 3.35 billion by 2032, growing at a CAGR of 9.52% from 2024-2032.
Attack Surface Management Market was valued at USD 858.97 million in 2023 and will reach USD 8247.40 million by 2032, growing at a CAGR of 28.60% by 2032
The Generative AI Market Size was valued at USD 20.21 Billion in 2023 and is expected to reach USD 440 Billion by 2032 and grow at a CAGR of 41.31% over the forecast period 2024-2032.
Data Historian Market was worth USD 1.29 billion in 2023 and is predicted to be worth USD 2.26 billion by 2032, growing at a CAGR of 6.54% between 2024 and 2032.
The Modular Data Center Market was valued at USD 25.3 Billion in 2023 and is expected to reach USD 111.3 Billion by 2032, growing at a CAGR of 17.93% by 2032.
5G Tester Market was valued at USD 3.45 billion in 2023 and is expected to reach USD 7.05 billion by 2032, growing at a CAGR of 8.29% from 2024-2032.

Hi! Click one of our member below to chat on Phone
© 2025 All Rights Reserved by SNS Insider Pvt Ltd


