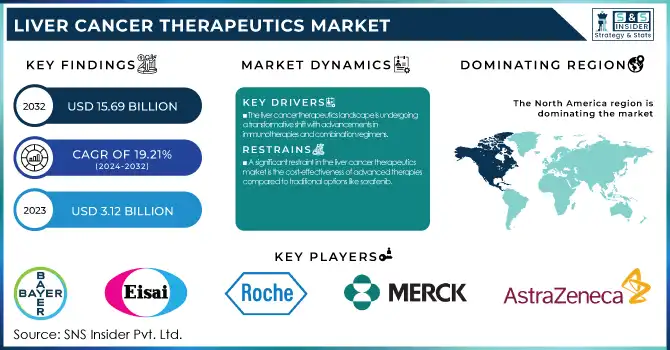
The Liver Cancer Therapeutics Market was valued at USD 3.12 billion in 2023 and is expected to reach USD 15.69 billion by 2032, growing at a CAGR of 19.21% from 2024-2032.
To get more information on Liver Cancer Therapeutics Market - Request Free Sample Report
The liver cancer therapeutics market is expected to drive in upcoming years, which will support the growth of the industry in the long run. According to NCBI, Liver cancer is still one of the most common malignancies in the world, accounting for an estimated 905,677 incident cases and 830,180 deaths globally in 2023 (Global Cancer Observatory). For liver cancer, chronic hepatitis B and C infections as well as alcohol and non-alcoholic fatty liver disease are emerging to be the burden of disease. Liver cancer is the sixth-commonest cancer worldwide. The number of newly diagnosed primary liver cancer cases from 2020-2040 is anticipated to rise sharply; an estimated 1.4 million new diagnoses are projected by 2040.
There have been significant advances in therapeutic approaches for liver cancer in recent years. Conversely, targeted therapies, including sorafenib and lenvatinib, remain important in the management of advanced HCC. First-line treatment has been transformed with the advent of immune checkpoint inhibitors such as mepolizumab-bevacizumab (Tecentriq), which provide superior survival relative to conventional therapies. Combination strategies combining targeted and immune-based therapies are entering popular use supported by clinical benefits and improved patient outcomes.
Moreover, 2023 saw the FDA’s accelerated approvals of agents like durvalumab and tremelimumab (Imjudo), which have both increased the resources available for unresectable liver cancer, mirroring a trend toward tailored medicine. Molecular diagnostics innovation allows better patient stratification identification and actionable biomarker discovery, which increases treatment precision.
The market is primed for transformational growth as current clinical trials investigating next-generation therapies such as CAR-T cells and bispecific antibodies are slated to reshape the treatment landscape for liver cancer.
Drivers
The liver cancer therapeutics landscape is undergoing a transformative shift with advancements in immunotherapies and combination regimens.
Immunotherapies and combination regimens are redefining the liver cancer therapeutics landscape. Combined immune checkpoint inhibitors, including atezolizumab and nivolumab, have led to considerable improvements in survival, with studies demonstrating a median overall survival of 19.2 months in patients receiving the atezolizumab-bevacizumab combination versus 13.4 months in traditional sorafenib therapy. These therapies are now the standard first-line therapies for advanced hepatocellular carcinoma (HCC). 2023 brought the FDA approval of durvalumab and tremelimumab (Imjudo) another milestone was reached in the treatment of unresectable liver cancer.
Additionally, combination therapies combining immunotherapies with tyrosine kinase inhibitors (TKIs) such as lenvatinib or monoclonal antibodies such as bevacizumab have shown better efficacy, overcoming obstacles of resistance and disease progression. The expanding pipeline of clinical trials—including well-studied candidates for CAR-T cell therapies and bispecific antibodies—reflects the biopharmaceutical industry’s desire to use next-generation technologies to elicit responses in more patients and build longer-term survival.
The growing number of regulatory approvals and the launch of innovative therapies are propelling the liver cancer therapeutics market forward.
Key factors propelling growth of the liver cancer therapeutics market include an increase in the number of regulatory approvals and launches of innovative therapies in the last few years, several new drugs have been approved for the disease, expanding treatment options for patients with hepatocellular carcinoma (HCC). Pivotal shifts such as the FDA approval of atezolizumab-bevacizumab (Tecentriq) — which significantly outperformed the standard of care in advanced liver cancer laps 10 years after sorafenib that required months of careful communication and consultation.
More recently, the approval of durvalumab-tremelimumab (Imjudo) for unresectable HCC in 2023 demonstrates that combination therapies are playing a vital approach targeting multiple pathways to improve outcomes in patients. That industry commitment to advancing therapy is reflected in the recent rapid expansion of the therapeutic pipeline, with promising candidates such as cabozantinib, tislelizumab, and next-generation CAR-T therapies.
Combined with accelerated approval pathways, particularly in the United States, Europe, and Japan, these advancements have shortened the time-to-market for life-saving drugs. These developments are fulfilling the increasing need for advanced therapy and wider access to new treatments across the globe, catering to market expansion.
Restraint
A significant restraint in the liver cancer therapeutics market is the cost-effectiveness of advanced therapies compared to traditional options like sorafenib.
High cost of novel therapies vs competitors (sorafenib), ex: entrectinib and ibrutinib. Recent studies have shown that therapies, such as lenvatinib, sintilimab plus bevacizumab, and atezolizumab plus bevacizumab, are associated with high incremental cost-effectiveness ratios (ICERs) per quality-adjusted life years (QALYs) gained. In the case of example, the ICER for lenvatinib is USD 188,625.25 per QALY gained and for atezolizumab in combination with bevacizumab is USD144,513.71 in QALY gained, both well above the commonly held threshold for cost-effectiveness of US$36,600/QALY.
Healthcare Economic Model: This evidence suggests that while advanced therapies offer clinical advantages, their high costs may result in reduced access and overall unsustainability within most healthcare systems. The results indicate that sorafenib is more cost-effective than ramucirumab, with a cost-effectiveness probability of 100% at the threshold; thus, sorafenib is a more reasonable choice in terms of expenditure, especially in areas with few medical resources.
Moreover, cost-effectiveness results are highly sensitive to variables such as medical insurance reimbursement ratios and medicine pricing (even within a brand). Areas where drug prices are high or insurance coverage is low have even greater challenges adopting these advanced therapies, resulting in growing disparities in access to optimal care.
By Therapy
The targeted therapy segment dominated the market with a market share of 56% in 2023, owing to targeted therapy's ability to haven't targeted molecule or pathway responsible for tumor growth and spread. This strategy has less impact on normal cells, thereby minimizing side effects and improving patient outcomes. Targeted therapies, for example, have had promising results in maintaining controlled tumor size and increasing survival rates in liver cancer.
The immunotherapy segment is expected to grow at the fastest CAGR of 21.68% from 2024 to 2032. The immune system to target and kill cancer cells via immunotherapy has heralded a paradigm shift in liver cancer treatment, as the effect has provided significant hope resulting in increased uptake of this treatment modality with greater investment into furthering such treatment options.
Drug Type
The Hepatocellular Carcinoma (HCC) segment dominated the market and accounted for the highest market share of 38% in the liver cancer drug market in 2023. HCC is the most frequent type of primary liver cancer and has a high prevalence and mortality rates, thus off for many research and development efforts to identify effective treatments. HCC is hard to treat, and available treatment options are limited, so companies are investing sizeable resources in the development of new and better drugs. Moreover, rising awareness and early diagnosis of liver cancer facilitate timely treatment, thereby contributing to the growth of the HCC treatment market.
The Hepatoblastoma segment is projected to grow at the fastest rate in the liver cancer therapeutics market owing to the rising incidence of the disease and advancements in treatment options. Hepatoblastoma is a rare, aggressive liver cancer that occurs in patients predominantly in the pediatric population; as awareness of hepatoblastoma has increased over the years, early diagnosis has allowed for improved treatment and outcomes for affected children. Cancer survivability has improved with developments in chemotherapy, surgery, and liver transplantation, leading to an increasingly urgent need for these specialty agents. In addition, constant studies on new targeted therapies and immunotherapy against hepatoblastoma are driving the segment's growth. Additionally, the Hepatoblastoma segment is growing very rapidly and is one of the fast-growing segments in the liver cancer therapeutics market, supported by the rise in the awareness level on the individual stage, growing diagnostic tools that help in its early diagnosis, treatment options, such as surgery and chemotherapy.
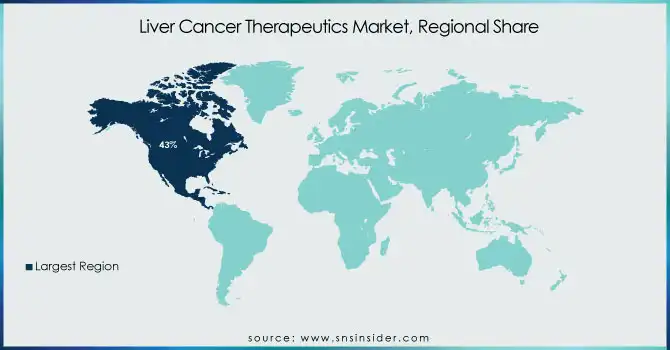
North America dominated the market with a market share of 43%. The growth of the liver cancer therapeutics market in North America can be attributed to several factors. With state-of-the-art healthcare infrastructure, such as specialized health facilities, and the availability of qualified personnel, the area is equipped to carry out the rapid development, approval, and distribution of these liver cancer treatments. North America also has the largest number of leading pharmaceutical and biotech companies including Bayer, Merck, and Bristol-Myers Squibb actively working on liver cancer therapies and innovation and clinical research. Also, a high prevalence of liver cancer due to risk factors such as hepatitis and obesity further supports the need for effective treatments. Owing to early detection and insurance of good healthcare systems, the accessibility of treatment is easier. The well-established research and development platform in North America, backed by government funding, facilitates the development of new therapies and confirms the region’s dominance in the global liver cancer therapeutics market
Asia-Pacific is experiencing the fastest growth with a CAGR of 22.73% in the liver cancer therapeutics market. The region is a high-endemicity area for liver cancer with high-risk factors facing countries (e.g., chronic hepatitis B and hepatitis C infection, high alcohol consumption, and dietary habits), especially in China and Japan. When early detection and diagnosis become available, the need for effective treatments will increase as healthcare infrastructure continues to develop. The region is also observing vast investments in pharmaceutical R&D, where global players and local companies are developing liver cancer therapies targeting the needs of the Asian populations. The growing healthcare spending, increasing access to treatments, and awareness about liver cancer and its treatment in the Asia Pacific region propel the market's rapid growth.
Need any customization research on Liver Cancer Therapeutics Market - Enquiry Now
Key Players
Bayer AG (Nexavar (sorafenib), Stivarga (regorafenib))
Eisai Co., Ltd. (Lenvima (lenvatinib), Halaven (eribulin))
Roche Holding AG (Tecentriq (atezolizumab), Avastin (bevacizumab))
Merck & Co., Inc. (Keytruda (pembrolizumab), Lenvima (lenvatinib))
AstraZeneca (Imfinzi (durvalumab), Tremelimumab)
Bristol-Myers Squibb (Opdivo (nivolumab), Yervoy (ipilimumab))
Pfizer Inc. (Inlyta (axitinib), Sutent (sunitinib))
Exelixis, Inc. (Cabometyx (cabozantinib), Cometriq (cabozantinib))
Eli Lilly and Company (Cyramza (ramucirumab), Verzenio (abemaciclib))
Novartis AG (Afinitor (everolimus), Zykadia (ceritinib))
Sanofi (Zaltrap (ziv-aflibercept), Thymoglobulin)
Gilead Sciences, Inc. (Hepcludex (bulevirtide), GS-5745)
BeiGene, Ltd. (Tislelizumab, Pamiparib)
Regeneron Pharmaceuticals, Inc. (Libtayo (cemiplimab), REGN4659)
Amgen Inc. (Blincyto (blinatumomab), AMG 510 (sotorasib))
F. Hoffmann-La Roche Ltd. (Erivedge (vismodegib), Kadcyla (trastuzumab emtansine))
Ipsen (Onivyde (irinotecan liposome injection), Somatuline Depot (lanreotide)
Hutchmed (Surufatinib, Fruquintinib)
Can-Fite BioPharma (Namodenoson (CF102), CF602)
Zymeworks Inc. (ZW25 (zanidatamab), ZW49)
Recent Developments
August 2024 – Bristol Myers Squibb announced that the U.S. Food and Drug Administration (FDA) has accepted a supplemental Biologics License Application (sBLA) for Opdivo (nivolumab) in combination with Yervoy (ipilimumab) as a potential first-line treatment for adults with unresectable hepatocellular carcinoma (HCC). This decision is based on findings from the Phase 3 CheckMate -9DW trial. The FDA has set a Prescription Drug User Fee Act (PDUFA) target date of April 21, 2025.
April 2023 – Roche reported new data from the Phase III IMbrave050 study. Results show that Tecentriq (atezolizumab) combined with Avastin (bevacizumab) significantly improved recurrence-free survival (RFS) in patients with hepatocellular carcinoma (HCC) at high risk of recurrence following liver resection or ablation with curative intent.
| Report Attributes | Details |
|---|---|
| Market Size in 2023 | US$ 3.12 Billion |
| Market Size by 2032 | US$ 15.69 Billion |
| CAGR | CAGR of 19.21% From 2024 to 2032 |
| Base Year | 2023 |
| Forecast Period | 2024-2032 |
| Historical Data | 2020-2022 |
| Report Scope & Coverage | Market Size, Segments Analysis, Competitive Landscape, Regional Analysis, DROC & SWOT Analysis, Forecast Outlook |
| Key Segments | • By Therapy (Targeted Therapy, Immunotherapy, Chemotherapy) • By Type (Hepatocellular Carcinoma, Cholangio Carcinoma, Hepatoblastoma, Others) • By Distribution Channel (Hospital Pharmacy, Retail Pharmacy, Online Pharmacy) |
| Regional Analysis/Coverage | North America (US, Canada, Mexico), Europe (Eastern Europe [Poland, Romania, Hungary, Turkey, Rest of Eastern Europe] Western Europe] Germany, France, UK, Italy, Spain, Netherlands, Switzerland, Austria, Rest of Western Europe]), Asia Pacific (China, India, Japan, South Korea, Vietnam, Singapore, Australia, Rest of Asia Pacific), Middle East & Africa (Middle East [UAE, Egypt, Saudi Arabia, Qatar, Rest of Middle East], Africa [Nigeria, South Africa, Rest of Africa], Latin America (Brazil, Argentina, Colombia, Rest of Latin America) |
| Company Profiles | Bayer AG, Eisai Co., Ltd., Roche Holding AG, Merck & Co., Inc., AstraZeneca, Bristol-Myers Squibb, Pfizer Inc., Exelixis, Inc., Eli Lilly and Company, Novartis AG, Sanofi, Gilead Sciences, Inc., BeiGene, Ltd., Regeneron Pharmaceuticals, Inc., Amgen Inc., F. Hoffmann-La Roche Ltd., Ipsen, Hutchmed, Can-Fite BioPharma, Zymeworks Inc., and other player |
| Key Drivers | •The liver cancer therapeutics landscape is undergoing a transformative shift with advancements in immunotherapies and combination regimens. •The growing number of regulatory approvals and the launch of innovative therapies are propelling the liver cancer therapeutics market forward. |
| Restraints | •A significant restraint in the liver cancer therapeutics market is the cost-effectiveness of advanced therapies compared to traditional options like sorafenib. |
Ans: The market for Liver Cancer Therapeutics is expected to grow at a 20.3% CAGR.
Ans: The market for Liver Cancer Therapeutics was worth USD 3.62 billion in 2023 and is expected to increase to USD 19.13 billion by 2032.
Ans: The rising prevalence of liver cancer, rising incidence of hepatitis B infection in emerging countries, and increased R&D efforts and improvement in cancer treatments are the primary drivers driving the worldwide liver cancer therapeutics market's growth.
Ans: The market is divided into three sections: kind, therapy, and region.
Ans: The high cost and negative effects of several liver cancer medicines, as well as restrictions in treatment alternatives with other therapies in the clinical trial stage, are expected to stymie market expansion.
1. Introduction
1.1 Market Definition
1.2 Scope (Inclusion and Exclusions)
1.3 Research Assumptions
2. Executive Summary
2.1 Market Overview
2.2 Regional Synopsis
2.3 Competitive Summary
3. Research Methodology
3.1 Top-Down Approach
3.2 Bottom-up Approach
3.3. Data Validation
3.4 Primary Interviews
4. Market Dynamics Impact Analysis
4.1 Market Driving Factors Analysis
4.1.1 Drivers
4.1.2 Restraints
4.1.3 Opportunities
4.1.4 Challenges
4.2 PESTLE Analysis
4.3 Porter’s Five Forces Model
5. Statistical Insights and Trends Reporting
5.1 Incidence and Prevalence of Liver Cancer (2023)
5.2 Drug Volume by Region (2020-2032)
5.3 Healthcare Spending by Region (2023)
5.4 Patient Outcomes and Survival Rates (2023)
5.5 Regional Analysis of Treatment Accessibility and Adoption (2023)
6. Competitive Landscape
6.1 List of Major Companies, By Region
6.2 Market Share Analysis, By Region
6.3 Product Benchmarking
6.3.1 Product specifications and features
6.3.2 Pricing
6.4 Strategic Initiatives
6.4.1 Marketing and promotional activities
6.4.2 Distribution and Supply Chain Strategies
6.4.3 Expansion plans and new product launches
6.4.4 Strategic partnerships and collaborations
6.5 Technological Advancements
6.6 Market Positioning and Branding
7. Liver Cancer Therapeutics Market Segmentation by Therapy
7.1 Chapter Overview
7.2 Targeted Therapy
7.2.1 Targeted Therapy Market Trends Analysis (2020-2032)
7.2.2 Targeted Therapy Market Size Estimates and Forecasts to 2032 (USD Million)
7.3 Immunotherapy
7.3.1 Immunotherapy Market Trends Analysis (2020-2032)
7.3.2 Immunotherapy Market Size Estimates and Forecasts to 2032 (USD Million)
7.4 Chemotherapy
7.4.1 Chemotherapy Market Trends Analysis (2020-2032)
7.4.2 Chemotherapy Market Size Estimates and Forecasts to 2032 (USD Million)
8. Liver Cancer Therapeutics Market Segmentation, by Type
8.1 Chapter Overview
8.2 Hepatocellular Carcinoma
8.2.1 Hepatocellular Carcinoma Market Trends Analysis (2020-2032)
8.2.2 Hepatocellular Carcinoma Market Size Estimates and Forecasts to 2032 (USD Million)
8.3 Cholangio Carcinoma
8.3.1 Cholangio Carcinoma Market Trends Analysis (2020-2032)
8.3.2 Cholangio Carcinoma Market Size Estimates and Forecasts to 2032 (USD Million)
8.4 Hepatoblastoma
8.4.1 Hepatoblastoma Market Trends Analysis (2020-2032)
8.4.2 Hepatoblastoma Market Size Estimates and Forecasts to 2032 (USD Million)
8.5 Others
8.5.1 Others Market Trends Analysis (2020-2032)
8.5.2 Others Market Size Estimates and Forecasts to 2032 (USD Million)
9. Liver Cancer Therapeutics Market Segmentation, by Distribution Channel
9.1 Chapter Overview
9.2 Hospital Pharmacy
9.2.1 Hospital Pharmacy Market Trends Analysis (2020-2032)
9.2.2 Hospital Pharmacy Market Size Estimates and Forecasts to 2032 (USD Million)
9.3 Retail Pharmacy
9.3.1 Retail Pharmacy Market Trends Analysis (2020-2032)
9.3.2 Retail Pharmacy Market Size Estimates and Forecasts to 2032 (USD Million)
9.4 Online Pharmacy
9.4.1 Online Pharmacy Market Trends Analysis (2020-2032)
9.4.2 Online Pharmacy Market Size Estimates and Forecasts to 2032 (USD Million)
10. Regional Analysis
10.1 Chapter Overview
10.2 North America
10.2.1 Trends Analysis
10.2.2 North America Liver Cancer Therapeutics Market Estimates and Forecasts, by Country (2020-2032) (USD Million)
10.2.3 North America Liver Cancer Therapeutics Market Estimates and Forecasts, by Therapy (2020-2032) (USD Million)
10.2.4 North America Liver Cancer Therapeutics Market Estimates and Forecasts, by Type (2020-2032) (USD Million)
10.2.5 North America Liver Cancer Therapeutics Market Estimates and Forecasts, by Distribution Channel (2020-2032) (USD Million)
10.2.6 USA
10.2.6.1 USA Liver Cancer Therapeutics Market Estimates and Forecasts, by Therapy (2020-2032) (USD Million)
10.2.6.2 USA Liver Cancer Therapeutics Market Estimates and Forecasts, by Type (2020-2032) (USD Million)
10.2.6.3 USA Liver Cancer Therapeutics Market Estimates and Forecasts, by Distribution Channel (2020-2032) (USD Million)
10.2.7 Canada
10.2.7.1 Canada Liver Cancer Therapeutics Market Estimates and Forecasts, by Therapy (2020-2032) (USD Million)
10.2.7.2 Canada Liver Cancer Therapeutics Market Estimates and Forecasts, by Type (2020-2032) (USD Million)
10.2.7.3 Canada Liver Cancer Therapeutics Market Estimates and Forecasts, by Distribution Channel (2020-2032) (USD Million)
10.2.8 Mexico
10.2.8.1 Mexico Liver Cancer Therapeutics Market Estimates and Forecasts, by Therapy (2020-2032) (USD Million)
10.2.8.2 Mexico Liver Cancer Therapeutics Market Estimates and Forecasts, by Type (2020-2032) (USD Million)
10.2.8.3 Mexico Liver Cancer Therapeutics Market Estimates and Forecasts, by Distribution Channel (2020-2032) (USD Million)
10.3 Europe
10.3.1 Eastern Europe
10.3.1.1 Trends Analysis
10.3.1.2 Eastern Europe Liver Cancer Therapeutics Market Estimates and Forecasts, by Country (2020-2032) (USD Million)
10.3.1.3 Eastern Europe Liver Cancer Therapeutics Market Estimates and Forecasts, by Therapy (2020-2032) (USD Million)
10.3.1.4 Eastern Europe Liver Cancer Therapeutics Market Estimates and Forecasts, by Type (2020-2032) (USD Million)
10.3.1.5 Eastern Europe Liver Cancer Therapeutics Market Estimates and Forecasts, by Distribution Channel (2020-2032) (USD Million)
10.3.1.6 Poland
10.3.1.6.1 Poland Liver Cancer Therapeutics Market Estimates and Forecasts, by Therapy (2020-2032) (USD Million)
10.3.1.6.2 Poland Liver Cancer Therapeutics Market Estimates and Forecasts, by Type (2020-2032) (USD Million)
10.3.1.6.3 Poland Liver Cancer Therapeutics Market Estimates and Forecasts, by Distribution Channel (2020-2032) (USD Million)
10.3.1.7 Romania
10.3.1.7.1 Romania Liver Cancer Therapeutics Market Estimates and Forecasts, by Therapy (2020-2032) (USD Million)
10.3.1.7.2 Romania Liver Cancer Therapeutics Market Estimates and Forecasts, by Type (2020-2032) (USD Million)
10.3.1.7.3 Romania Liver Cancer Therapeutics Market Estimates and Forecasts, by Distribution Channel (2020-2032) (USD Million)
10.3.1.8 Hungary
10.3.1.8.1 Hungary Liver Cancer Therapeutics Market Estimates and Forecasts, by Therapy (2020-2032) (USD Million)
10.3.1.8.2 Hungary Liver Cancer Therapeutics Market Estimates and Forecasts, by Type (2020-2032) (USD Million)
10.3.1.8.3 Hungary Liver Cancer Therapeutics Market Estimates and Forecasts, by Distribution Channel (2020-2032) (USD Million)
10.3.1.9 Turkey
10.3.1.9.1 Turkey Liver Cancer Therapeutics Market Estimates and Forecasts, by Therapy (2020-2032) (USD Million)
10.3.1.9.2 Turkey Liver Cancer Therapeutics Market Estimates and Forecasts, by Type (2020-2032) (USD Million)
10.3.1.9.3 Turkey Liver Cancer Therapeutics Market Estimates and Forecasts, by Distribution Channel (2020-2032) (USD Million)
10.3.1.10 Rest of Eastern Europe
10.3.1.10.1 Rest of Eastern Europe Liver Cancer Therapeutics Market Estimates and Forecasts, by Therapy (2020-2032) (USD Million)
10.3.1.10.2 Rest of Eastern Europe Liver Cancer Therapeutics Market Estimates and Forecasts, by Type (2020-2032) (USD Million)
10.3.1.10.3 Rest of Eastern Europe Liver Cancer Therapeutics Market Estimates and Forecasts, by Distribution Channel (2020-2032) (USD Million)
10.3.2 Western Europe
10.3.2.1 Trends Analysis
10.3.2.2 Western Europe Liver Cancer Therapeutics Market Estimates and Forecasts, by Country (2020-2032) (USD Million)
10.3.2.3 Western Europe Liver Cancer Therapeutics Market Estimates and Forecasts, by Therapy (2020-2032) (USD Million)
10.3.2.4 Western Europe Liver Cancer Therapeutics Market Estimates and Forecasts, by Type (2020-2032) (USD Million)
10.3.2.5 Western Europe Liver Cancer Therapeutics Market Estimates and Forecasts, by Distribution Channel (2020-2032) (USD Million)
10.3.2.6 Germany
10.3.2.6.1 Germany Liver Cancer Therapeutics Market Estimates and Forecasts, by Therapy (2020-2032) (USD Million)
10.3.2.6.2 Germany Liver Cancer Therapeutics Market Estimates and Forecasts, by Type (2020-2032) (USD Million)
10.3.2.6.3 Germany Liver Cancer Therapeutics Market Estimates and Forecasts, by Distribution Channel (2020-2032) (USD Million)
10.3.2.7 France
10.3.2.7.1 France Liver Cancer Therapeutics Market Estimates and Forecasts, by Therapy (2020-2032) (USD Million)
10.3.2.7.2 France Liver Cancer Therapeutics Market Estimates and Forecasts, by Type (2020-2032) (USD Million)
10.3.2.7.3 France Liver Cancer Therapeutics Market Estimates and Forecasts, by Distribution Channel (2020-2032) (USD Million)
10.3.2.8 UK
10.3.2.8.1 UK Liver Cancer Therapeutics Market Estimates and Forecasts, by Therapy (2020-2032) (USD Million)
10.3.2.8.2 UK Liver Cancer Therapeutics Market Estimates and Forecasts, by Type (2020-2032) (USD Million)
10.3.2.8.3 UK Liver Cancer Therapeutics Market Estimates and Forecasts, by Distribution Channel (2020-2032) (USD Million)
10.3.2.9 Italy
10.3.2.9.1 Italy Liver Cancer Therapeutics Market Estimates and Forecasts, by Therapy (2020-2032) (USD Million)
10.3.2.9.2 Italy Liver Cancer Therapeutics Market Estimates and Forecasts, by Type (2020-2032) (USD Million)
10.3.2.9.3 Italy Liver Cancer Therapeutics Market Estimates and Forecasts, by Distribution Channel (2020-2032) (USD Million)
10.3.2.10 Spain
10.3.2.10.1 Spain Liver Cancer Therapeutics Market Estimates and Forecasts, by Therapy (2020-2032) (USD Million)
10.3.2.10.2 Spain Liver Cancer Therapeutics Market Estimates and Forecasts, by Type (2020-2032) (USD Million)
10.3.2.10.3 Spain Liver Cancer Therapeutics Market Estimates and Forecasts, by Distribution Channel (2020-2032) (USD Million)
10.3.2.11 Netherlands
10.3.2.11.1 Netherlands Liver Cancer Therapeutics Market Estimates and Forecasts, by Therapy (2020-2032) (USD Million)
10.3.2.11.2 Netherlands Liver Cancer Therapeutics Market Estimates and Forecasts, by Type (2020-2032) (USD Million)
10.3.2.11.3 Netherlands Liver Cancer Therapeutics Market Estimates and Forecasts, by Distribution Channel (2020-2032) (USD Million)
10.3.2.12 Switzerland
10.3.2.12.1 Switzerland Liver Cancer Therapeutics Market Estimates and Forecasts, by Therapy (2020-2032) (USD Million)
10.3.2.12.2 Switzerland Liver Cancer Therapeutics Market Estimates and Forecasts, by Type (2020-2032) (USD Million)
10.3.2.12.3 Switzerland Liver Cancer Therapeutics Market Estimates and Forecasts, by Distribution Channel (2020-2032) (USD Million)
10.3.2.13 Austria
10.3.2.13.1 Austria Liver Cancer Therapeutics Market Estimates and Forecasts, by Therapy (2020-2032) (USD Million)
10.3.2.13.2 Austria Liver Cancer Therapeutics Market Estimates and Forecasts, by Type (2020-2032) (USD Million)
10.3.2.13.3 Austria Liver Cancer Therapeutics Market Estimates and Forecasts, by Distribution Channel (2020-2032) (USD Million)
10.3.2.14 Rest of Western Europe
10.3.2.14.1 Rest of Western Europe Liver Cancer Therapeutics Market Estimates and Forecasts, by Therapy (2020-2032) (USD Million)
10.3.2.14.2 Rest of Western Europe Liver Cancer Therapeutics Market Estimates and Forecasts, by Type (2020-2032) (USD Million)
10.3.2.14.3 Rest of Western Europe Liver Cancer Therapeutics Market Estimates and Forecasts, by Distribution Channel (2020-2032) (USD Million)
10.4 Asia Pacific
10.4.1 Trends Analysis
10.4.2 Asia Pacific Liver Cancer Therapeutics Market Estimates and Forecasts, by Country (2020-2032) (USD Million)
10.4.3 Asia Pacific Liver Cancer Therapeutics Market Estimates and Forecasts, by Therapy (2020-2032) (USD Million)
10.4.4 Asia Pacific Liver Cancer Therapeutics Market Estimates and Forecasts, by Type (2020-2032) (USD Million)
10.4.5 Asia Pacific Liver Cancer Therapeutics Market Estimates and Forecasts, by Distribution Channel (2020-2032) (USD Million)
10.4.6 China
10.4.6.1 China Liver Cancer Therapeutics Market Estimates and Forecasts, by Therapy (2020-2032) (USD Million)
10.4.6.2 China Liver Cancer Therapeutics Market Estimates and Forecasts, by Type (2020-2032) (USD Million)
10.4.6.3 China Liver Cancer Therapeutics Market Estimates and Forecasts, by Distribution Channel (2020-2032) (USD Million)
10.4.7 India
10.4.7.1 India Liver Cancer Therapeutics Market Estimates and Forecasts, by Therapy (2020-2032) (USD Million)
10.4.7.2 India Liver Cancer Therapeutics Market Estimates and Forecasts, by Type (2020-2032) (USD Million)
10.4.7.3 India Liver Cancer Therapeutics Market Estimates and Forecasts, by Distribution Channel (2020-2032) (USD Million)
10.4.8 Japan
10.4.8.1 Japan Liver Cancer Therapeutics Market Estimates and Forecasts, by Therapy (2020-2032) (USD Million)
10.4.8.2 Japan Liver Cancer Therapeutics Market Estimates and Forecasts, by Type (2020-2032) (USD Million)
10.4.8.3 Japan Liver Cancer Therapeutics Market Estimates and Forecasts, by Distribution Channel (2020-2032) (USD Million)
10.4.9 South Korea
10.4.9.1 South Korea Liver Cancer Therapeutics Market Estimates and Forecasts, by Therapy (2020-2032) (USD Million)
10.4.9.2 South Korea Liver Cancer Therapeutics Market Estimates and Forecasts, by Type (2020-2032) (USD Million)
10.4.9.3 South Korea Liver Cancer Therapeutics Market Estimates and Forecasts, by Distribution Channel (2020-2032) (USD Million)
10.4.10 Vietnam
10.4.10.1 Vietnam Liver Cancer Therapeutics Market Estimates and Forecasts, by Therapy (2020-2032) (USD Million)
10.4.10.2 Vietnam Liver Cancer Therapeutics Market Estimates and Forecasts, by Type (2020-2032) (USD Million)
10.4.10.3 Vietnam Liver Cancer Therapeutics Market Estimates and Forecasts, by Distribution Channel (2020-2032) (USD Million)
10.4.11 Singapore
10.4.11.1 Singapore Liver Cancer Therapeutics Market Estimates and Forecasts, by Therapy (2020-2032) (USD Million)
10.4.11.2 Singapore Liver Cancer Therapeutics Market Estimates and Forecasts, by Type (2020-2032) (USD Million)
10.4.11.3 Singapore Liver Cancer Therapeutics Market Estimates and Forecasts, by Distribution Channel (2020-2032) (USD Million)
10.4.12 Australia
10.4.12.1 Australia Liver Cancer Therapeutics Market Estimates and Forecasts, by Therapy (2020-2032) (USD Million)
10.4.12.2 Australia Liver Cancer Therapeutics Market Estimates and Forecasts, by Type (2020-2032) (USD Million)
10.4.12.3 Australia Liver Cancer Therapeutics Market Estimates and Forecasts, by Distribution Channel (2020-2032) (USD Million)
10.4.13 Rest of Asia Pacific
10.4.13.1 Rest of Asia Pacific Liver Cancer Therapeutics Market Estimates and Forecasts, by Therapy (2020-2032) (USD Million)
10.4.13.2 Rest of Asia Pacific Liver Cancer Therapeutics Market Estimates and Forecasts, by Type (2020-2032) (USD Million)
10.4.13.3 Rest of Asia Pacific Liver Cancer Therapeutics Market Estimates and Forecasts, by Distribution Channel (2020-2032) (USD Million)
10.5 Middle East and Africa
10.5.1 Middle East
10.5.1.1 Trends Analysis
10.5.1.2 Middle East Liver Cancer Therapeutics Market Estimates and Forecasts, by Country (2020-2032) (USD Million)
10.5.1.3 Middle East Liver Cancer Therapeutics Market Estimates and Forecasts, by Therapy (2020-2032) (USD Million)
10.5.1.4 Middle East Liver Cancer Therapeutics Market Estimates and Forecasts, by Type (2020-2032) (USD Million)
10.5.1.5 Middle East Liver Cancer Therapeutics Market Estimates and Forecasts, by Distribution Channel (2020-2032) (USD Million)
10.5.1.6 UAE
10.5.1.6.1 UAE Liver Cancer Therapeutics Market Estimates and Forecasts, by Therapy (2020-2032) (USD Million)
10.5.1.6.2 UAE Liver Cancer Therapeutics Market Estimates and Forecasts, by Type (2020-2032) (USD Million)
10.5.1.6.3 UAE Liver Cancer Therapeutics Market Estimates and Forecasts, by Distribution Channel (2020-2032) (USD Million)
10.5.1.7 Egypt
10.5.1.7.1 Egypt Liver Cancer Therapeutics Market Estimates and Forecasts, by Therapy (2020-2032) (USD Million)
10.5.1.7.2 Egypt Liver Cancer Therapeutics Market Estimates and Forecasts, by Type (2020-2032) (USD Million)
10.5.1.7.3 Egypt Liver Cancer Therapeutics Market Estimates and Forecasts, by Distribution Channel (2020-2032) (USD Million)
10.5.1.8 Saudi Arabia
10.5.1.8.1 Saudi Arabia Liver Cancer Therapeutics Market Estimates and Forecasts, by Therapy (2020-2032) (USD Million)
10.5.1.8.2 Saudi Arabia Liver Cancer Therapeutics Market Estimates and Forecasts, by Type (2020-2032) (USD Million)
10.5.1.8.3 Saudi Arabia Liver Cancer Therapeutics Market Estimates and Forecasts, by Distribution Channel (2020-2032) (USD Million)
10.5.1.9 Qatar
10.5.1.9.1 Qatar Liver Cancer Therapeutics Market Estimates and Forecasts, by Therapy (2020-2032) (USD Million)
10.5.1.9.2 Qatar Liver Cancer Therapeutics Market Estimates and Forecasts, by Type (2020-2032) (USD Million)
10.5.1.9.3 Qatar Liver Cancer Therapeutics Market Estimates and Forecasts, by Distribution Channel (2020-2032) (USD Million)
10.5.1.10 Rest of Middle East
10.5.1.10.1 Rest of Middle East Liver Cancer Therapeutics Market Estimates and Forecasts, by Therapy (2020-2032) (USD Million)
10.5.1.10.2 Rest of Middle East Liver Cancer Therapeutics Market Estimates and Forecasts, by Type (2020-2032) (USD Million)
10.5.1.10.3 Rest of Middle East Liver Cancer Therapeutics Market Estimates and Forecasts, by Distribution Channel (2020-2032) (USD Million)
10.5.2 Africa
10.5.2.1 Trends Analysis
10.5.2.2 Africa Liver Cancer Therapeutics Market Estimates and Forecasts, by Country (2020-2032) (USD Million)
10.5.2.3 Africa Liver Cancer Therapeutics Market Estimates and Forecasts, by Therapy (2020-2032) (USD Million)
10.5.2.4 Africa Liver Cancer Therapeutics Market Estimates and Forecasts, by Type (2020-2032) (USD Million)
10.5.2.5 Africa Liver Cancer Therapeutics Market Estimates and Forecasts, by Distribution Channel (2020-2032) (USD Million)
10.5.2.6 South Africa
10.5.2.6.1 South Africa Liver Cancer Therapeutics Market Estimates and Forecasts, by Therapy (2020-2032) (USD Million)
10.5.2.6.2 South Africa Liver Cancer Therapeutics Market Estimates and Forecasts, by Type (2020-2032) (USD Million)
10.5.2.6.3 South Africa Liver Cancer Therapeutics Market Estimates and Forecasts, by Distribution Channel (2020-2032) (USD Million)
10.5.2.7 Nigeria
10.5.2.7.1 Nigeria Liver Cancer Therapeutics Market Estimates and Forecasts, by Therapy (2020-2032) (USD Million)
10.5.2.7.2 Nigeria Liver Cancer Therapeutics Market Estimates and Forecasts, by Type (2020-2032) (USD Million)
10.5.2.7.3 Nigeria Liver Cancer Therapeutics Market Estimates and Forecasts, by Distribution Channel (2020-2032) (USD Million)
10.5.2.8 Rest of Africa
10.5.2.8.1 Rest of Africa Liver Cancer Therapeutics Market Estimates and Forecasts, by Therapy (2020-2032) (USD Million)
10.5.2.8.2 Rest of Africa Liver Cancer Therapeutics Market Estimates and Forecasts, by Type (2020-2032) (USD Million)
10.5.2.8.3 Rest of Africa Liver Cancer Therapeutics Market Estimates and Forecasts, by Distribution Channel (2020-2032) (USD Million)
10.6 Latin America
10.6.1 Trends Analysis
10.6.2 Latin America Liver Cancer Therapeutics Market Estimates and Forecasts, by Country (2020-2032) (USD Million)
10.6.3 Latin America Liver Cancer Therapeutics Market Estimates and Forecasts, by Therapy (2020-2032) (USD Million)
10.6.4 Latin America Liver Cancer Therapeutics Market Estimates and Forecasts, by Type (2020-2032) (USD Million)
10.6.5 Latin America Liver Cancer Therapeutics Market Estimates and Forecasts, by Distribution Channel (2020-2032) (USD Million)
10.6.6 Brazil
10.6.6.1 Brazil Liver Cancer Therapeutics Market Estimates and Forecasts, by Therapy (2020-2032) (USD Million)
10.6.6.2 Brazil Liver Cancer Therapeutics Market Estimates and Forecasts, by Type (2020-2032) (USD Million)
10.6.6.3 Brazil Liver Cancer Therapeutics Market Estimates and Forecasts, by Distribution Channel (2020-2032) (USD Million)
10.6.7 Argentina
10.6.7.1 Argentina Liver Cancer Therapeutics Market Estimates and Forecasts, by Therapy (2020-2032) (USD Million)
10.6.7.2 Argentina Liver Cancer Therapeutics Market Estimates and Forecasts, by Type (2020-2032) (USD Million)
10.6.7.3 Argentina Liver Cancer Therapeutics Market Estimates and Forecasts, by Distribution Channel (2020-2032) (USD Million)
10.6.8 Colombia
10.6.8.1 Colombia Liver Cancer Therapeutics Market Estimates and Forecasts, by Therapy (2020-2032) (USD Million)
10.6.8.2 Colombia Liver Cancer Therapeutics Market Estimates and Forecasts, by Type (2020-2032) (USD Million)
10.6.8.3 Colombia Liver Cancer Therapeutics Market Estimates and Forecasts, by Distribution Channel (2020-2032) (USD Million)
10.6.9 Rest of Latin America
10.6.9.1 Rest of Latin America Liver Cancer Therapeutics Market Estimates and Forecasts, by Therapy (2020-2032) (USD Million)
10.6.9.2 Rest of Latin America Liver Cancer Therapeutics Market Estimates and Forecasts, by Type (2020-2032) (USD Million)
10.6.9.3 Rest of Latin America Liver Cancer Therapeutics Market Estimates and Forecasts, by Distribution Channel (2020-2032) (USD Million)
11. Company Profiles
11.1 Bayer AG
11.1.1 Company Overview
11.1.2 Financial
11.1.3 Products/ Services Offered
11.1.4 SWOT Analysis
11.2 Eisai Co., Ltd.
11.2.1 Company Overview
11.2.2 Financial
11.2.3 Products/ Services Offered
11.2.4 SWOT Analysis
11.3 Roche Holding AG
11.3.1 Company Overview
11.3.2 Financial
11.3.3 Products/ Services Offered
11.3.4 SWOT Analysis
11.4 Merck & Co., Inc.
11.4.1 Company Overview
11.4.2 Financial
11.4.3 Products/ Services Offered
11.4.4 SWOT Analysis
11.5 AstraZeneca
11.5.1 Company Overview
11.5.2 Financial
11.5.3 Products/ Services Offered
11.5.4 SWOT Analysis
11.6 Bristol-Myers Squibb
11.6.1 Company Overview
11.6.2 Financial
11.6.3 Products/ Services Offered
11.6.4 SWOT Analysis
11.7 Pfizer Inc.
11.7.1 Company Overview
11.7.2 Financial
11.7.3 Products/ Services Offered
11.7.4 SWOT Analysis
11.8 Exelixis, Inc.
11.8.1 Company Overview
11.8.2 Financial
11.8.3 Products/ Services Offered
11.8.4 SWOT Analysis
11.9 Eli Lilly and Company
11.9.1 Company Overview
11.9.2 Financial
11.9.3 Products/ Services Offered
11.9.4 SWOT Analysis
11.10 Novartis AG
11.10.1 Company Overview
11.10.2 Financial
11.10.3 Products/ Services Offered
11.10.4 SWOT Analysis
12. Use Cases and Best Practices
13. Conclusion
An accurate research report requires proper strategizing as well as implementation. There are multiple factors involved in the completion of good and accurate research report and selecting the best methodology to compete the research is the toughest part. Since the research reports we provide play a crucial role in any company’s decision-making process, therefore we at SNS Insider always believe that we should choose the best method which gives us results closer to reality. This allows us to reach at a stage wherein we can provide our clients best and accurate investment to output ratio.
Each report that we prepare takes a timeframe of 350-400 business hours for production. Starting from the selection of titles through a couple of in-depth brain storming session to the final QC process before uploading our titles on our website we dedicate around 350 working hours. The titles are selected based on their current market cap and the foreseen CAGR and growth.
The 5 steps process:
Step 1: Secondary Research:
Secondary Research or Desk Research is as the name suggests is a research process wherein, we collect data through the readily available information. In this process we use various paid and unpaid databases which our team has access to and gather data through the same. This includes examining of listed companies’ annual reports, Journals, SEC filling etc. Apart from this our team has access to various associations across the globe across different industries. Lastly, we have exchange relationships with various university as well as individual libraries.

Step 2: Primary Research
When we talk about primary research, it is a type of study in which the researchers collect relevant data samples directly, rather than relying on previously collected data. This type of research is focused on gaining content specific facts that can be sued to solve specific problems. Since the collected data is fresh and first hand therefore it makes the study more accurate and genuine.
We at SNS Insider have divided Primary Research into 2 parts.
Part 1 wherein we interview the KOLs of major players as well as the upcoming ones across various geographic regions. This allows us to have their view over the market scenario and acts as an important tool to come closer to the accurate market numbers. As many as 45 paid and unpaid primary interviews are taken from both the demand and supply side of the industry to make sure we land at an accurate judgement and analysis of the market.
This step involves the triangulation of data wherein our team analyses the interview transcripts, online survey responses and observation of on filed participants. The below mentioned chart should give a better understanding of the part 1 of the primary interview.

Part 2: In this part of primary research the data collected via secondary research and the part 1 of the primary research is validated with the interviews from individual consultants and subject matter experts.
Consultants are those set of people who have at least 12 years of experience and expertise within the industry whereas Subject Matter Experts are those with at least 15 years of experience behind their back within the same space. The data with the help of two main processes i.e., FGDs (Focused Group Discussions) and IDs (Individual Discussions). This gives us a 3rd party nonbiased primary view of the market scenario making it a more dependable one while collation of the data pointers.
Step 3: Data Bank Validation
Once all the information is collected via primary and secondary sources, we run that information for data validation. At our intelligence centre our research heads track a lot of information related to the market which includes the quarterly reports, the daily stock prices, and other relevant information. Our data bank server gets updated every fortnight and that is how the information which we collected using our primary and secondary information is revalidated in real time.

Step 4: QA/QC Process
After all the data collection and validation our team does a final level of quality check and quality assurance to get rid of any unwanted or undesired mistakes. This might include but not limited to getting rid of the any typos, duplication of numbers or missing of any important information. The people involved in this process include technical content writers, research heads and graphics people. Once this process is completed the title gets uploader on our platform for our clients to read it.
Step 5: Final QC/QA Process:
This is the last process and comes when the client has ordered the study. In this process a final QA/QC is done before the study is emailed to the client. Since we believe in giving our clients a good experience of our research studies, therefore, to make sure that we do not lack at our end in any way humanly possible we do a final round of quality check and then dispatch the study to the client.
By Therapy
Targeted Therapy
Immunotherapy
Chemotherapy
By Type
Hepatocellular Carcinoma
Cholangio Carcinoma
Hepatoblastoma
Others
Distribution Chanel
Hospital Pharmacy
Retail Pharmacy
Online Pharmacy
Request for Segment Customization as per your Business Requirement: Segment Customization Request
REGIONAL COVERAGE:
North America
US
Canada
Mexico
Europe
Eastern Europe
Poland
Romania
Hungary
Turkey
Rest of Eastern Europe
Western Europe
Germany
France
UK
Italy
Spain
Netherlands
Switzerland
Austria
Rest of Western Europe
Asia Pacific
China
India
Japan
South Korea
Vietnam
Singapore
Australia
Rest of Asia Pacific
Middle East & Africa
Middle East
UAE
Egypt
Saudi Arabia
Qatar
Rest of the Middle East
Africa
Nigeria
South Africa
Rest of Africa
Latin America
Brazil
Argentina
Colombia
Rest of Latin America
Request for Country Level Research Report: Country Level Customization Request
Available Customization
With the given market data, SNS Insider offers customization to meet the company’s specific needs. The following customization options are available for the report:
Product Analysis
Criss-Cross segment analysis (e.g. Product X Application)
Product Matrix which gives a detailed comparison of the product portfolio of each company
Geographic Analysis
Additional countries in any of the regions
Company Information
Detailed analysis and profiling of additional market players (Up to five)
The Calcium Supplements Market Size was valued at USD 510.00 Million in 2023 and is expected to reach USD 908.83 Million by 2032, growing at a CAGR of 6.63% over the forecast period of 2024-2032.
The Recombinant Proteins Market size was USD 2.5 billion in 2023 and is expected to reach USD 5.0 billion by 2032 with a growing CAGR of 7.6% by 2023-2032.
The Biotech CRO Market Size was valued at USD 68.14 billion in 2023 and is will each USD 114.46 billion by 2032, growing at a CAGR of 5.9% from 2024-2032.
Mesenchymal Stem Cells Market was valued at $ 3.2 billion in 2023 and is estimated to touch $ 9.72 billion by 2032, growing at a CAGR of 13.20% from 2024-2032.
The Data Monetization in Healthcare Market Size was valued at USD 472.7 Million in 2023 and will reach $2169.8 Mn by 2032, with a CAGR of 18.47% over the forecast period of 2024-2032.
Artificial Cervical Disc Market was valued at USD 2.43 Bn in 2023 and is expected to reach USD 8.56 Bn by 2032, growing at a CAGR of 15.10% from 2024 to 2032.

Hi! Click one of our member below to chat on Phone
© 2025 All Rights Reserved by SNS Insider Pvt Ltd


