image

Live Commerce Platforms Market Report, Scope & Overview:

Live Commerce Platforms Market Revenue Analysis

Get More Information on Live Commerce Platforms Market- Request Sample Report

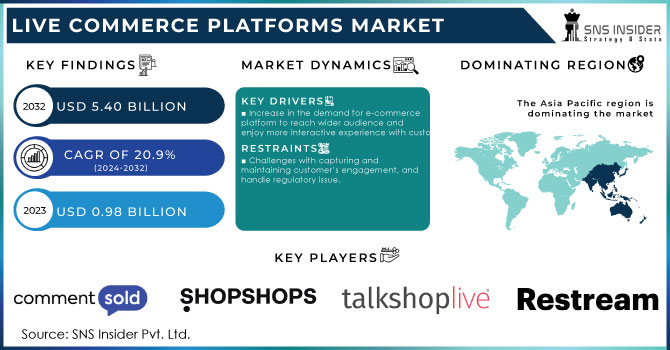
The Live Commerce Platforms Market size was valued at USD 0.98 billion in 2023 & is estimated to surpass USD 5.40 billion by 2032 with a compound annual growth rate of 20.9 % over the forecast period 2024-2032.

The changing trend of customers towards digital shopping, more personalized buying, and easy and efficient payment options, with the adoption of technology and innovation in the business, are the major factors that driving the Live Commerce market. The growing digitization in the business, such as live Fashion shows, online customization markets, live shopping, etc. has given the market, a new way to develop. China is the first country, among the other competitors to gain success in the Live commerce platforms market since 2020, and after the pandemic, they had taken a strong step to rise by combining e-commerce with entertainment. In 2023, the China online streaming E-commerce had earned revenue of more than 45 Trillion Yaun, as people of China spent lots of their time on the e-commerce platform, making videos and connecting people with entertainment as well as selling products, along with the Chinese e-commerce apps are customized according to the customer’s mindset, and people using one app for multiple functions, such as WeChat is used by people for chatting as well as posting product videos for selling.

The development of various online commerce platforms that is trending among the customers, starting from social-media online shopping to other platforms are Facebook, Instagram, Amazon, Alibaba, Shopify, Shopshops, etc. The market study on social media users, who are watching online shopping, the large no. people are targeted in Asia and Indonesia. Facebook has shown the surge in online shopping through social media users with more than 55%, among others. In Addition, Amazon, eBay, AliExpress are the most vising e-commerce Platform, with the most sales are generated by amazon is more than 35%.

Virtual try-ons, product visualisation, interactive product demos, and in-store navigation aids can all serve to increase user engagement through the use of augmented AR/VR for virtual try-ons, AI-enabled personalised suggestions such as Chatbot, Virtual Assistants (for customers support),  and creative interactive elements.Safe internet transactions are also essential to real-time commerce. According to study conducted by the KTH Royal Institute of Technology in Sweden and based on Google's ARCore data, more than 40% of the AR mobile market is currently using mobile AR.

Moreover, with on–going e-commerce self-built platform, content community and traditional social Platform are also shifting the people mindset towards the digitalization. According to study on the content community commerce, 70% of the investment done in this market, as around 80% people on an average buy product based on the reviews of the product.

Market Dynamics

Drivers

  • Increase in the demand for e-commerce platform to reach wider audience and enjoy more interactive experience with customers.

With the rise of affordable internet access, the real-time trading market is a rapidly growing segment of the broader e-commerce industry.Key factors include the rise of social commerce, widespread use of the internet and smartphones, and the growing popularity of social media platforms. The market is also driven by the development of digital technology, influencer marketing, which has accelerated the adoption of online shopping. The Indian government has taken several initiatives to promote e-commerce, such as launching the Digital India program and raising the FDI limit in e-commerce. As like same, in U.S., SBA (small business administration) providing grants to small Business for development, and National Telecommunication and Information Administration (NTIA), a broadband programme, provide internet service to underserved areas to promote e-commerce platform.

Live commerce also enables businesses to create more interactive and engaging shopping experiences with features such as live demos, tutorials and QandA sessions, resulting in higher conversion rates and increased brand appeal.

Restraints

  • Challenges with capturing and maintaining customer’s engagement, and handle regulatory issue.

The online market is booming day-by-day and lots of competitors are evolving daily with their new product and brands along with creative ads which distract the customer’s preference towards their product. The loyal customers of any product or brand also seen shifted towards that, which hampers the market engagement with customers. Also the registration and legal compliances with launching new product to market , needs copyright and trademark, etc. Consume lots of money and time that can be the restraint factor for market growth.

Key Segmentation

By category

Because live commerce offers attractive features and is interactive, the apparel & fashion category sector led the market in 2023, accounting for more than 40 % of the total market share. Collaborations with industry insiders and fashion influencers greatly expanded the audience and affect the live commerce events. In June 2021, the China Internet Network Information Center (CNNIC) released a report stating that there were more than one billion influencers in China. The popularity and reliability of influencers has also drawn the larger audience towards the market and improve the brands perspective. According to the market study on the revenue generated by fashion business through e-commerce is seen to be around $ 400- 500 Million in 2023.

The day-to-day changing fashion trends, with customer’s preference, cultural and social factors with the maintaining sustainability had given the appeal and fashion market to customize the market accordingly. For Instance, the manufacturing of the organic Cotton clothing, bags made up of wood pulp, jewellery made from Bamboo, are some that had established the online platform at next level.

Regional Analysis

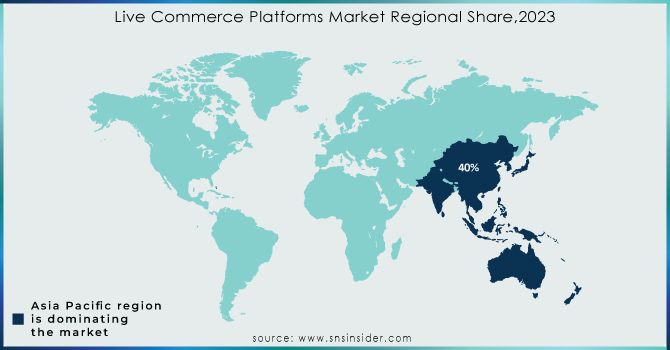
Asia Pacific led the market with more than 40% of the revenue share in 2023. Various other factors have been contributing to the expansion of live e-commerce market. The region demonstrated a high internet penetration rate and wide smartphone adoption, generating many potential clients through social media and other online trading and entertainment platforms. As social media has become a more central part of daily life, they have evolved into almost direct pipelines for live commerce platforms online. Furthermore, shoppers in the country want a more convenient or entertaining shopping experience, something that live commerce models do quite well. The major leading country of the Asia-pacific, “China” is the leader of the B2B business and had marked its presence of more than 75% in the e-commerce market, with large customer’s interaction and also by establishing many small retail- online businesses. Also the adoption of the AI such as augmented reality (AR) and virtual Reality (VR), has enhanced the shopping experience with customers.

Live-Commerce-Platforms-Market-Regional-Share2023

Need any customization research on Live Commerce Platforms Market - Enquiry Now

Key Players

The major key players are CommentSold,  GhostRetail, Inc.,  Firework,  ShopShops,  TalkShopLive, Restream, Inc.,  Bambuser AB,  Livescale, giosg.com Ltd.,  Klarna Bank AB (publ),  Taobao, Jingdong,  Suning, Pinduoduo,  Douyin,  Kuaishou,  Xiaohongshu, Bilibili, Weibo, WeChat, Amazon, and others.


Recent Developments

  • Flipkart has signed MoU with IIT Delhi, and partnership with Foundation for Innovation and Technology Transfer (FITT), to address the Industry’s problem and maintain the customers engagement, by research of the graphs and data of the market.

  • TikTok Bambuser AB announced in February 2023 a partnership with Tiktok to offer its sellers an enhanced, more consumer-friendly livestream shopping experience in the U.S. market by connecting their streams directly intothe cessader's product listings on shoppable profile pages hosted within the shop tab.

Live Commerce Platforms Market Report Scope

Report Attributes Details
Market Size in 2023 US$ 0.98 billion
Market Size by 2032 US$ 5.40 Billion
CAGR CAGR of 20.9 % From 2024 to 2032
Base Year 2023
Forecast Period 2024-2032
Historical Data 2020-2022
Report Scope & Coverage Market Size, Segments Analysis, Competitive  Landscape, Regional Analysis, DROC & SWOT Analysis, Forecast Outlook
Key Segments • By category (Cosmetics & Personal Care, Apparel & Fashion, Consumer Electronics, Furnishing, Entertainment, Others)
Regional Analysis/Coverage North America (US, Canada, Mexico), Europe (Eastern Europe [Poland, Romania, Hungary, Turkey, Rest of Eastern Europe] Western Europe [Germany, France, UK, Italy, Spain, Netherlands, Switzerland, Austria, Rest of Western Europe]), Asia Pacific (China, India, Japan, South Korea, Vietnam, Singapore, Australia, Rest of Asia Pacific), Middle East & Africa (Middle East [UAE, Egypt, Saudi Arabia, Qatar, Rest of Middle East], Africa [Nigeria, South Africa, Rest of Africa], Latin America (Brazil, Argentina, Colombia, Rest of Latin America)
Company Profiles CommentSold,  GhostRetail, Inc.,  Firework,  ShopShops,  TalkShopLive, Restream, Inc.,  Bambuser AB,  Livescale, giosg.com Ltd.,  Klarna Bank AB (publ),  Taobao, Jingdong,  Suning, Pinduoduo,  Douyin,  Kuaishou,  Xiaohongshu, Bilibili, Weibo, WeChat, Amazon
Key Drivers • Increase in the demand for e-commerce platform to reach wider audience and enjoy more interactive experience with customers.
RESTRAINTS • Challenges with capturing and maintaining customer’s engagement, and handle regulatory issue.

Frequently Asked Questions

Ans.: Factors such as Challenges with capturing and maintaining customer engagement, and handling regulatory issues, can hamper the growth of the Live commerce Platforms market.


Ans.: The Fashion and Apparel will grow rapidly in the Live Commerce Platforms Market from 2024-2032.

Ans.: The expected CAGR of the global Live Commerce Platforms Market during the forecast period is 20.8%.

Ans.: The Live Commerce Platforms Market was valued at USD 0.98 billion in 2023

TABLE OF CONTENTS

1. Introduction

1.1 Market Definition

1.2 Scope

1.3 Research Assumptions

2. Industry Flowchart

3. Research Methodology

4. Market Dynamics

4.1 Drivers

4.2 Restraints

4.3 Opportunities

4.4 Challenges

5. Porter’s 5 Forces Model

6.  Pest Analysis

7. Live Commerce Platform Market Segmentation, By Category

7.1 Introduction

7.2 Cosmetics & Personal Care

7.3 Apparel & Fashion

7.4 Consumer Electronics

7.5 Furnishing, Entertainment

7.6 Others

8. Regional Analysis

8.1 Introduction

8.2 North America

8.2.1 Trend Analysis

8.2.2 North America Live Commerce Platform Market, By Country

8.2.3 North America Live Commerce Platform Market, By Application

8.2.4 USA       

8.2.4.1 USA Live Commerce Platform Market, By Application

8.2.5 Canada

8.2.5.1 Canada Live Commerce Platform Market, By Application          

8.2.6 Mexico

8.2.6.1 Mexico Live Commerce Platform Market, By Application

8.3 Europe

8.3.1 Trend Analysis

8.3.2 Eastern Europe

8.3.2.1 Eastern Europe Live Commerce Platform Market, By Country

8.3.2.2 Eastern Europe Live Commerce Platform Market, By Application

8.3.2.3 Poland

8.3.2.3.1 Poland Live Commerce Platform Market, By Application        

8.3.2.4 Romania

8.3.2.4.1 Romania Live Commerce Platform Market, By Application     

8.3.2.5 Hungary        

8.3.2.5.1 Hungary Live Commerce Platform Market, By Application

8.3.2.6 Turkey

8.3.2.6.1 Turkey Live Commerce Platform Market, By Application

8.3.2.7 Rest of Eastern Europe

8.3.2.7.1 Rest of Eastern Europe Live Commerce Platform Market, By Application

8.3.3 Western Europe 

8.3.3.1 Western Europe Live Commerce Platform Market, By Country

8.3.3.2 Western Europe Live Commerce Platform Market, By Application

8.3.3.3 Germany

8.3.3.3.1 Germany Live Commerce Platform Market, By Application

8.3.3.4 France 

8.3.3.4.1 France Live Commerce Platform Market, By Application

8.3.3.5 UK

8.3.3.5.1 UK Live Commerce Platform Market, By Application

8.3.3.6 Italy

8.3.3.6.1 Italy Live Commerce Platform Market, By Application 

8.3.3.7 Spain

8.3.3.7.1 Spain Live Commerce Platform Market, By Application

8.3.3.8 Netherlands

8.3.3.8.1 Netherlands Live Commerce Platform Market, By Application           

8.3.3.9 Switzerland

8.3.3.9.1 Switzerland Live Commerce Platform Market, By Application

8.3.3.10 Austria 

8.3.3.10.1 Austria Live Commerce Platform Market, By Application

8.3.3.11 Rest of Western Europe

8.3.3.11.1 Rest of Western Europe Live Commerce Platform Market, By Application

8.4 Asia-Pacific

8.4.1 Trend Analysis

8.4.2 Asia-Pacific Live Commerce Platform Market, By Country

8.4.3 Asia-Pacific Live Commerce Platform Market, By Application       

8.4.4 China

8.4.4.1 China Live Commerce Platform Market, By Application 

8.4.5 India

8.4.5.1 India Live Commerce Platform Market, By Application

8.4.6 Japan

8.4.6.1 Japan Live Commerce Platform Market, By Application

8.4.7 South Korea

8.4.7.1 South Korea Live Commerce Platform Market, By Application

8.4.8 Vietnam

8.4.8.1 Vietnam Live Commerce Platform Market, By Application

8.4.9 Singapore

8.4.9.1 Singapore Live Commerce Platform Market, By Application

8.4.10 Australia

8.4.10.1 Australia Live Commerce Platform Market, By Application

8.4.11 Rest of Asia-Pacific

8.4.11.1 Rest of Asia-Pacific Live Commerce Platform Market, By Application

8.5 Middle East & Africa

8.5.1 Trend Analysis

8.5.2 Middle East

8.5.2.1 Middle East Live Commerce Platform Market, By Country

8.5.2.2 Middle East Live Commerce Platform Market, By Application

8.5.2.3 UAE

8.5.2.3.1 UAE Live Commerce Platform Market, By Application

8.5.2.4 Egypt

8.5.2.4.1 Egypt Live Commerce Platform Market, By Application

8.5.2.5 Saudi Arabia 

8.5.2.5.1 Saudi Arabia Live Commerce Platform Market, By Application

8.5.2.6 Qatar

8.5.2.6.1 Qatar Live Commerce Platform Market, By Application

8.5.2.7 Rest of Middle East

8.5.2.7.1 Rest of Middle East Live Commerce Platform Market, By Application

8.5.3 Africa

8.5.3.1 Africa Live Commerce Platform Market, By Country

8.5.3.2 Africa Live Commerce Platform Market, By Application

8.5.3.3 Nigeria

8.5.3.3.1 Nigeria Live Commerce Platform Market, By Application

8.5.3.4 South Africa

8.5.3.4.1 South Africa Live Commerce Platform Market, By Application

8.5.3.5 Rest of Africa

8.5.3.5.1 Rest of Africa Live Commerce Platform Market, By Application

8.6 Latin America

8.6.1 Trend Analysis

8.6.2 Latin America Live Commerce Platform Market, By Country

8.6.3 Latin America Live Commerce Platform Market, By Application

8.6.4 Brazil

8.6.4.1 Brazil Live Commerce Platform Market, By Application

8.6.5 Argentina

8.6.5.1 Argentina Live Commerce Platform Market, By Application

8.6.6 Colombia

8.6.6.1 Colombia Live Commerce Platform Market, By Application

8.6.7 Rest of Latin America

8.6.7.1 Rest of Latin America Live Commerce Platform Market, By Application

9. Company Profiles

9.1 CommentSold

9.1.1 Company Overview

9.1.2 Financial

9.1.3 Products/ Services Offered

9.1.4 The SNS View

9.2 Raytheon Technologies Corporation

9.2.1 Company Overview

9.2.2 Financial

9.2.3 Products/ Services Offered

9.2.4 The SNS View

9.3 GhostRetail, Inc.

9.3.1 Company Overview

9.3.2 Financial

9.3.3 Products/ Services Offered

9.3.4 The SNS View

9.4 ShopShops

9.4.1 Company Overview

9.4.2 Financial

9.4.3 Products/ Services Offered

9.4.4 The SNS View

9.5 TalkShopLive

9.5.1 Company Overview

9.5.2 Financial

9.5.3 Products/ Services Offered

9.5.4 The SNS View

9.6 Restream, Inc.

9.6.1 Company Overview

9.6.2 Financial

9.6.3 Products/ Services Offered

9.6.4 The SNS View

13.7 Bambuser AB

9.7.1 Company Overview

9.7.2 Financial

9.7.3 Products/ Services Offered

9.7.4 The SNS View

9.8 Livescale

9.8.1 Company Overview

9.8.2 Financial

9.8.3 Products/ Services Offered

9.8.4 The SNS View

9.9 giosg.com Ltd.

9.9.1 Company Overview

9.9.2 Financial

9.9.3 Products/ Services Offered

9.9.4 The SNS View

9.10 Klarna Bank AB (publ)

9.10.1 Company Overview

9.10.2 Financial

9.10.3 Products/ Services Offered

9.10.4 The SNS View

10. Competitive Landscape

10.1 Competitive Benchmarking

10.2 Market Share Analysis

10.3 Recent Developments

            10.3.1 Industry News

            10.3.2 Company News

            10.3.3 Mergers & Acquisitions

11. Use Case and Best Practices

12. Conclusion

An accurate research report requires proper strategizing as well as implementation. There are multiple factors involved in the completion of good and accurate research report and selecting the best methodology to compete the research is the toughest part. Since the research reports we provide play a crucial role in any company’s decision-making process, therefore we at SNS Insider always believe that we should choose the best method which gives us results closer to reality. This allows us to reach at a stage wherein we can provide our clients best and accurate investment to output ratio.

Each report that we prepare takes a timeframe of 350-400 business hours for production. Starting from the selection of titles through a couple of in-depth brain storming session to the final QC process before uploading our titles on our website we dedicate around 350 working hours. The titles are selected based on their current market cap and the foreseen CAGR and growth.


The 5 steps process:

Step 1: Secondary Research:

Secondary Research or Desk Research is as the name suggests is a research process wherein, we collect data through the readily available information. In this process we use various paid and unpaid databases which our team has access to and gather data through the same. This includes examining of listed companies’ annual reports, Journals, SEC filling etc. Apart from this our team has access to various associations across the globe across different industries. Lastly, we have exchange relationships with various university as well as individual libraries.

Secondary Research

Step 2: Primary Research

When we talk about primary research, it is a type of study in which the researchers collect relevant data samples directly, rather than relying on previously collected data.  This type of research is focused on gaining content specific facts that can be sued to solve specific problems. Since the collected data is fresh and first hand therefore it makes the study more accurate and genuine.

We at SNS Insider have divided Primary Research into 2 parts.

Part 1 wherein we interview the KOLs of major players as well as the upcoming ones across various geographic regions. This allows us to have their view over the market scenario and acts as an important tool to come closer to the accurate market numbers. As many as 45 paid and unpaid primary interviews are taken from both the demand and supply side of the industry to make sure we land at an accurate judgement and analysis of the market.

This step involves the triangulation of data wherein our team analyses the interview transcripts, online survey responses and observation of on filed participants. The below mentioned chart should give a better understanding of the part 1 of the primary interview.

Primary Research

Part 2: In this part of primary research the data collected via secondary research and the part 1 of the primary research is validated with the interviews from individual consultants and subject matter experts.

Consultants are those set of people who have at least 12 years of experience and expertise within the industry whereas Subject Matter Experts are those with at least 15 years of experience behind their back within the same space. The data with the help of two main processes i.e., FGDs (Focused Group Discussions) and IDs (Individual Discussions). This gives us a 3rd party nonbiased primary view of the market scenario making it a more dependable one while collation of the data pointers.

Step 3: Data Bank Validation

Once all the information is collected via primary and secondary sources, we run that information for data validation. At our intelligence centre our research heads track a lot of information related to the market which includes the quarterly reports, the daily stock prices, and other relevant information. Our data bank server gets updated every fortnight and that is how the information which we collected using our primary and secondary information is revalidated in real time.

Data Bank Validation

Step 4: QA/QC Process

After all the data collection and validation our team does a final level of quality check and quality assurance to get rid of any unwanted or undesired mistakes. This might include but not limited to getting rid of the any typos, duplication of numbers or missing of any important information. The people involved in this process include technical content writers, research heads and graphics people. Once this process is completed the title gets uploader on our platform for our clients to read it.

Step 5: Final QC/QA Process:

This is the last process and comes when the client has ordered the study. In this process a final QA/QC is done before the study is emailed to the client. Since we believe in giving our clients a good experience of our research studies, therefore, to make sure that we do not lack at our end in any way humanly possible we do a final round of quality check and then dispatch the study to the client.

Key Segments:

By Category

  • Cosmetics & Personal Care
  • Apparel & Fashion
  • Consumer Electronics
  • Furnishing
  • Entertainment
  • Others


Request for Segment Customization as per your Business Requirement: Segment Customization Request

REGIONAL COVERAGE:

North America

  • US
  • Canada
  • Mexico

Europe

  • Eastern Europe
    • Poland
    • Romania
    • Hungary
    • Turkey
    • Rest of Eastern Europe
  • Western Europe
    • Germany
    • France
    • UK
    • Italy
    • Spain
    • Netherlands
    • Switzerland
    • Austria
    • Rest of Western Europe

Asia Pacific

  • China
  • India
  • Japan
  • South Korea
  • Vietnam
  • Singapore
  • Australia
  • Rest of Asia Pacific

Middle East & Africa

  • Middle East
    • UAE
    • Egypt
    • Saudi Arabia
    • Qatar
    • Rest of the Middle East
  • Africa
    • Nigeria
    • South Africa
    • Rest of Africa

Latin America

  • Brazil
  • Argentina
  • Colombia
  • Rest of Latin America

Request for Country Level Research Report: Country Level Customization Request

Available Customization

With the given market data, SNS Insider offers customization as per the company’s specific needs. The following customization options are available for the report:

  • Product Analysis
  • Criss-Cross segment analysis (e.g. Product X Application)
  • Product Matrix which gives a detailed comparison of product portfolio of each company
  • Geographic Analysis
  • Additional countries in any of the regions
  • Company Information
  • Detailed analysis and profiling of additional market players (Up to five)


  •            5000 (33% Discount)


  •            8950 (40% Discount)


  •            3050 (23% Discount)

Start a Conversation

Hi! Click one of our member below to chat on Phone