The Light Fidelity [LiFi] Technology Market was valued at USD 0.62 billion in 2023 and is expected to reach USD 35.62 billion by 2032, growing at a CAGR of 57.04% from 2024-2032. This report covers key aspects, including adoption rates of emerging technologies, investment trends, energy efficiency statistics, and user demographics. The rising demand for high-speed, secure, and energy-efficient communication is driving market growth, with healthcare emerging as a dominant sector. Increasing investments in Li-Fi applications and expanding user adoption across industries further highlight its potential to revolutionize wireless data transmission.
![Light Fidelity [LiFi] Technology Market Revenue Analysis](/images/1741755045-Light-Fidelity-LiFi-Technology-Market.webp)
Get more information on Light Fidelity [LiFi] Technology Market - Request Sample Report
Drivers
Growing Data Consumption Drives the Need for Faster, More Efficient Internet Solutions with LiFi Technology
With data consumption on the rise across the globe, the need for faster and more reliable internet solutions is on the rise. Traditional Wi-Fi networks are being stretched to their limits due to bandwidth constraints and interference. LiFi technology, which transmits data using light, has an attractive advantage of offering higher speeds and capacity. The need for speed and efficiency can effectively be met using this innovation in high-density spaces such as offices, public, and smart cities. LiFi's ability to provide high performance internet in an environment where a traditional network finds it difficult gives it a big future in connecting the digital world.
Restraints
Limited Range and Infrastructure Requirements Pose Challenges to Widespread Adoption of LiFi Technology
LiFi technology has challenges that are mainly presented by its low range and the dependency on line-of-sight communication. The signals in LiFi are unlike Wi-Fi because they cannot go through walls, furniture, and even people to transmit data, thus presenting limitations in coverage in larger spaces or environments where frequent signal blockages occur. The installment cost is also high because of specialized infrastructure-LED lights with Li-Fi transmitters, meaning that Li-Fi is less accessible for widespread use. Most of these factors can postpone LiFi technology adoption, especially in regions or industries that strictly consider the cost and comprehensive coverage for that service.
Opportunities
Smart City Development, IoT Expansion, and Healthcare Needs Drive LiFi Technology Growth Opportunities
The growing shift towards smart city development offers a significant avenue for LiFi technology, as urban areas increasingly rely on fast, secure, and efficient communication systems. LiFi can support smart city applications like traffic management, public safety, and environmental monitoring by providing reliable, high-speed connectivity. Additionally, the expansion of IoT presents another growth prospect, as LiFi’s high bandwidth and low latency are ideal for powering connected devices in smart homes, healthcare, and industrial automation. Furthermore, healthcare environments, where secure communication is critical, can greatly benefit from LiFi’s ability to provide uninterrupted, interference-free connectivity. As emerging markets seek affordable, high-speed internet solutions, LiFi has the potential to meet these demands effectively and cost-efficiently.
Challenges
Infrastructure Requirements and Limited Range Are Key Barriers to Widespread Adoption of LiFi Technology
The significant barrier that leads to not fully adopting the LiFi technology is the specific kind of infrastructure requirement. This means that specific kind of LED lighting systems which is supplied in transmitter form. Hence, for a business entity, it needs an up-gradation of an already installed system. This upgradation can cost the business as well as an individual a tremendous amount of money initially, therefore making the system underinvestment. Another challenge is the range of LiFi. It works efficiently only in direct line-of-sight, and signals are obstructed by walls, furniture, and other structures. This has limited its potential for broader applications, especially across large or complex spaces. Issues such as lack of standardization and public awareness readily pose further problems in this area, which altogether slows down the growth and adoption of the market for LiFi technology
By Component
The LED segment accounted for the highest revenue share of about 42% in 2023 in the Light Fidelity (LiFi) technology market, primarily due to the wide-scale adoption of energy-efficient LED lighting systems, which form an integral part of LiFi. On the other hand, the microcontrollers segment is expected to grow at the fastest CAGR of about 61.63% from 2024-2032 by virtue of a critical role in powering LiFi devices, enabling efficient data processing, and seamless integration with various applications, including IoT and smart devices.
By End Use
The healthcare segment dominated the Light Fidelity (LiFi) technology market with the highest revenue share of about 28% in 2023 due to LiFi’s ability to provide secure, high-speed, and interference-free communication, which is critical in medical environments. The retail segment is expected to grow at the fastest CAGR of about 60.43% from 2024-2032, driven by the increasing demand for enhanced customer experiences, personalized services, and seamless, high-speed connectivity in stores, improving in-store navigation and digital interactions.
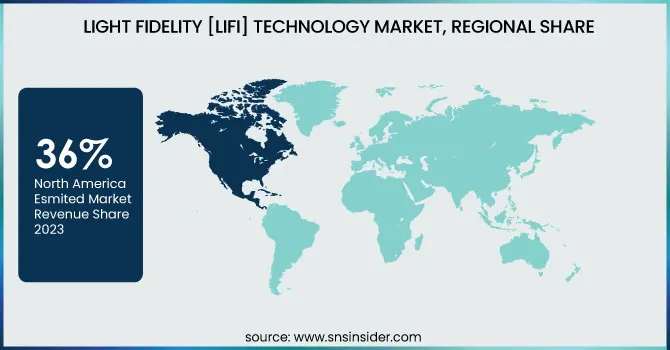
North America dominated the LiFi technology market with about 36% in terms of revenue share for 2023. This significant percentage domination has been due to strong technological infrastructure, adoption rates of advanced communication system penetration, and high demands for high-speed secure internet in different sectors across healthcare, smart cities, and retail. Notably, advanced research and development investments in North America further increased the LiFi market domination.
Asia Pacific is expected to grow at the fastest CAGR of about 59.49% from 2024-2032. The rapid urbanization and increasing digitalization in countries like China, India, and Japan are driving the demand for high-speed internet and smart city infrastructure. This, paired with the area's emphasis on cost-effective as well as energy-efficient technologies combined with the application of IoT in increasing numbers is going to create this as yet another very ideal space for adopting LiFi in Asia Pacific into the coming future.
Need any customization research on Light Fidelity [LiFi] Technology Market - Enquiry Now
PureLiFi (LiFi-XC, LiFi-X)
Oledcomm (Oledcomm LiFi, LiFiMAX)
Signify Holding (Trulifi 4001, Trulifi 802.11b)
VLNComm (Li-Fi System, VLNComm Li-Fi Kit)
Velmenni (Velmenni Li-Fi, Velmenni Light Communication)
Wipro Lighting (Wipro Li-Fi, Li-Fi Solutions)
LiFiComm (LiFiComm LIFi-5000, LiFiComm LIFi-2000)
Lucibel (Lucibel Li-Fi, Lucibel LifiComm)
Zero1 (Zero1 Li-Fi, Zero1 Wi-Fi Extender)
Panasonic Corporation (Panasonic LiFi, Panasonic LiFi Solutions)
Qualcomm Technologies, Inc. (Qualcomm LiFi, Qualcomm Snapdragon LiFi)
Koninklijke Philips NV (Philips LiFi, Philips Light Fidelity)
IBSENtelecom Ltd. (IBSENtelecom LiFi, IBSENtelecom LiFi Receiver)
Renesas Electronics Corporation (Renesas LiFi, Renesas Light Communication)
General Electric (GE LiFi, GE Lighting Solutions)
PureLiFi Ltd. (LiFi-XC, LiFi-X)
Oledcomm S.A.S. (Oledcomm LiFi, LiFiMAX)
Lvx System (Lvx Li-Fi, Lvx Light Communication)
Panasonic Corporation (Panasonic LiFi, Panasonic LiFi Solutions)
Acuity Brands (Acuity LiFi, Acuity Light Solutions)
In February 2024, pureLiFi unveiled next-generation LiFi technologies at Mobile World Congress (MWC) in Barcelona, introducing innovations like the LiFi Cube and SkyLite, designed to enhance wireless connectivity across various applications
In December 2024, Qualcomm discussed 6G technology and spectrum needs, highlighting innovations like Giga-MIMO, SBFD, and AI-driven beam management to unlock next-generation wireless connectivity
| Report Attributes | Details |
| Market Size in 2023 | USD 0.62 Billion |
| Market Size by 2032 | USD 35.62 Billion |
| CAGR | CAGR of 57.04% From 2024 to 2032 |
| Base Year | 2023 |
| Forecast Period | 2024-2032 |
| Historical Data | 2020-2022 |
| Report Scope & Coverage | Market Size, Segments Analysis, Competitive Landscape, Regional Analysis, DROC & SWOT Analysis, Forecast Outlook |
| Key Segments | • By Component (LED, Photodetector, Microcontrollers, Others) • By End-use (Automotive, Retail, Healthcare, Aerospace & Defense, Government, Transportation, Education, Others) |
| Regional Analysis/Coverage | North America (US, Canada, Mexico), Europe (Eastern Europe [Poland, Romania, Hungary, Turkey, Rest of Eastern Europe] Western Europe] Germany, France, UK, Italy, Spain, Netherlands, Switzerland, Austria, Rest of Western Europe]), Asia Pacific (China, India, Japan, South Korea, Vietnam, Singapore, Australia, Rest of Asia Pacific), Middle East & Africa (Middle East [UAE, Egypt, Saudi Arabia, Qatar, Rest of Middle East], Africa [Nigeria, South Africa, Rest of Africa], Latin America (Brazil, Argentina, Colombia, Rest of Latin America) |
| Company Profiles | PureLiFi, Oledcomm, Signify Holding, VLNComm, Velmenni, Wipro Lighting, LiFiComm, Lucibel, Zero1, Panasonic Corporation, Qualcomm Technologies, Inc., Koninklijke Philips NV, IBSENtelecom Ltd., Renesas Electronics Corporation, General Electric, PureLiFi Ltd., Oledcomm S.A.S., Lvx System, Acuity Brands |
ANS: Light Fidelity [LiFi] Technology Market was valued at USD 0.62 billion in 2023 and is expected to reach USD 35.62 billion by 2032, growing at a CAGR of 57.04% from 2024-2032.
ANS: The healthcare sector dominated with a 28% revenue share.
ANS: The LED segment led with a 42% market share.
ANS: North America dominated with a 36% market share.
ANS: Increasing data consumption, high-speed demand, and smart city development.
Table of Content
1. Introduction
1.1 Market Definition
1.2 Scope (Inclusion and Exclusions)
1.3 Research Assumptions
2. Executive Summary
2.1 Market Overview
2.2 Regional Synopsis
2.3 Competitive Summary
3. Research Methodology
3.1 Top-Down Approach
3.2 Bottom-up Approach
3.3. Data Validation
3.4 Primary Interviews
4. Market Dynamics Impact Analysis
4.1 Market Driving Factors Analysis
4.1.2 Drivers
4.1.2 Restraints
4.1.3 Opportunities
4.1.4 Challenges
4.2 PESTLE Analysis
4.3 Porter’s Five Forces Model
5. Statistical Insights and Trends Reporting
5.1 Adoption Rates of Emerging Technologies
5.2 Investment Trends
5.3 Energy Efficiency Statistics
5.4 User Demographics
6. Competitive Landscape
6.1 List of Major Companies, By Region
6.2 Market Share Analysis, By Region
6.3 Product Benchmarking
6.3.1 Product specifications and features
6.3.2 Pricing
6.4 Strategic Initiatives
6.4.1 Marketing and promotional activities
6.4.2 Distribution and supply chain strategies
6.4.3 Expansion plans and new product launches
6.4.4 Strategic partnerships and collaborations
6.5 Technological Advancements
6.6 Market Positioning and Branding
7. Light Fidelity [LiFi] Technology Market Segmentation, By Component
7.1 Chapter Overview
7.2 LED
7.2.1 LED Market Trends Analysis (2020-2032)
7.2.2 LED Market Size Estimates and Forecasts to 2032 (USD Billion)
7.3 Photodetector
7.3.1 Photodetector Market Trends Analysis (2020-2032)
7.3.2 Photodetector Market Size Estimates and Forecasts to 2032 (USD Billion)
7.4 Microcontrollers
7.4.1 Microcontrollers Market Trends Analysis (2020-2032)
7.4.2 Microcontrollers Market Size Estimates and Forecasts to 2032 (USD Billion)
7.5 Others
7.5.1 Others Market Trends Analysis (2020-2032)
7.5.2 Others Market Size Estimates and Forecasts to 2032 (USD Billion)
8. Light Fidelity [LiFi] Technology Market Segmentation, By End Use
8.1 Chapter Overview
8.2 Automotive
8.2.1 Automotive Market Trends Analysis (2020-2032)
8.2.2 Automotive Market Size Estimates and Forecasts to 2032 (USD Billion)
8.3 Retail
8.3.1 Retail Market Trends Analysis (2020-2032)
8.3.2 Retail Market Size Estimates and Forecasts to 2032 (USD Billion)
8.4 Healthcare
8.4.1 Healthcare Market Trends Analysis (2020-2032)
8.4.2 Healthcare Market Size Estimates and Forecasts to 2032 (USD Billion)
8.5 Aerospace & Defense
8.5.1 Aerospace & Defense Market Trends Analysis (2020-2032)
8.5.2 Aerospace & Defense Market Size Estimates and Forecasts to 2032 (USD Billion)
8.6 Government
8.6.1 Government Market Trends Analysis (2020-2032)
8.6.2 Government Market Size Estimates and Forecasts to 2032 (USD Billion)
8.7 Transportation
8.7.1 Transportation Market Trends Analysis (2020-2032)
8.7.2 Transportation Market Size Estimates and Forecasts to 2032 (USD Billion)
8.8 Education
8.8.1 Education Market Trends Analysis (2020-2032)
8.8.2 Education Market Size Estimates and Forecasts to 2032 (USD Billion)
8.9 Others
8.9.1 Others Market Trends Analysis (2020-2032)
8.9.2 Others Market Size Estimates and Forecasts to 2032 (USD Billion)
9. Regional Analysis
9.1 Chapter Overview
9.2 North America
9.2.1 Trends Analysis
9.2.2 North America Light Fidelity [LiFi] Technology Market Estimates and Forecasts, by Country (2020-2032) (USD Billion)
9.2.3 North America Light Fidelity [LiFi] Technology Market Estimates and Forecasts, By Component (2020-2032) (USD Billion)
9.2.4 North America Light Fidelity [LiFi] Technology Market Estimates and Forecasts, By End Use (2020-2032) (USD Billion)
9.2.5 USA
9.2.5.1 USA Light Fidelity [LiFi] Technology Market Estimates and Forecasts, By Component (2020-2032) (USD Billion)
9.2.5.2 USA Light Fidelity [LiFi] Technology Market Estimates and Forecasts, By End Use (2020-2032) (USD Billion)
9.2.6 Canada
9.2.6.1 Canada Light Fidelity [LiFi] Technology Market Estimates and Forecasts, By Component (2020-2032) (USD Billion)
9.2.6.2 Canada Light Fidelity [LiFi] Technology Market Estimates and Forecasts, By End Use (2020-2032) (USD Billion)
9.2.7 Mexico
9.2.7.1 Mexico Light Fidelity [LiFi] Technology Market Estimates and Forecasts, By Component (2020-2032) (USD Billion)
9.2.7.2 Mexico Light Fidelity [LiFi] Technology Market Estimates and Forecasts, By End Use (2020-2032) (USD Billion)
9.3 Europe
9.3.1 Eastern Europe
9.3.1.1 Trends Analysis
9.3.1.2 Eastern Europe Light Fidelity [LiFi] Technology Market Estimates and Forecasts, by Country (2020-2032) (USD Billion)
9.3.1.3 Eastern Europe Light Fidelity [LiFi] Technology Market Estimates and Forecasts, By Component (2020-2032) (USD Billion)
9.3.1.4 Eastern Europe Light Fidelity [LiFi] Technology Market Estimates and Forecasts, By End Use (2020-2032) (USD Billion)
9.3.1.5 Poland
9.3.1.5.1 Poland Light Fidelity [LiFi] Technology Market Estimates and Forecasts, By Component (2020-2032) (USD Billion)
9.3.1.5.2 Poland Light Fidelity [LiFi] Technology Market Estimates and Forecasts, By End Use (2020-2032) (USD Billion)
9.3.1.6 Romania
9.3.1.6.1 Romania Light Fidelity [LiFi] Technology Market Estimates and Forecasts, By Component (2020-2032) (USD Billion)
9.3.1.6.2 Romania Light Fidelity [LiFi] Technology Market Estimates and Forecasts, By End Use (2020-2032) (USD Billion)
9.3.1.7 Hungary
9.3.1.7.1 Hungary Light Fidelity [LiFi] Technology Market Estimates and Forecasts, By Component (2020-2032) (USD Billion)
9.3.1.7.2 Hungary Light Fidelity [LiFi] Technology Market Estimates and Forecasts, By End Use (2020-2032) (USD Billion)
9.3.1.8 Turkey
9.3.1.8.1 Turkey Light Fidelity [LiFi] Technology Market Estimates and Forecasts, By Component (2020-2032) (USD Billion)
9.3.1.8.2 Turkey Light Fidelity [LiFi] Technology Market Estimates and Forecasts, By End Use (2020-2032) (USD Billion)
9.3.1.9 Rest of Eastern Europe
9.3.1.9.1 Rest of Eastern Europe Light Fidelity [LiFi] Technology Market Estimates and Forecasts, By Component (2020-2032) (USD Billion)
9.3.1.9.2 Rest of Eastern Europe Light Fidelity [LiFi] Technology Market Estimates and Forecasts, By End Use (2020-2032) (USD Billion)
9.3.2 Western Europe
9.3.2.1 Trends Analysis
9.3.2.2 Western Europe Light Fidelity [LiFi] Technology Market Estimates and Forecasts, by Country (2020-2032) (USD Billion)
9.3.2.3 Western Europe Light Fidelity [LiFi] Technology Market Estimates and Forecasts, By Component (2020-2032) (USD Billion)
9.3.2.4 Western Europe Light Fidelity [LiFi] Technology Market Estimates and Forecasts, By End Use (2020-2032) (USD Billion)
9.3.2.5 Germany
9.3.2.5.1 Germany Light Fidelity [LiFi] Technology Market Estimates and Forecasts, By Component (2020-2032) (USD Billion)
9.3.2.5.2 Germany Light Fidelity [LiFi] Technology Market Estimates and Forecasts, By End Use (2020-2032) (USD Billion)
9.3.2.6 France
9.3.2.6.1 France Light Fidelity [LiFi] Technology Market Estimates and Forecasts, By Component (2020-2032) (USD Billion)
9.3.2.6.2 France Light Fidelity [LiFi] Technology Market Estimates and Forecasts, By End Use (2020-2032) (USD Billion)
9.3.2.7 UK
9.3.2.7.1 UK Light Fidelity [LiFi] Technology Market Estimates and Forecasts, By Component (2020-2032) (USD Billion)
9.3.2.7.2 UK Light Fidelity [LiFi] Technology Market Estimates and Forecasts, By End Use (2020-2032) (USD Billion)
9.3.2.8 Italy
9.3.2.8.1 Italy Light Fidelity [LiFi] Technology Market Estimates and Forecasts, By Component (2020-2032) (USD Billion)
9.3.2.8.2 Italy Light Fidelity [LiFi] Technology Market Estimates and Forecasts, By End Use (2020-2032) (USD Billion)
9.3.2.9 Spain
9.3.2.9.1 Spain Light Fidelity [LiFi] Technology Market Estimates and Forecasts, By Component (2020-2032) (USD Billion)
9.3.2.9.2 Spain Light Fidelity [LiFi] Technology Market Estimates and Forecasts, By End Use (2020-2032) (USD Billion)
9.3.2.10 Netherlands
9.3.2.10.1 Netherlands Light Fidelity [LiFi] Technology Market Estimates and Forecasts, By Component (2020-2032) (USD Billion)
9.3.2.10.2 Netherlands Light Fidelity [LiFi] Technology Market Estimates and Forecasts, By End Use (2020-2032) (USD Billion)
9.3.2.11 Switzerland
9.3.2.11.1 Switzerland Light Fidelity [LiFi] Technology Market Estimates and Forecasts, By Component (2020-2032) (USD Billion)
9.3.2.11.2 Switzerland Light Fidelity [LiFi] Technology Market Estimates and Forecasts, By End Use (2020-2032) (USD Billion)
9.3.2.12 Austria
9.3.2.12.1 Austria Light Fidelity [LiFi] Technology Market Estimates and Forecasts, By Component (2020-2032) (USD Billion)
9.3.2.12.2 Austria Light Fidelity [LiFi] Technology Market Estimates and Forecasts, By End Use (2020-2032) (USD Billion)
9.3.2.13 Rest of Western Europe
9.3.2.13.1 Rest of Western Europe Light Fidelity [LiFi] Technology Market Estimates and Forecasts, By Component (2020-2032) (USD Billion)
9.3.2.13.2 Rest of Western Europe Light Fidelity [LiFi] Technology Market Estimates and Forecasts, By End Use (2020-2032) (USD Billion)
9.4 Asia Pacific
9.4.1 Trends Analysis
9.4.2 Asia Pacific Light Fidelity [LiFi] Technology Market Estimates and Forecasts, by Country (2020-2032) (USD Billion)
9.4.3 Asia Pacific Light Fidelity [LiFi] Technology Market Estimates and Forecasts, By Component (2020-2032) (USD Billion)
9.4.4 Asia Pacific Light Fidelity [LiFi] Technology Market Estimates and Forecasts, By End Use (2020-2032) (USD Billion)
9.4.5 China
9.4.5.1 China Light Fidelity [LiFi] Technology Market Estimates and Forecasts, By Component (2020-2032) (USD Billion)
9.4.5.2 China Light Fidelity [LiFi] Technology Market Estimates and Forecasts, By End Use (2020-2032) (USD Billion)
9.4.6 India
9.4.5.1 India Light Fidelity [LiFi] Technology Market Estimates and Forecasts, By Component (2020-2032) (USD Billion)
9.4.5.2 India Light Fidelity [LiFi] Technology Market Estimates and Forecasts, By End Use (2020-2032) (USD Billion)
9.4.5 Japan
9.4.5.1 Japan Light Fidelity [LiFi] Technology Market Estimates and Forecasts, By Component (2020-2032) (USD Billion)
9.4.5.2 Japan Light Fidelity [LiFi] Technology Market Estimates and Forecasts, By End Use (2020-2032) (USD Billion)
9.4.6 South Korea
9.4.6.1 South Korea Light Fidelity [LiFi] Technology Market Estimates and Forecasts, By Component (2020-2032) (USD Billion)
9.4.6.2 South Korea Light Fidelity [LiFi] Technology Market Estimates and Forecasts, By End Use (2020-2032) (USD Billion)
9.4.7 Vietnam
9.4.7.1 Vietnam Light Fidelity [LiFi] Technology Market Estimates and Forecasts, By Component (2020-2032) (USD Billion)
9.2.7.2 Vietnam Light Fidelity [LiFi] Technology Market Estimates and Forecasts, By End Use (2020-2032) (USD Billion)
9.4.8 Singapore
9.4.8.1 Singapore Light Fidelity [LiFi] Technology Market Estimates and Forecasts, By Component (2020-2032) (USD Billion)
9.4.8.2 Singapore Light Fidelity [LiFi] Technology Market Estimates and Forecasts, By End Use (2020-2032) (USD Billion)
9.4.9 Australia
9.4.9.1 Australia Light Fidelity [LiFi] Technology Market Estimates and Forecasts, By Component (2020-2032) (USD Billion)
9.4.9.2 Australia Light Fidelity [LiFi] Technology Market Estimates and Forecasts, By End Use (2020-2032) (USD Billion)
9.4.10 Rest of Asia Pacific
9.4.10.1 Rest of Asia Pacific Light Fidelity [LiFi] Technology Market Estimates and Forecasts, By Component (2020-2032) (USD Billion)
9.4.10.2 Rest of Asia Pacific Light Fidelity [LiFi] Technology Market Estimates and Forecasts, By End Use (2020-2032) (USD Billion)
9.5 Middle East and Africa
9.5.1 Middle East
9.5.1.1 Trends Analysis
9.5.1.2 Middle East Light Fidelity [LiFi] Technology Market Estimates and Forecasts, by Country (2020-2032) (USD Billion)
9.5.1.3 Middle East Light Fidelity [LiFi] Technology Market Estimates and Forecasts, By Component (2020-2032) (USD Billion)
9.5.1.4 Middle East Light Fidelity [LiFi] Technology Market Estimates and Forecasts, By End Use (2020-2032) (USD Billion)
9.5.1.5 UAE
9.5.1.5.1 UAE Light Fidelity [LiFi] Technology Market Estimates and Forecasts, By Component (2020-2032) (USD Billion)
9.5.1.5.2 UAE Light Fidelity [LiFi] Technology Market Estimates and Forecasts, By End Use (2020-2032) (USD Billion)
9.5.1.6 Egypt
9.5.1.6.1 Egypt Light Fidelity [LiFi] Technology Market Estimates and Forecasts, By Component (2020-2032) (USD Billion)
9.5.1.6.2 Egypt Light Fidelity [LiFi] Technology Market Estimates and Forecasts, By End Use (2020-2032) (USD Billion)
9.5.1.7 Saudi Arabia
9.5.1.7.1 Saudi Arabia Light Fidelity [LiFi] Technology Market Estimates and Forecasts, By Component (2020-2032) (USD Billion)
9.5.1.7.2 Saudi Arabia Light Fidelity [LiFi] Technology Market Estimates and Forecasts, By End Use (2020-2032) (USD Billion)
9.5.1.8 Qatar
9.5.1.8.1 Qatar Light Fidelity [LiFi] Technology Market Estimates and Forecasts, By Component (2020-2032) (USD Billion)
9.5.1.8.2 Qatar Light Fidelity [LiFi] Technology Market Estimates and Forecasts, By End Use (2020-2032) (USD Billion)
9.5.1.9 Rest of Middle East
9.5.1.9.1 Rest of Middle East Light Fidelity [LiFi] Technology Market Estimates and Forecasts, By Component (2020-2032) (USD Billion)
9.5.1.9.2 Rest of Middle East Light Fidelity [LiFi] Technology Market Estimates and Forecasts, By End Use (2020-2032) (USD Billion)
9.5.2 Africa
9.5.2.1 Trends Analysis
9.5.2.2 Africa Light Fidelity [LiFi] Technology Market Estimates and Forecasts, by Country (2020-2032) (USD Billion)
9.5.2.3 Africa Light Fidelity [LiFi] Technology Market Estimates and Forecasts, By Component (2020-2032) (USD Billion)
9.5.2.4 Africa Light Fidelity [LiFi] Technology Market Estimates and Forecasts, By End Use (2020-2032) (USD Billion)
9.5.2.5 South Africa
9.5.2.5.1 South Africa Light Fidelity [LiFi] Technology Market Estimates and Forecasts, By Component (2020-2032) (USD Billion)
9.5.2.5.2 South Africa Light Fidelity [LiFi] Technology Market Estimates and Forecasts, By End Use (2020-2032) (USD Billion)
9.5.2.6 Nigeria
9.5.2.6.1 Nigeria Light Fidelity [LiFi] Technology Market Estimates and Forecasts, By Component (2020-2032) (USD Billion)
9.5.2.6.2 Nigeria Light Fidelity [LiFi] Technology Market Estimates and Forecasts, By End Use (2020-2032) (USD Billion)
9.5.2.7 Rest of Africa
9.5.2.7.1 Rest of Africa Light Fidelity [LiFi] Technology Market Estimates and Forecasts, By Component (2020-2032) (USD Billion)
9.5.2.7.2 Rest of Africa Light Fidelity [LiFi] Technology Market Estimates and Forecasts, By End Use (2020-2032) (USD Billion)
9.6 Latin America
9.6.1 Trends Analysis
9.6.2 Latin America Light Fidelity [LiFi] Technology Market Estimates and Forecasts, by Country (2020-2032) (USD Billion)
9.6.3 Latin America Light Fidelity [LiFi] Technology Market Estimates and Forecasts, By Component (2020-2032) (USD Billion)
9.6.4 Latin America Light Fidelity [LiFi] Technology Market Estimates and Forecasts, By End Use (2020-2032) (USD Billion)
9.6.5 Brazil
9.6.5.1 Brazil Light Fidelity [LiFi] Technology Market Estimates and Forecasts, By Component (2020-2032) (USD Billion)
9.6.5.2 Brazil Light Fidelity [LiFi] Technology Market Estimates and Forecasts, By End Use (2020-2032) (USD Billion)
9.6.6 Argentina
9.6.6.1 Argentina Light Fidelity [LiFi] Technology Market Estimates and Forecasts, By Component (2020-2032) (USD Billion)
9.6.6.2 Argentina Light Fidelity [LiFi] Technology Market Estimates and Forecasts, By End Use (2020-2032) (USD Billion)
9.6.7 Colombia
9.6.7.1 Colombia Light Fidelity [LiFi] Technology Market Estimates and Forecasts, By Component (2020-2032) (USD Billion)
9.6.7.2 Colombia Light Fidelity [LiFi] Technology Market Estimates and Forecasts, By End Use (2020-2032) (USD Billion)
9.6.8 Rest of Latin America
9.6.8.1 Rest of Latin America Light Fidelity [LiFi] Technology Market Estimates and Forecasts, By Component (2020-2032) (USD Billion)
9.6.8.2 Rest of Latin America Light Fidelity [LiFi] Technology Market Estimates and Forecasts, By End Use (2020-2032) (USD Billion)
10. Company Profiles
10.1 PureLiFi
10.1.1 Company Overview
10.1.2 Financial
10.1.3 Products/ Services Offered
10.1.4 SWOT Analysis
10.2 Oledcomm
10.2.1 Company Overview
10.2.2 Financial
10.2.3 Products/ Services Offered
10.2.4 SWOT Analysis
10.3 Signify Holding
10.3.1 Company Overview
10.3.2 Financial
10.3.3 Products/ Services Offered
10.3.4 SWOT Analysis
10.4 VLNComm
10.4.1 Company Overview
10.4.2 Financial
10.4.3 Products/ Services Offered
10.4.4 SWOT Analysis
10.5 Velmenni
10.5.1 Company Overview
10.5.2 Financial
10.5.3 Products/ Services Offered
10.5.4 SWOT Analysis
10.6 Wipro Lighting
10.6.1 Company Overview
10.6.2 Financial
10.6.3 Products/ Services Offered
10.6.4 SWOT Analysis
10.7 LiFiComm
10.7.1 Company Overview
10.7.2 Financial
10.7.3 Products/ Services Offered
10.7.4 SWOT Analysis
10.8 Lucibel
10.8.1 Company Overview
10.8.2 Financial
10.8.3 Products/ Services Offered
10.8.4 SWOT Analysis
10.9 Zero1
10.9.1 Company Overview
10.9.2 Financial
10.9.3 Products/ Services Offered
10.9.4 SWOT Analysis
10.10 Panasonic Corporation
10.10.1 Company Overview
10.10.2 Financial
10.10.3 Products/ Services Offered
10.10.4 SWOT Analysis
11. Use Cases and Best Practices
12. Conclusion
An accurate research report requires proper strategizing as well as implementation. There are multiple factors involved in the completion of good and accurate research report and selecting the best methodology to compete the research is the toughest part. Since the research reports we provide play a crucial role in any company’s decision-making process, therefore we at SNS Insider always believe that we should choose the best method which gives us results closer to reality. This allows us to reach at a stage wherein we can provide our clients best and accurate investment to output ratio.
Each report that we prepare takes a timeframe of 350-400 business hours for production. Starting from the selection of titles through a couple of in-depth brain storming session to the final QC process before uploading our titles on our website we dedicate around 350 working hours. The titles are selected based on their current market cap and the foreseen CAGR and growth.
The 5 steps process:
Step 1: Secondary Research:
Secondary Research or Desk Research is as the name suggests is a research process wherein, we collect data through the readily available information. In this process we use various paid and unpaid databases which our team has access to and gather data through the same. This includes examining of listed companies’ annual reports, Journals, SEC filling etc. Apart from this our team has access to various associations across the globe across different industries. Lastly, we have exchange relationships with various university as well as individual libraries.

Step 2: Primary Research
When we talk about primary research, it is a type of study in which the researchers collect relevant data samples directly, rather than relying on previously collected data. This type of research is focused on gaining content specific facts that can be sued to solve specific problems. Since the collected data is fresh and first hand therefore it makes the study more accurate and genuine.
We at SNS Insider have divided Primary Research into 2 parts.
Part 1 wherein we interview the KOLs of major players as well as the upcoming ones across various geographic regions. This allows us to have their view over the market scenario and acts as an important tool to come closer to the accurate market numbers. As many as 45 paid and unpaid primary interviews are taken from both the demand and supply side of the industry to make sure we land at an accurate judgement and analysis of the market.
This step involves the triangulation of data wherein our team analyses the interview transcripts, online survey responses and observation of on filed participants. The below mentioned chart should give a better understanding of the part 1 of the primary interview.

Part 2: In this part of primary research the data collected via secondary research and the part 1 of the primary research is validated with the interviews from individual consultants and subject matter experts.
Consultants are those set of people who have at least 12 years of experience and expertise within the industry whereas Subject Matter Experts are those with at least 15 years of experience behind their back within the same space. The data with the help of two main processes i.e., FGDs (Focused Group Discussions) and IDs (Individual Discussions). This gives us a 3rd party nonbiased primary view of the market scenario making it a more dependable one while collation of the data pointers.
Step 3: Data Bank Validation
Once all the information is collected via primary and secondary sources, we run that information for data validation. At our intelligence centre our research heads track a lot of information related to the market which includes the quarterly reports, the daily stock prices, and other relevant information. Our data bank server gets updated every fortnight and that is how the information which we collected using our primary and secondary information is revalidated in real time.

Step 4: QA/QC Process
After all the data collection and validation our team does a final level of quality check and quality assurance to get rid of any unwanted or undesired mistakes. This might include but not limited to getting rid of the any typos, duplication of numbers or missing of any important information. The people involved in this process include technical content writers, research heads and graphics people. Once this process is completed the title gets uploader on our platform for our clients to read it.
Step 5: Final QC/QA Process:
This is the last process and comes when the client has ordered the study. In this process a final QA/QC is done before the study is emailed to the client. Since we believe in giving our clients a good experience of our research studies, therefore, to make sure that we do not lack at our end in any way humanly possible we do a final round of quality check and then dispatch the study to the client.
Key Segments:
By Component
LED
Photodetector
Microcontrollers
Others
By End-use
Automotive
Retail
Healthcare
Aerospace & Defense
Government
Transportation
Education
Others
Request for Segment Customization as per your Business Requirement: Segment Customization Request
Regional Coverage:
North America
US
Canada
Mexico
Europe
Eastern Europe
Poland
Romania
Hungary
Turkey
Rest of Eastern Europe
Western Europe
Germany
France
UK
Italy
Spain
Netherlands
Switzerland
Austria
Rest of Western Europe
Asia Pacific
China
India
Japan
South Korea
Vietnam
Singapore
Australia
Rest of Asia Pacific
Middle East & Africa
Middle East
UAE
Egypt
Saudi Arabia
Qatar
Rest of Middle East
Africa
Nigeria
South Africa
Rest of Africa
Latin America
Brazil
Argentina
Colombia
Rest of Latin America
Request for Country Level Research Report: Country Level Customization Request
Available Customization
With the given market data, SNS Insider offers customization as per the company’s specific needs. The following customization options are available for the report:
Detailed Volume Analysis
Criss-Cross segment analysis (e.g. Product X Application)
Competitive Product Benchmarking
Geographic Analysis
Additional countries in any of the regions
Customized Data Representation
Detailed analysis and profiling of additional market players
The Quantum Computing Market Size was valued at USD 1.03 Billion in 2023 and is expected to reach USD 10.31 Billion by 2032 and grow at a CAGR of 29.1% over the forecast period 2024-2032.
The Integration Platform as a Service Market Size was USD 10.1 Billion in 2023 & will reach USD 106.60 Bn by 2032 & grow at a CAGR of 29.93 % by 2024-2032.
The Predictive Analytics Market size was valued at USD 13.5 billion in 2023 and will grow to USD 82.9 billion by 2032 and grow at a CAGR of 22.4 % by 2032.
The Virtual Data Room Market Size was valued at USD 2.16 Billion in 2023 and will reach USD 11.37 Billion by 2032 and grow at a CAGR of 20.3% 2032.
Sports Betting Market size was USD 92.0 billion in 2023 and is expected to reach USD 221.4 billion by 2032 and grow at a CAGR of 10.2% over the forecast period 2024-2032.
The Sales Gamification Software Market size was valued at USD 13.1 Billion in 2023. It is expected to grow to USD 90.8 Billion by 2032 and grow at a CAGR of 27.4% over the forecast period of 2024-2032.

Hi! Click one of our member below to chat on Phone
© 2025 All Rights Reserved by SNS Insider Pvt Ltd


