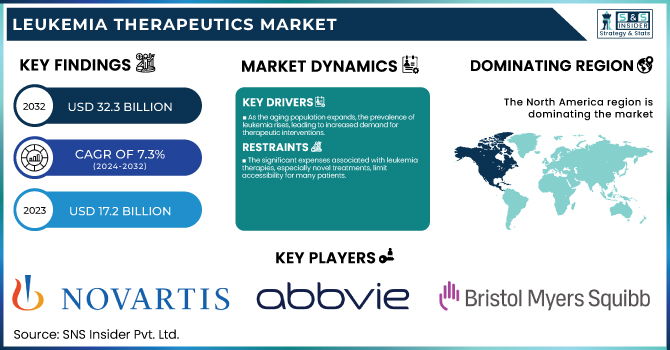
The Leukemia Therapeutics Market Size was valued at USD 17.2 Billion in 2023 and is expected to reach USD 32.3 Billion by 2032, growing at a CAGR of 7.3% over the forecast period 2024-2032.
To Get More Information on Leukemia Therapeutics Market - Request Sample Report
The growth of the global Leukemia Therapeutics Market is largely attributed by the increase in leukemia incidences worldwide. GLOBOCAN 2020 stated that approximately 475,000 new cases of leukemia were diagnosed worldwide in 2020, however, rates are estimated to rise to 692,000 new cases by 2040. An urgent demand for effective therapeutics is thus raised due to this shocking increase in leukemia cases. According to the American Cancer Society, 59,610 new cases of leukemia and 23,710 deaths were estimated in 2023 in the US alone, underscoring the urgent need to develop new potential treatments. Growing awareness and better diagnostic capabilities are also contributing to the market growth, as it is making diagnosis easy and aiding in initiative treatment at the early stage. Investments in research and development by both pharmaceutical houses and academic institutions are driving creativity in both targeted therapies and immunotherapy, bringing recent excitement to patients with all types of leukemia. The market is also benefiting from initiatives and funding by the government for cancer research. For example, the NCI in the U.S. has invested nearly $200 million in leukemia research in fiscal year 2021.
Additionally, the FDA's accelerated approval pathways for breakthrough therapies are facilitating faster market entry for promising leukemia treatments. Increasingly, genetic profiling and biomarker analysis are allowing for personalized medicine approaches to treatment strategies. At the same time, increasing penetration of healthcare infrastructure and access to advanced therapies in some emerging economies are boosting the growth opportunities in the market. The COVID-19 pandemic has also indirectly impacted the market by highlighting the importance of robust healthcare systems and accelerating digital health solutions, which may benefit leukemia patients in terms of remote monitoring and care delivery.
Market dynamics
Drivers
The global increase in leukemia cases, attributed to factors like genetic predisposition and environmental exposures, is boosting the demand for effective treatments.
Innovations such as targeted therapies, immunotherapies, and gene therapies have enhanced treatment efficacy and patient outcomes, propelling market growth.
As the aging population expands, the prevalence of leukemia rises, leading to increased demand for therapeutic interventions.
Leukemia is the most common childhood cancer and the increase in cases heavily drives the development of treatment. According to figures, 2025 is projected to see about 6,100 new cases of acute lymphocytic leukemia (ALL) in the United States, along with roughly 1,400 kills from the disease. Similarly, chronic lymphocytic leukemia (CLL) is expected to account for about 23,690 new cases in the same year, leading to approximately 4,460 deaths. Leukemia is the sixth most common cancer in India having a 4.83% prevalence of total cancer cases in India during 1990–2019. Males exhibit a higher incidence rate (6.27%) compared to females (4.03%). This upward trend in leukemia cases underscores the critical need for effective therapeutic strategies.
The rise in the number of leukemia cases has made a huge impact on the improvement of treatment practices. For example, the effectiveness of targeted treatments and immunotherapies has transformed patient results. Additionally, early detection through standard tests like complete blood counts (CBCs) and metabolic profiles is crucial and can lead to effective treatments, enhancing patient survival regardless of a late diagnosis.
Restraints
The significant expenses associated with leukemia therapies, especially novel treatments, limit accessibility for many patients.
Complex and lengthy approval processes for new drugs can delay the availability of innovative treatments in the market.
Concerns about adverse effects and the development of resistance to conventional treatments pose challenges to effective leukemia management
The high cost of leukemia therapeutics continues to be a significant obstacle to achieving widespread accessibility to this form of treatment. Drugs like CAR-T cell therapy, targeted drugs and other immunotherapies are expensive for patients because they have long and complex manufacturing processes paired with lengthy clinical guidelines as well as significant research and development costs. Additionally, prolonged treatment durations, hospital stays, and supportive care further add to financial burdens.
Inadequate insurance coverage and costly out-of-pocket expenses for many patients, especially in low-and middle-income settings, render these treatments inaccessible to patients who need them. In developed countries, insurance limits and reimbursement policies frequently induce financial burden. This affordability challenge also applies to healthcare systems that face restrictions on their budgets to allow access to new treatments. For this purpose, financial support, generics, or relevant changes to policies are being addressed by pharmaceutical companies and governments worldwide. However, cost remains a significant challenge, restricting treatment accessibility and adoption on a global scale.
Segment Analysis
By type of leukemia
In 2023, the Chronic Lymphocytic Leukemia (CLL) segment held the dominant share of the market. This is probably because CLL is more common than other forms of leukemia. Chronic lymphocytic leukemia (CLL) is the most prevalent adult leukemia in Western countries, accounting for around 25-30% of leukemia cases in total. Chronic lymphocytic leukemia (CLL) is responsible for nearly a third of leukemia cases in America, according to American Cancer Society. The CLL segment is expected to grow at a high rate thanks to the availability of a variety of treatment types, including targeted therapy such as BTK inhibitors and BCL-2 inhibitors, which have proven to be effective in the treatment of CLL. These novel therapies have not only improved the prognosis of patients but also substantially increased the market valuation for CLL therapies.
In addition, as CLL is a chronic disease, the long-term treatment requirement continues to underpin the demand for therapeutics. Also, one major factor is the aging population of the world, as chronic lymphocytic leukemia predominantly presents itself in the elderly (more than half of CLL patients are diagnosed at over 70 years of age). In addition, government initiatives for CLL treatment are also one of the factors for the CLL segment to dominate the global chronic lymphocytic leukemia market. As an example, the National Cancer Institute has conducted and funded many clinical trials and research related to CLL over the years, with a direct impact on CLL treatment protocols and drug development. The relatively better prognosis of CLL compared to acute leukemias has resulted in a larger patient pool requiring ongoing treatment, further driving market growth in this segment.
By treatment type
In 2023, the chemotherapy segment dominated the market and held the largest market share 48%. This dominance can be attributed to several factors, including the long-standing role of chemotherapy as a cornerstone in leukemia treatment. For the treatment of acute leukemias where the time for intervention is short, chemotherapy still plays an important part in many treatment regimens. Chemotherapy continues to be the most common first-line therapy for many types of leukemia and is the most important therapy for acute myeloid leukemia (AML) and acute lymphoblastic leukemia (ALL), the National Cancer Institute notes. One reason why chemotherapy is used so often is because it works for nearly all types and stages of leukemia. According to government data from cancer registries, many leukemia patients are treated with chemotherapy. For instance, the SEER database shows that over 60% of AML patients undergo chemotherapy as part of their initial treatment. However, the number of available chemotherapy drugs has expanded rapidly in recent decades, both old cytotoxic agents and new targeted therapies expanded treatment options and outcomes.
Moreover, the research and clinical trials are still in progress to broaden the scope of the chemotherapy protocols in an effective and low side effects manner. Due to the low cost per treatment of multiple chemotherapy regimens, especially for generic drugs, they are affordable to more healthcare settings and as such, command a significant market share. Moreover, since numerous countries have set up certain parts of reimbursement policies for chemotherapy, patients have much wider access to such treatments.
By Distribution Channels
In 2023, the hospital pharmacy segment held the largest market share. Several elements regarding leukemia treatment and healthcare delivery systems contribute to this dominance. Leukemia treatment, particularly for acute cases that need prompt and aggressive therapy, primarily occurs in hospital settings. Preliminary CDC data has previously indicated that a large portion of leukemia patients receive their first treatment and ongoing care in hospitals. Most leukemia therapies, such as chemotherapy regimens and stem cell transplants, require treatment in controlled hospital settings, which propels demand for hospital pharmacy services. Hospital pharmacies can manage specialized medications requiring more care in preparation and management, such as cytotoxic drugs and targeted therapies. As more chemotherapy treatments are being administered on an outpatient basis, the importance of the hospital pharmacy in the management and dispensing of these medications has only grown. Dedicated oncology pharmacy services must also be integrated to ensure the safe and effective management of leukemia therapeutics, driven partly by government regulations, accreditation standards, and delineation of pharmacy services. With the implementation of electronic health records and computerized physician order entry systems in the hospital, efficient and safe medication use has been made possible, allowing the hospital pharmacy to remain a mainstay of leukemia therapeutic drug management.
Regional analysis
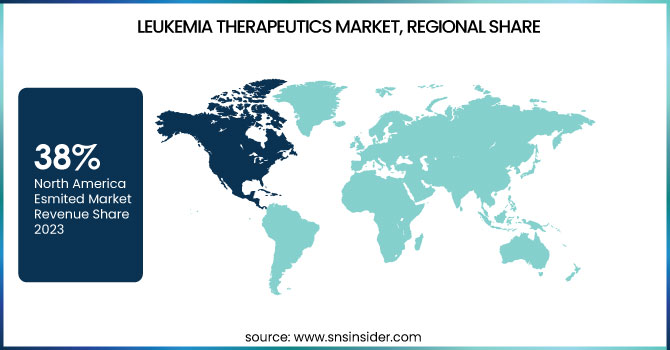
In 2023, North America held the largest share of the global Leukemia Therapeutics Market with a 38% market share. Several factors, such as an advanced healthcare infrastructure, high healthcare expenditure, and a robust research and development ecosystem, contribute to this dominance. Leukemia research and treatment innovations have also been spearheaded in the United States, which has long been a dominant force in the field. The National Cancer Institute reports that leukemia research receives substantial financial resources, and ongoing clinical trials are testing many new therapies. Additionally, the continued strength of the market is due to the region's dominant position in the research and development of advanced treatment types including CAR-T cell therapeutic compounds and targeted molecular inhibitors.
However, the Asia-Pacific region is expected to grow with the highest CAGR in the forecast period. The major factors contributing to this rapid growth are improving healthcare infrastructure, increasing healthcare expenditure, and a large patient population. Countries including China and India are witnessing government initiatives for improving cancer care and increasing the reach of advanced treatments, thereby aiding the market growth. The Healthy China 2030 plan in China has emission targets for cancer diagnostics and treatment that should contribute to the growth of the leukemia therapeutics market. Market growth in the Asia-Pacific region is also driven by an increased domestic focus on developing pharmaceutical capabilities and several collaborations with pharmaceutical companies across the globe.
Do You Need any Customization Research on Leukemia Therapeutics Market - Enquire Now
Key Players
Service Providers / Manufacturers
Novartis International AG (Switzerland): [Kymriah, Gleevec]
AbbVie Inc. (USA): [Venclexta, Imbruvica]
Bristol-Myers Squibb Company (USA): [Sprycel, Revlimid]
F. Hoffmann-La Roche Ltd (Switzerland): [Gazyva, Venclexta]
Sanofi S.A. (France): [Clolar, Mozobil]
Pfizer Inc. (USA): [Bosulif, Besponsa]
Amgen Inc. (USA): [Blincyto, Neulasta]
Gilead Sciences, Inc. (USA): [Zydelig, Yescarta]
Takeda Pharmaceutical Company Limited (Japan): [Adcetris, Ninlaro]
Celgene Corporation (USA): [Revlimid, Idhifa]
Recent developments
Quizartinib was granted accelerated approval by the U.S. Food and Drug Administration (FDA) in August 2023 for patients with newly diagnosed FLT3-ITD-positive acute myeloid leukemia (AML) in combination with standard cytarabine and anthracycline induction and cytarabine consolidation. This approval offers a new targeted treatment option for a subset of AML patients.
In March 2024, Novartis announced positive Phase III results of the CAR-T cell therapy Kymriah in pediatric and young adult patients with relapsed or refractory B-cell acute lymphoblastic leukemia (ALL). This trial showed a meaningful improvement in OS and EFS making it a potential new treatment option in this patient population.
In November 2024 Bristol Myers Squibb secured FDA approval for a new formulation of dasatinib, the tyrosine kinase inhibitor indicated for patients with chronic myeloid leukemia (CML). However, the new formulation provides improved bioavailability and a more convenient dosing schedule, which may improve patient adherence and outcomes in the management of CML.
| Report Attributes | Details |
| Market Size in 2023 | US$ 17.2 Bn |
| Market Size by 2032 | US$ 32.3 Bn |
| CAGR | CAGR of 7.3% From 2024 to 2032 |
| Base Year | 2023 |
| Forecast Period | 2024-2032 |
| Historical Data | 2020-2022 |
| Report Scope & Coverage | Market Size, Segments Analysis, Competitive Landscape, Regional Analysis, DROC & SWOT Analysis, Forecast Outlook |
| Key Segments | • By Type of Leukemia (Chronic Lymphocytic Leukemia, Acute Lymphocytic Leukemia, Chronic Myeloid Leukemia, Acute Myeloid Leukemia, Others) • By Route of Administration (Oral, Injectable) • By Treatment Type (Chemotherapy, Immunotherapy, Targeted Therapy, others) • By Distribution channel (Hospital Pharmacies, Retail Pharmacies, Others) |
| Regional Analysis/Coverage | North America (US, Canada, Mexico), Europe (Eastern Europe [Poland, Romania, Hungary, Turkey, Rest of Eastern Europe] Western Europe] Germany, France, UK, Italy, Spain, Netherlands, Switzerland, Austria, Rest of Western Europe]). Asia Pacific (China, India, Japan, South Korea, Vietnam, Singapore, Australia, Rest of Asia Pacific), Middle East & Africa (Middle East [UAE, Egypt, Saudi Arabia, Qatar, Rest of Middle East], Africa [Nigeria, South Africa, Rest of Africa], Latin America (Brazil, Argentina, Colombia Rest of Latin America) |
| Company Profiles |
Novartis International AG, AbbVie Inc., Bristol-Myers Squibb Company, F. Hoffmann-La Roche Ltd, Sanofi S.A., Pfizer Inc., Amgen Inc., Gilead Sciences, Inc., Takeda Pharmaceutical Company Limited, Celgene Corporation |
| Key Drivers | • The global increase in leukemia cases, attributed to factors like genetic predisposition and environmental exposures, is boosting the demand for effective treatments. • Innovations such as targeted therapies, immunotherapies, and gene therapies have enhanced treatment efficacy and patient outcomes, propelling market growth. • As the aging population expands, the prevalence of leukemia rises, leading to increased demand for therapeutic interventions. |
| Market Restraints | • The significant expenses associated with leukemia therapies, especially novel treatments, limit accessibility for many patients. • Complex and lengthy approval processes for new drugs can delay the availability of innovative treatments in the market. • Concerns about adverse effects and the development of resistance to conventional treatments pose challenges to effective leukemia management |
Ans: Leukemia Therapeutics Market is expected to grow at a CAGR of 6.9%.
Ans: Leukemia Therapeutics Market size was USD 16 Billion in 2023 and is expected to Reach USD 27.28 Billion by 2031.
Ans: The leukaemia therapeutics market is expected to grow due to the availability of improved healthcare infrastructure, an increase in unmet healthcare needs, a rise in the prevalence of chronic lymphocytic leukaemia, and a surge in demand for leukaemia therapeutics.
Ans: During the lockout period, the leukaemia therapeutics market shrank due to a drop in demand for leukaemia therapeutics such as targeted treatment and immunotherapy medications. Furthermore, fewer hospital visits for leukaemia treatment as a result of the rigorous lockdown had a detrimental influence on market growth.
Ans: North America overtook other regional markets as the largest market for Leukemia Therapeutics, with the highest revenue share.
Table of Contents
1. Introduction
1.1 Market Definition
1.2 Scope (Inclusion and Exclusions)
1.3 Research Assumptions
2. Executive Summary
2.1 Market Overview
2.2 Regional Synopsis
2.3 Competitive Summary
3. Research Methodology
3.1 Top-Down Approach
3.2 Bottom-up Approach
3.3. Data Validation
3.4 Primary Interviews
4. Market Dynamics Impact Analysis
4.1 Market Driving Factors Analysis
4.1.1 Drivers
4.1.2 Restraints
4.1.3 Opportunities
4.1.4 Challenges
4.2 PESTLE Analysis
4.3 Porter’s Five Forces Model
5. Statistical Insights and Trends Reporting
5.1 Incidence and Prevalence of Leukemia (2023)
5.2 Prescription Trends (2023), by Region
5.3 Drug Volume: Production and Usage (2020-2032)
5.4 Healthcare Spending on Leukemia Treatment (2023)
5.5 Adoption Rates of Advanced Leukemia Therapies (2023)
6. Competitive Landscape
6.1 List of Major Companies, By Region
6.2 Market Share Analysis, By Region
6.3 Product Benchmarking
6.3.1 Product specifications and features
6.3.2 Pricing
6.4 Strategic Initiatives
6.4.1 Marketing and promotional activities
6.4.2 Distribution and Supply Chain Strategies
6.4.3 Expansion plans and new product launches
6.4.4 Strategic partnerships and collaborations
6.5 Technological Advancements
6.6 Market Positioning and Branding
7. Leukemia Therapeutics Market Segmentation, By Type of Leukemia
7.1 Chapter Overview
7.2 Chronic Myeloid Leukemia (CML)
7.2.1 Chronic Myeloid Leukemia (CML) Market Trends Analysis (2020-2032)
7.2.2 Chronic Myeloid Leukemia (CML) Market Size Estimates and Forecasts to 2032 (USD Billion)
7.3 Acute Lymphocytic Leukemia (ALL)
7.3.1 Acute Lymphocytic Leukemia (ALL) Market Trends Analysis (2020-2032)
7.3.2 Acute Lymphocytic Leukemia (ALL) Market Size Estimates and Forecasts to 2032 (USD Billion)
7.4 Chronic Lymphocytic Leukemia (CLL)
7.4.1 Chronic Lymphocytic Leukemia (CLL) Market Trends Analysis (2020-2032)
7.4.2 Chronic Lymphocytic Leukemia (CLL) Market Size Estimates and Forecasts to 2032 (USD Billion)
7.5 Acute Myeloid Leukemia (AML)
7.5.1 Acute Myeloid Leukemia (AML) Market Trends Analysis (2020-2032)
7.5.2 Acute Myeloid Leukemia (AML) Market Size Estimates and Forecasts to 2032 (USD Billion)
7.6 Others
7.6.1 Others Market Trends Analysis (2020-2032)
7.6.2 Others Market Size Estimates and Forecasts to 2032 (USD Billion)
8. Leukemia Therapeutics Market Segmentation, By Treatment Type
8.1 Chapter Overview
8.2 Chemotherapy
8.2.1 Chemotherapy Market Trends Analysis (2020-2032)
8.2.2 Chemotherapy Market Size Estimates and Forecasts to 2032 (USD Billion)
8.3 Immunotherapy
8.3.1 Immunotherapy Market Trends Analysis (2020-2032)
8.3.2 Immunotherapy Market Size Estimates and Forecasts to 2032 (USD Billion)
8.4 Targeted Therapy
8.4.1 Targeted Therapy Market Trends Analysis (2020-2032)
8.4.2 Targeted Therapy Market Size Estimates and Forecasts to 2032 (USD Billion)
8.5 Others
8.5.1 Others Market Trends Analysis (2020-2032)
8.5.2 Others Market Size Estimates and Forecasts to 2032 (USD Billion)
9. Leukemia Therapeutics Market Segmentation, By Route of administration
9.1 Chapter Overview
9.2 Oral
9.2.1 Oral Market Trends Analysis (2020-2032)
9.2.2 Oral Market Size Estimates and Forecasts to 2032 (USD Billion)
9.3 Injectable
9.3.1 Injectable Market Trends Analysis (2020-2032)
9.3.2 Injectable Market Size Estimates and Forecasts to 2032 (USD Billion)
10. Leukemia Therapeutics Market Segmentation, By Distribution Channels
10.1 Chapter Overview
10.2 Hospital Pharmacy
10.2.1 Hospital Pharmacy Market Trends Analysis (2020-2032)
10.2.2 Hospital Pharmacy Market Size Estimates and Forecasts to 2032 (USD Billion)
10.3 Retail Pharmacy
10.3.1 Retail Pharmacy Market Trends Analysis (2020-2032)
10.3.2 Retail Pharmacy Market Size Estimates and Forecasts to 2032 (USD Billion)
10.4 Online Pharmacy
10.4.1 Online Pharmacy Market Trends Analysis (2020-2032)
10.4.2 Online Pharmacy Market Size Estimates and Forecasts to 2032 (USD Billion)
11. Regional Analysis
11.1 Chapter Overview
11.2 North America
11.2.1 Trends Analysis
11.2.2 North America Leukemia Therapeutics Market Estimates and Forecasts, by Country (2020-2032) (USD Billion)
11.2.3 North America Leukemia Therapeutics Market Estimates and Forecasts, By Type of Leukemia (2020-2032) (USD Billion)
11.2.4 North America Leukemia Therapeutics Market Estimates and Forecasts, By Treatment Type (2020-2032) (USD Billion)
11.2.5 North America Leukemia Therapeutics Market Estimates and Forecasts, By Route of administration (2020-2032) (USD Billion)
11.2.6 North America Leukemia Therapeutics Market Estimates and Forecasts, By Distribution Channels (2020-2032) (USD Billion)
11.2.7 USA
11.2.7.1 USA Leukemia Therapeutics Market Estimates and Forecasts, By Type of Leukemia (2020-2032) (USD Billion)
11.2.7.2 USA Leukemia Therapeutics Market Estimates and Forecasts, By Treatment Type (2020-2032) (USD Billion)
11.2.7.3 USA Leukemia Therapeutics Market Estimates and Forecasts, By Route of administration (2020-2032) (USD Billion)
11.2.7.4 USA Leukemia Therapeutics Market Estimates and Forecasts, By Distribution Channels (2020-2032) (USD Billion)
11.2.7 Canada
11.2.7.1 Canada Leukemia Therapeutics Market Estimates and Forecasts, By Type of Leukemia (2020-2032) (USD Billion)
11.2.7.2 Canada Leukemia Therapeutics Market Estimates and Forecasts, By Treatment Type (2020-2032) (USD Billion)
11.2.7.3 Canada Leukemia Therapeutics Market Estimates and Forecasts, By Route of administration (2020-2032) (USD Billion)
11.2.7.3 Canada Leukemia Therapeutics Market Estimates and Forecasts, By Distribution Channels (2020-2032) (USD Billion)
11.2.8 Mexico
11.2.8.1 Mexico Leukemia Therapeutics Market Estimates and Forecasts, By Type of Leukemia (2020-2032) (USD Billion)
11.2.8.2 Mexico Leukemia Therapeutics Market Estimates and Forecasts, By Treatment Type (2020-2032) (USD Billion)
11.2.8.3 Mexico Leukemia Therapeutics Market Estimates and Forecasts, By Route of administration (2020-2032) (USD Billion)
11.2.8.3 Mexico Leukemia Therapeutics Market Estimates and Forecasts, By Distribution Channels (2020-2032) (USD Billion)
11.3 Europe
11.3.1 Eastern Europe
11.3.1.1 Trends Analysis
11.3.1.2 Eastern Europe Leukemia Therapeutics Market Estimates and Forecasts, by Country (2020-2032) (USD Billion)
11.3.1.3 Eastern Europe Leukemia Therapeutics Market Estimates and Forecasts, By Type of Leukemia (2020-2032) (USD Billion)
11.3.1.4 Eastern Europe Leukemia Therapeutics Market Estimates and Forecasts, By Treatment Type (2020-2032) (USD Billion)
11.3.1.5 Eastern Europe Leukemia Therapeutics Market Estimates and Forecasts, By Route of administration (2020-2032) (USD Billion)
11.3.1.5 Eastern Europe Leukemia Therapeutics Market Estimates and Forecasts, By Distribution Channels (2020-2032) (USD Billion)
11.3.1.6 Poland
11.3.1.6.1 Poland Leukemia Therapeutics Market Estimates and Forecasts, By Type of Leukemia (2020-2032) (USD Billion)
11.3.1.6.2 Poland Leukemia Therapeutics Market Estimates and Forecasts, By Treatment Type (2020-2032) (USD Billion)
11.3.1.6.3 Poland Leukemia Therapeutics Market Estimates and Forecasts, By Route of administration (2020-2032) (USD Billion)
11.3.1.6.3 Poland Leukemia Therapeutics Market Estimates and Forecasts, By Distribution Channels (2020-2032) (USD Billion)
11.3.1.7 Romania
11.3.1.7.1 Romania Leukemia Therapeutics Market Estimates and Forecasts, By Type of Leukemia (2020-2032) (USD Billion)
11.3.1.7.2 Romania Leukemia Therapeutics Market Estimates and Forecasts, By Treatment Type (2020-2032) (USD Billion)
11.3.1.7.3 Romania Leukemia Therapeutics Market Estimates and Forecasts, By Route of administration (2020-2032) (USD Billion)
11.3.1.7.3 Romania Leukemia Therapeutics Market Estimates and Forecasts, By Distribution Channels (2020-2032) (USD Billion)
11.3.1.8 Hungary
11.3.1.8.1 Hungary Leukemia Therapeutics Market Estimates and Forecasts, By Type of Leukemia (2020-2032) (USD Billion)
11.3.1.8.2 Hungary Leukemia Therapeutics Market Estimates and Forecasts, By Treatment Type (2020-2032) (USD Billion)
11.3.1.8.3 Hungary Leukemia Therapeutics Market Estimates and Forecasts, By Route of administration (2020-2032) (USD Billion)
11.3.1.8.3 Hungary Leukemia Therapeutics Market Estimates and Forecasts, By Distribution Channels (2020-2032) (USD Billion)
11.3.1.9 Turkey
11.3.1.9.1 Turkey Leukemia Therapeutics Market Estimates and Forecasts, By Type of Leukemia (2020-2032) (USD Billion)
11.3.1.9.2 Turkey Leukemia Therapeutics Market Estimates and Forecasts, By Treatment Type (2020-2032) (USD Billion)
11.3.1.9.3 Turkey Leukemia Therapeutics Market Estimates and Forecasts, By Route of administration (2020-2032) (USD Billion)
11.3.1.9.3 Turkey Leukemia Therapeutics Market Estimates and Forecasts, By Distribution Channels (2020-2032) (USD Billion)
11.3.1.11 Rest of Eastern Europe
11.3.1.11.1 Rest of Eastern Europe Leukemia Therapeutics Market Estimates and Forecasts, By Type of Leukemia (2020-2032) (USD Billion)
11.3.1.11.2 Rest of Eastern Europe Leukemia Therapeutics Market Estimates and Forecasts, By Treatment Type (2020-2032) (USD Billion)
11.3.1.11.3 Rest of Eastern Europe Leukemia Therapeutics Market Estimates and Forecasts, By Route of administration (2020-2032) (USD Billion)
11.3.1.11.3 Rest of Eastern Europe Leukemia Therapeutics Market Estimates and Forecasts, By Distribution Channels (2020-2032) (USD Billion)
11.3.2 Western Europe
11.3.2.1 Trends Analysis
11.3.2.2 Western Europe Leukemia Therapeutics Market Estimates and Forecasts, by Country (2020-2032) (USD Billion)
11.3.2.3 Western Europe Leukemia Therapeutics Market Estimates and Forecasts, By Type of Leukemia (2020-2032) (USD Billion)
11.3.2.4 Western Europe Leukemia Therapeutics Market Estimates and Forecasts, By Treatment Type (2020-2032) (USD Billion)
11.3.2.5 Western Europe Leukemia Therapeutics Market Estimates and Forecasts, By Route of administration (2020-2032) (USD Billion)
11.3.2.5 Western Europe Leukemia Therapeutics Market Estimates and Forecasts, By Distribution Channels (2020-2032) (USD Billion)
11.3.2.6 Germany
11.3.2.6.1 Germany Leukemia Therapeutics Market Estimates and Forecasts, By Type of Leukemia (2020-2032) (USD Billion)
11.3.2.6.2 Germany Leukemia Therapeutics Market Estimates and Forecasts, By Treatment Type (2020-2032) (USD Billion)
11.3.2.6.3 Germany Leukemia Therapeutics Market Estimates and Forecasts, By Route of administration (2020-2032) (USD Billion)
11.3.2.6.3 Germany Leukemia Therapeutics Market Estimates and Forecasts, By Distribution Channels (2020-2032) (USD Billion)
11.3.2.7 France
11.3.2.7.1 France Leukemia Therapeutics Market Estimates and Forecasts, By Type of Leukemia (2020-2032) (USD Billion)
11.3.2.7.2 France Leukemia Therapeutics Market Estimates and Forecasts, By Treatment Type (2020-2032) (USD Billion)
11.3.2.7.3 France Leukemia Therapeutics Market Estimates and Forecasts, By Route of administration (2020-2032) (USD Billion)
11.3.2.7.3 France Leukemia Therapeutics Market Estimates and Forecasts, By Distribution Channels (2020-2032) (USD Billion)
11.3.2.8 UK
11.3.2.8.1 UK Leukemia Therapeutics Market Estimates and Forecasts, By Type of Leukemia (2020-2032) (USD Billion)
11.3.2.8.2 UK Leukemia Therapeutics Market Estimates and Forecasts, By Treatment Type (2020-2032) (USD Billion)
11.3.2.8.3 UK Leukemia Therapeutics Market Estimates and Forecasts, By Route of administration (2020-2032) (USD Billion)
11.3.2.8.3 UK Leukemia Therapeutics Market Estimates and Forecasts, By Distribution Channels (2020-2032) (USD Billion)
11.3.2.9 Italy
11.3.2.9.1 Italy Leukemia Therapeutics Market Estimates and Forecasts, By Type of Leukemia (2020-2032) (USD Billion)
11.3.2.9.2 Italy Leukemia Therapeutics Market Estimates and Forecasts, By Treatment Type (2020-2032) (USD Billion)
11.3.2.9.3 Italy Leukemia Therapeutics Market Estimates and Forecasts, By Route of administration (2020-2032) (USD Billion)
11.3.2.9.3 Italy Leukemia Therapeutics Market Estimates and Forecasts, By Distribution Channels (2020-2032) (USD Billion)
11.3.2.11 Spain
11.3.2.11.1 Spain Leukemia Therapeutics Market Estimates and Forecasts, By Type of Leukemia (2020-2032) (USD Billion)
11.3.2.11.2 Spain Leukemia Therapeutics Market Estimates and Forecasts, By Treatment Type (2020-2032) (USD Billion)
11.3.2.11.3 Spain Leukemia Therapeutics Market Estimates and Forecasts, By Route of administration (2020-2032) (USD Billion)
11.3.2.11.3 Spain Leukemia Therapeutics Market Estimates and Forecasts, By Distribution Channels (2020-2032) (USD Billion)
11.3.2.11 Netherlands
11.3.2.11.1 Netherlands Leukemia Therapeutics Market Estimates and Forecasts, By Type of Leukemia (2020-2032) (USD Billion)
11.3.2.11.2 Netherlands Leukemia Therapeutics Market Estimates and Forecasts, By Treatment Type (2020-2032) (USD Billion)
11.3.2.11.3 Netherlands Leukemia Therapeutics Market Estimates and Forecasts, By Route of administration (2020-2032) (USD Billion)
11.3.2.11.3 Netherlands Leukemia Therapeutics Market Estimates and Forecasts, By Distribution Channels (2020-2032) (USD Billion)
11.3.2.12 Switzerland
11.3.2.12.1 Switzerland Leukemia Therapeutics Market Estimates and Forecasts, By Type of Leukemia (2020-2032) (USD Billion)
11.3.2.12.2 Switzerland Leukemia Therapeutics Market Estimates and Forecasts, By Treatment Type (2020-2032) (USD Billion)
11.3.2.12.3 Switzerland Leukemia Therapeutics Market Estimates and Forecasts, By Route of administration (2020-2032) (USD Billion)
11.3.2.12.3 Switzerland Leukemia Therapeutics Market Estimates and Forecasts, By Distribution Channels (2020-2032) (USD Billion)
11.3.2.13 Austria
11.3.2.13.1 Austria Leukemia Therapeutics Market Estimates and Forecasts, By Type of Leukemia (2020-2032) (USD Billion)
11.3.2.13.2 Austria Leukemia Therapeutics Market Estimates and Forecasts, By Treatment Type (2020-2032) (USD Billion)
11.3.2.13.3 Austria Leukemia Therapeutics Market Estimates and Forecasts, By Route of administration (2020-2032) (USD Billion)
11.3.2.13.3 Austria Leukemia Therapeutics Market Estimates and Forecasts, By Distribution Channels (2020-2032) (USD Billion)
11.3.2.14 Rest of Western Europe
11.3.2.14.1 Rest of Western Europe Leukemia Therapeutics Market Estimates and Forecasts, By Type of Leukemia (2020-2032) (USD Billion)
11.3.2.14.2 Rest of Western Europe Leukemia Therapeutics Market Estimates and Forecasts, By Treatment Type (2020-2032) (USD Billion)
11.3.2.14.3 Rest of Western Europe Leukemia Therapeutics Market Estimates and Forecasts, By Route of administration (2020-2032) (USD Billion)
11.3.2.14.3 Rest of Western Europe Leukemia Therapeutics Market Estimates and Forecasts, By Distribution Channels (2020-2032) (USD Billion)
11.4 Asia Pacific
11.4.1 Trends Analysis
11.4.2 Asia Pacific Leukemia Therapeutics Market Estimates and Forecasts, by Country (2020-2032) (USD Billion)
11.4.3 Asia Pacific Leukemia Therapeutics Market Estimates and Forecasts, By Type of Leukemia (2020-2032) (USD Billion)
11.4.4 Asia Pacific Leukemia Therapeutics Market Estimates and Forecasts, By Treatment Type (2020-2032) (USD Billion)
11.4.5 Asia Pacific Leukemia Therapeutics Market Estimates and Forecasts, By Route of administration (2020-2032) (USD Billion)
11.4.5 Asia Pacific Leukemia Therapeutics Market Estimates and Forecasts, By Distribution Channels (2020-2032) (USD Billion)
11.4.6 China
11.4.6.1 China Leukemia Therapeutics Market Estimates and Forecasts, By Type of Leukemia (2020-2032) (USD Billion)
11.4.6.2 China Leukemia Therapeutics Market Estimates and Forecasts, By Treatment Type (2020-2032) (USD Billion)
11.4.6.3 China Leukemia Therapeutics Market Estimates and Forecasts, By Route of administration (2020-2032) (USD Billion)
11.4.6.3 China Leukemia Therapeutics Market Estimates and Forecasts, By Distribution Channels (2020-2032) (USD Billion)
11.4.7 India
11.4.7.1 India Leukemia Therapeutics Market Estimates and Forecasts, By Type of Leukemia (2020-2032) (USD Billion)
11.4.7.2 India Leukemia Therapeutics Market Estimates and Forecasts, By Treatment Type (2020-2032) (USD Billion)
11.4.7.3 India Leukemia Therapeutics Market Estimates and Forecasts, By Route of administration (2020-2032) (USD Billion)
11.4.7.3 India Leukemia Therapeutics Market Estimates and Forecasts, By Distribution Channels (2020-2032) (USD Billion)
11.4.8 Japan
11.4.8.1 Japan Leukemia Therapeutics Market Estimates and Forecasts, By Type of Leukemia (2020-2032) (USD Billion)
11.4.8.2 Japan Leukemia Therapeutics Market Estimates and Forecasts, By Treatment Type (2020-2032) (USD Billion)
11.4.8.3 Japan Leukemia Therapeutics Market Estimates and Forecasts, By Route of administration (2020-2032) (USD Billion)
11.4.8.3 Japan Leukemia Therapeutics Market Estimates and Forecasts, By Distribution Channels (2020-2032) (USD Billion)
11.4.9 South Korea
11.4.9.1 South Korea Leukemia Therapeutics Market Estimates and Forecasts, By Type of Leukemia (2020-2032) (USD Billion)
11.4.9.2 South Korea Leukemia Therapeutics Market Estimates and Forecasts, By Treatment Type (2020-2032) (USD Billion)
11.4.9.3 South Korea Leukemia Therapeutics Market Estimates and Forecasts, By Route of administration (2020-2032) (USD Billion)
11.4.9.3 South Korea Leukemia Therapeutics Market Estimates and Forecasts, By Distribution Channels (2020-2032) (USD Billion)
11.4.11 Vietnam
11.4.11.1 Vietnam Leukemia Therapeutics Market Estimates and Forecasts, By Type of Leukemia (2020-2032) (USD Billion)
11.4.11.2 Vietnam Leukemia Therapeutics Market Estimates and Forecasts, By Treatment Type (2020-2032) (USD Billion)
11.4.11.3 Vietnam Leukemia Therapeutics Market Estimates and Forecasts, By Route of administration (2020-2032) (USD Billion)
11.4.11.3 Vietnam Leukemia Therapeutics Market Estimates and Forecasts, By Distribution Channels (2020-2032) (USD Billion)
11.4.11 Singapore
11.4.11.1 Singapore Leukemia Therapeutics Market Estimates and Forecasts, By Type of Leukemia (2020-2032) (USD Billion)
11.4.11.2 Singapore Leukemia Therapeutics Market Estimates and Forecasts, By Treatment Type (2020-2032) (USD Billion)
11.4.11.3 Singapore Leukemia Therapeutics Market Estimates and Forecasts, By Route of administration (2020-2032) (USD Billion)
11.4.11.3 Singapore Leukemia Therapeutics Market Estimates and Forecasts, By Distribution Channels (2020-2032) (USD Billion)
11.4.12 Australia
11.4.12.1 Australia Leukemia Therapeutics Market Estimates and Forecasts, By Type of Leukemia (2020-2032) (USD Billion)
11.4.12.2 Australia Leukemia Therapeutics Market Estimates and Forecasts, By Treatment Type (2020-2032) (USD Billion)
11.4.12.3 Australia Leukemia Therapeutics Market Estimates and Forecasts, By Route of administration (2020-2032) (USD Billion)
11.4.12.3 Australia Leukemia Therapeutics Market Estimates and Forecasts, By Distribution Channels (2020-2032) (USD Billion)
11.4.13 Rest of Asia Pacific
11.4.13.1 Rest of Asia Pacific Leukemia Therapeutics Market Estimates and Forecasts, By Type of Leukemia (2020-2032) (USD Billion)
11.4.13.2 Rest of Asia Pacific Leukemia Therapeutics Market Estimates and Forecasts, By Treatment Type (2020-2032) (USD Billion)
11.4.13.3 Rest of Asia Pacific Leukemia Therapeutics Market Estimates and Forecasts, By Route of administration (2020-2032) (USD Billion)
11.4.13.3 Rest of Asia Pacific Leukemia Therapeutics Market Estimates and Forecasts, By Distribution Channels (2020-2032) (USD Billion)
11.5 Middle East and Africa
11.5.1 Middle East
11.5.1.1 Trends Analysis
11.5.1.2 Middle East Leukemia Therapeutics Market Estimates and Forecasts, by Country (2020-2032) (USD Billion)
11.5.1.3 Middle East Leukemia Therapeutics Market Estimates and Forecasts, By Type of Leukemia (2020-2032) (USD Billion)
11.5.1.4 Middle East Leukemia Therapeutics Market Estimates and Forecasts, By Treatment Type (2020-2032) (USD Billion)
11.5.1.5 Middle East Leukemia Therapeutics Market Estimates and Forecasts, By Route of administration (2020-2032) (USD Billion)
11.5.1.5 Middle East Leukemia Therapeutics Market Estimates and Forecasts, By Distribution Channels (2020-2032) (USD Billion)
11.5.1.6 UAE
11.5.1.6.1 UAE Leukemia Therapeutics Market Estimates and Forecasts, By Type of Leukemia (2020-2032) (USD Billion)
11.5.1.6.2 UAE Leukemia Therapeutics Market Estimates and Forecasts, By Treatment Type (2020-2032) (USD Billion)
11.5.1.6.3 UAE Leukemia Therapeutics Market Estimates and Forecasts, By Route of administration (2020-2032) (USD Billion)
11.5.1.6.3 UAE Leukemia Therapeutics Market Estimates and Forecasts, By Distribution Channels (2020-2032) (USD Billion)
11.5.1.7 Egypt
11.5.1.7.1 Egypt Leukemia Therapeutics Market Estimates and Forecasts, By Type of Leukemia (2020-2032) (USD Billion)
11.5.1.7.2 Egypt Leukemia Therapeutics Market Estimates and Forecasts, By Treatment Type (2020-2032) (USD Billion)
11.5.1.7.3 Egypt Leukemia Therapeutics Market Estimates and Forecasts, By Route of administration (2020-2032) (USD Billion)
11.5.1.7.3 Egypt Leukemia Therapeutics Market Estimates and Forecasts, By Distribution Channels (2020-2032) (USD Billion)
11.5.1.8 Saudi Arabia
11.5.1.8.1 Saudi Arabia Leukemia Therapeutics Market Estimates and Forecasts, By Type of Leukemia (2020-2032) (USD Billion)
11.5.1.8.2 Saudi Arabia Leukemia Therapeutics Market Estimates and Forecasts, By Treatment Type (2020-2032) (USD Billion)
11.5.1.8.3 Saudi Arabia Leukemia Therapeutics Market Estimates and Forecasts, By Route of administration (2020-2032) (USD Billion)
11.5.1.8.3 Saudi Arabia Leukemia Therapeutics Market Estimates and Forecasts, By Distribution Channels (2020-2032) (USD Billion)
11.5.1.9 Qatar
11.5.1.9.1 Qatar Leukemia Therapeutics Market Estimates and Forecasts, By Type of Leukemia (2020-2032) (USD Billion)
11.5.1.9.2 Qatar Leukemia Therapeutics Market Estimates and Forecasts, By Treatment Type (2020-2032) (USD Billion)
11.5.1.9.3 Qatar Leukemia Therapeutics Market Estimates and Forecasts, By Route of administration (2020-2032) (USD Billion)
11.5.1.9.3 Qatar Leukemia Therapeutics Market Estimates and Forecasts, By Distribution Channels (2020-2032) (USD Billion)
11.5.1.11 Rest of Middle East
11.5.1.11.1 Rest of Middle East Leukemia Therapeutics Market Estimates and Forecasts, By Type of Leukemia (2020-2032) (USD Billion)
11.5.1.11.2 Rest of Middle East Leukemia Therapeutics Market Estimates and Forecasts, By Treatment Type (2020-2032) (USD Billion)
11.5.1.11.3 Rest of Middle East Leukemia Therapeutics Market Estimates and Forecasts, By Route of administration (2020-2032) (USD Billion)
11.5.1.11.3 Rest of Middle East Leukemia Therapeutics Market Estimates and Forecasts, By Distribution Channels (2020-2032) (USD Billion)
11.5.2 Africa
11.5.2.1 Trends Analysis
11.5.2.2 Africa Leukemia Therapeutics Market Estimates and Forecasts, by Country (2020-2032) (USD Billion)
11.5.2.3 Africa Leukemia Therapeutics Market Estimates and Forecasts, By Type of Leukemia (2020-2032) (USD Billion)
11.5.2.4 Africa Leukemia Therapeutics Market Estimates and Forecasts, By Treatment Type (2020-2032) (USD Billion)
11.5.2.5 Africa Leukemia Therapeutics Market Estimates and Forecasts, By Route of administration (2020-2032) (USD Billion)
11.5.2.8.3 Africa Leukemia Therapeutics Market Estimates and Forecasts, By Distribution Channels (2020-2032) (USD Billion)
11.5.2.6 South Africa
11.5.2.6.1 South Africa Leukemia Therapeutics Market Estimates and Forecasts, By Type of Leukemia (2020-2032) (USD Billion)
11.5.2.6.2 South Africa Leukemia Therapeutics Market Estimates and Forecasts, By Treatment Type (2020-2032) (USD Billion)
11.5.2.6.3 South Africa Leukemia Therapeutics Market Estimates and Forecasts, By Route of administration (2020-2032) (USD Billion)
11.5.2.8.3 South Africa Leukemia Therapeutics Market Estimates and Forecasts, By Distribution Channels (2020-2032) (USD Billion)
11.5.2.7 Nigeria
11.5.2.7.1 Nigeria Leukemia Therapeutics Market Estimates and Forecasts, By Type of Leukemia (2020-2032) (USD Billion)
11.5.2.7.2 Nigeria Leukemia Therapeutics Market Estimates and Forecasts, By Treatment Type (2020-2032) (USD Billion)
11.5.2.7.3 Nigeria Leukemia Therapeutics Market Estimates and Forecasts, By Route of administration (2020-2032) (USD Billion)
11.5.2.8.3 Nigeria Leukemia Therapeutics Market Estimates and Forecasts, By Distribution Channels (2020-2032) (USD Billion)
11.5.2.8 Rest of Africa
11.5.2.8.1 Rest of Africa Leukemia Therapeutics Market Estimates and Forecasts, By Type of Leukemia (2020-2032) (USD Billion)
11.5.2.8.2 Rest of Africa Leukemia Therapeutics Market Estimates and Forecasts, By Treatment Type (2020-2032) (USD Billion)
11.5.2.8.3 Rest of Africa Leukemia Therapeutics Market Estimates and Forecasts, By Route of administration (2020-2032) (USD Billion)
11.5.2.8.3 Rest of Africa Leukemia Therapeutics Market Estimates and Forecasts, By Distribution Channels (2020-2032) (USD Billion)
11.6 Latin America
11.6.1 Trends Analysis
11.6.2 Latin America Leukemia Therapeutics Market Estimates and Forecasts, by Country (2020-2032) (USD Billion)
11.6.3 Latin America Leukemia Therapeutics Market Estimates and Forecasts, By Type of Leukemia (2020-2032) (USD Billion)
11.6.4 Latin America Leukemia Therapeutics Market Estimates and Forecasts, By Treatment Type (2020-2032) (USD Billion)
11.6.5 Latin America Leukemia Therapeutics Market Estimates and Forecasts, By Route of administration (2020-2032) (USD Billion)
11.6.5 Latin America Leukemia Therapeutics Market Estimates and Forecasts, By Distribution Channels (2020-2032) (USD Billion)
11.6.6 Brazil
11.6.6.1 Brazil Leukemia Therapeutics Market Estimates and Forecasts, By Type of Leukemia (2020-2032) (USD Billion)
11.6.6.2 Brazil Leukemia Therapeutics Market Estimates and Forecasts, By Treatment Type (2020-2032) (USD Billion)
11.6.6.3 Brazil Leukemia Therapeutics Market Estimates and Forecasts, By Route of administration (2020-2032) (USD Billion)
11.6.6.3 Brazil Leukemia Therapeutics Market Estimates and Forecasts, By Distribution Channels (2020-2032) (USD Billion)
11.6.7 Argentina
11.6.7.1 Argentina Leukemia Therapeutics Market Estimates and Forecasts, By Type of Leukemia (2020-2032) (USD Billion)
11.6.7.2 Argentina Leukemia Therapeutics Market Estimates and Forecasts, By Treatment Type (2020-2032) (USD Billion)
11.6.7.3 Argentina Leukemia Therapeutics Market Estimates and Forecasts, By Route of administration (2020-2032) (USD Billion)
11.6.7.3 Argentina Leukemia Therapeutics Market Estimates and Forecasts, By Distribution Channels (2020-2032) (USD Billion)
11.6.8 Colombia
11.6.8.1 Colombia Leukemia Therapeutics Market Estimates and Forecasts, By Type of Leukemia (2020-2032) (USD Billion)
11.6.8.2 Colombia Leukemia Therapeutics Market Estimates and Forecasts, By Treatment Type (2020-2032) (USD Billion)
11.6.8.3 Colombia Leukemia Therapeutics Market Estimates and Forecasts, By Route of administration (2020-2032) (USD Billion)
11.6.8.3 Colombia Leukemia Therapeutics Market Estimates and Forecasts, By Distribution Channels (2020-2032) (USD Billion)
11.6.9 Rest of Latin America
11.6.9.1 Rest of Latin America Leukemia Therapeutics Market Estimates and Forecasts, By Type of Leukemia (2020-2032) (USD Billion)
11.6.9.2 Rest of Latin America Leukemia Therapeutics Market Estimates and Forecasts, By Treatment Type (2020-2032) (USD Billion)
11.6.9.3 Rest of Latin America Leukemia Therapeutics Market Estimates and Forecasts, By Route of administration (2020-2032) (USD Billion)
11.6.9.3 Rest of Latin America Leukemia Therapeutics Market Estimates and Forecasts, By Distribution Channels (2020-2032) (USD Billion)
12. Company Profiles
12.1 Novartis International AG
12.1.1 Company Overview
12.1.2 Financial
12.1.3 Products/ Services Offered
12.1.4 SWOT Analysis
12.2 AbbVie Inc.
12.2.1 Company Overview
12.2.2 Financial
12.2.3 Products/ Services Offered
12.2.4 SWOT Analysis
12.3 Bristol-Myers Squibb Company
12.3.1 Company Overview
12.3.2 Financial
12.3.3 Products/ Services Offered
12.3.4 SWOT Analysis
12.4 F. Hoffmann-La Roche Ltd
12.4.1 Company Overview
12.4.2 Financial
12.4.3 Products/ Services Offered
12.4.4 SWOT Analysis
12.5 Sanofi S.A.
12.5.1 Company Overview
12.5.2 Financial
12.5.3 Products/ Services Offered
12.5.4 SWOT Analysis
12.6 Pfizer Inc.
12.6.1 Company Overview
12.6.2 Financial
12.6.3 Products/ Services Offered
12.6.4 SWOT Analysis
12.7 Amgen Inc.
12.7.1 Company Overview
12.7.2 Financial
12.7.3 Products/ Services Offered
12.7.4 SWOT Analysis
12.8 Gilead Sciences, Inc.
12.8.1 Company Overview
12.8.2 Financial
12.8.3 Products/ Services Offered
12.8.4 SWOT Analysis
12.9 Takeda Pharmaceutical Company Limited
12.9.1 Company Overview
12.9.2 Financial
12.9.3 Products/ Services Offered
12.9.4 SWOT Analysis
12.10 Celgene Corporation
12.10.1 Company Overview
12.10.2 Financial
12.10.3 Products/ Services Offered
12.10.4 SWOT Analysis
13. Use Cases and Best Practices
14. Conclusion
An accurate research report requires proper strategizing as well as implementation. There are multiple factors involved in the completion of good and accurate research report and selecting the best methodology to compete the research is the toughest part. Since the research reports we provide play a crucial role in any company’s decision-making process, therefore we at SNS Insider always believe that we should choose the best method which gives us results closer to reality. This allows us to reach at a stage wherein we can provide our clients best and accurate investment to output ratio.
Each report that we prepare takes a timeframe of 350-400 business hours for production. Starting from the selection of titles through a couple of in-depth brain storming session to the final QC process before uploading our titles on our website we dedicate around 350 working hours. The titles are selected based on their current market cap and the foreseen CAGR and growth.
The 5 steps process:
Step 1: Secondary Research:
Secondary Research or Desk Research is as the name suggests is a research process wherein, we collect data through the readily available information. In this process we use various paid and unpaid databases which our team has access to and gather data through the same. This includes examining of listed companies’ annual reports, Journals, SEC filling etc. Apart from this our team has access to various associations across the globe across different industries. Lastly, we have exchange relationships with various university as well as individual libraries.

Step 2: Primary Research
When we talk about primary research, it is a type of study in which the researchers collect relevant data samples directly, rather than relying on previously collected data. This type of research is focused on gaining content specific facts that can be sued to solve specific problems. Since the collected data is fresh and first hand therefore it makes the study more accurate and genuine.
We at SNS Insider have divided Primary Research into 2 parts.
Part 1 wherein we interview the KOLs of major players as well as the upcoming ones across various geographic regions. This allows us to have their view over the market scenario and acts as an important tool to come closer to the accurate market numbers. As many as 45 paid and unpaid primary interviews are taken from both the demand and supply side of the industry to make sure we land at an accurate judgement and analysis of the market.
This step involves the triangulation of data wherein our team analyses the interview transcripts, online survey responses and observation of on filed participants. The below mentioned chart should give a better understanding of the part 1 of the primary interview.

Part 2: In this part of primary research the data collected via secondary research and the part 1 of the primary research is validated with the interviews from individual consultants and subject matter experts.
Consultants are those set of people who have at least 12 years of experience and expertise within the industry whereas Subject Matter Experts are those with at least 15 years of experience behind their back within the same space. The data with the help of two main processes i.e., FGDs (Focused Group Discussions) and IDs (Individual Discussions). This gives us a 3rd party nonbiased primary view of the market scenario making it a more dependable one while collation of the data pointers.
Step 3: Data Bank Validation
Once all the information is collected via primary and secondary sources, we run that information for data validation. At our intelligence centre our research heads track a lot of information related to the market which includes the quarterly reports, the daily stock prices, and other relevant information. Our data bank server gets updated every fortnight and that is how the information which we collected using our primary and secondary information is revalidated in real time.

Step 4: QA/QC Process
After all the data collection and validation our team does a final level of quality check and quality assurance to get rid of any unwanted or undesired mistakes. This might include but not limited to getting rid of the any typos, duplication of numbers or missing of any important information. The people involved in this process include technical content writers, research heads and graphics people. Once this process is completed the title gets uploader on our platform for our clients to read it.
Step 5: Final QC/QA Process:
This is the last process and comes when the client has ordered the study. In this process a final QA/QC is done before the study is emailed to the client. Since we believe in giving our clients a good experience of our research studies, therefore, to make sure that we do not lack at our end in any way humanly possible we do a final round of quality check and then dispatch the study to the client.
Key Segments:
By Type of Leukemia
Chronic Myeloid Leukemia (CML)
Acute Lymphocytic Leukemia (ALL)
Chronic Lymphocytic Leukemia (CLL)
Acute Myeloid Leukemia (AML)
Others
By Route of Administration
Oral
Injectable
By Treatment Type
Chemotherapy
Immunotherapy
Targeted Therapy
Others
By Distribution Channels
Hospital Pharmacy
Retail Pharmacy
Others
Request for Segment Customization as per your Business Requirement: Segment Customization Request
REGIONAL COVERAGE:
North America
US
Canada
Mexico
Europe
Eastern Europe
Poland
Romania
Hungary
Turkey
Rest of Eastern Europe
Western Europe
Germany
France
UK
Italy
Spain
Netherlands
Switzerland
Austria
Rest of Western Europe
Asia Pacific
China
India
Japan
South Korea
Vietnam
Singapore
Australia
Rest of Asia Pacific
Middle East & Africa
Middle East
UAE
Egypt
Saudi Arabia
Qatar
Rest of the Middle East
Africa
Nigeria
South Africa
Rest of Africa
Latin America
Brazil
Argentina
Colombia
Rest of Latin America
Request for Country Level Research Report: Country Level Customization Request
Available Customization
With the given market data, SNS Insider offers customization as per the company’s specific needs. The following customization options are available for the report:
Product Analysis
Criss-Cross segment analysis (e.g. Product X Application)
Product Matrix which gives a detailed comparison of product portfolio of each company
Geographic Analysis
Additional countries in any of the regions
Company Information
Detailed analysis and profiling of additional market players (Up to five)
The global Near infrared Imaging Market size is expected to grow from USD 2.17 billion in 2023 to USD 3.1 billion by 2032 at a CAGR of 4.0%.
The Osteoarthritis Therapeutics Market was valued at USD 8.65 billion in 2023 and is expected to reach USD 18.09 billion by 2032, growing at a CAGR of 8.52% from 2024 to 2032.
The Transfection Reagents & Equipment Market was USD 1.26 Billion in 2023, projected to reach USD 2.54 Billion by 2032 with a CAGR of 8.12% from 2024-2032.
Companion Animal Health Market Size was valued at USD 24.1 Billion in 2023 and is expected to reach USD 51.15 Billion by 2032, growing at a CAGR of 8.74% over the forecast period 2024-2032.
The Hospital Services Market size was estimated at USD 4.38 trillion in 2023 and is expected to reach USD 6.74 trillion by 2032 at a CAGR of 5.08% during the forecast period of 2024-2032.
The Neuroprosthetics Market size was valued at USD 12.69 billion in 2023 and is expected to reach USD 38.93 billion by 2032, growing at a CAGR of 13.28%.

Hi! Click one of our member below to chat on Phone
© 2025 All Rights Reserved by SNS Insider Pvt Ltd


