image

Legal Marijuana Market Report Scope & Overview:

Legal Marijuana Market Revenue Analysis

Get more information on Legal Marijuana Market - Request Sample Report

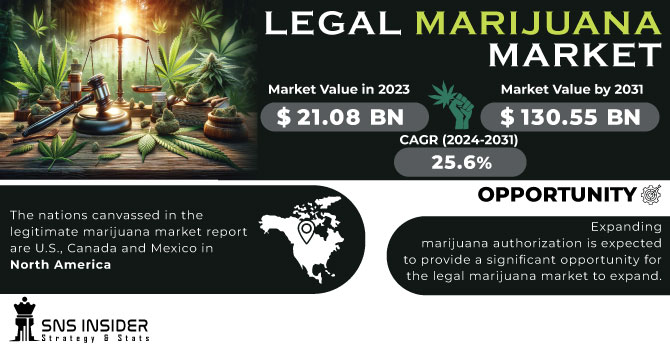
The Legal Marijuana Market Size was valued at USD 26.0 billion in 2023 and is expected to reach USD 146.9 billion by 2032, growing at a CAGR of 21.2% over the forecast period 2024-2032. 

This Legal Marijuana Market report includes progressive regulatory reforms and the increasing prevalence of medical and recreational cannabis consumption. The report features updated data on government legalization efforts, tax revenues, and, showcasing the rapid absorbance of the sector into healthcare and economic functionality. The report also explores the regulatory landscape and licensing trends, covering compliance requirements, taxation policies, and market expansion challenges. Additionally, it examines the medical vs. recreational market share, detailing patient access programs, prescription trends, and the rising demand for recreational cannabis

Market Dynamics

Drivers

  • The rescheduling of cannabis under federal law in the U.S. may ease regulatory burdens, driving market growth.

The regulatory environment for cannabis, particularly in the US, has turned from prohibitive to permissive. One of the most notable changes was the rescheduling of cannabis from Schedule I to Schedule III under the U.S. Controlled Substances Act in 2023. This will alleviate the tax burden on cannabis businesses, leading to a broader enabling environment, including tax write-offs compared to other sectors. For instance, Section 280E of the Internal Revenue Code prevented cannabis growing businesses from taking deductions because it prohibits any business that participates in what the federal law considers illegal activity from being able to take any deductions. This change will probably provide a huge tax reduction and allow the sector to move further forward. The international momentum is growing too, so much so that even Germany which is getting ready to legalize adult-use cannabis, is hinting at more regulation changes normalizing the next steps. The legalization of more jurisdictions allows more space for cannabis businesses to grow and new markets to enter, facilitating more robust industry growth. With legislative advancements such as these, the cannabis market is poised for long-term development.

Restraint

  • Complex and inconsistent regulations across different jurisdictions create compliance challenges for businesses.

The regulatory challenges in the legal marijuana market are significant barriers to growth. With the continued growth of the industry, businesses face difficulties navigating a complex web of local, state, and federal regulations. For instance, the U.S. law cannabis remains is listed as a federal Schedule I drug, and this creates a fractured legal system that sometimes permits cannabis and other times does not from state to state. The variation between rules makes it difficult for operators to comply, with companies needing to follow two or more rules within varied jurisdictions. Cannabis taxes are expected to surpass USD 1 billion in California alone by 2024, but licensing and tax structures remain unpredictable and at the mercy of local governments. Moreover, the absence of uniform regulations regarding testing, labelling, and advertising for products can create challenges for legal clarity and enforcement. Such regulatory fragmentation slows market adoption and creates operating challenges.

Opportunity

  • Many countries explore the possibility of legalization, there are considerable opportunities for international trade and market growth.

One of the greatest opportunities in legal marijuana is the expansion of the global market, which is made a reality by more and more countries considering or implementing legalization. As of 2024, 25 countries have legalized cannabis in some form, ranging from medical use to full recreational use. This trend is expected to accelerate, with Canada, Uruguay, and select U.S. states serving as key models for successful integration. In Europe, countries like Germany, which is in the process of rolling out recreational cannabis, are likely to expand the market further. For instance, Germany is projected to launch its adult-use cannabis market by 2025, a move that is expected to drive economic growth in the region. Furthermore, legal cannabis imports are growing; the Netherlands has reported an uptick in cannabis exports, particularly to neighboring European countries where regulations are still evolving. This expansion is fuelled by the rising acceptance of cannabis and its medical benefits, creating untapped markets across the globe.

Challenge

  • Potential mental health impacts and safety issues like impaired driving pose challenges to industry growth.

The legalization of marijuana has raised significant public health concerns, particularly regarding its impact on cognitive function and mental health. A new study from the University of Colorado Anschutz School of Medicine published in the journal JAMA Network Open looked at 1,000 people ages 22 to 36. More than 63% of those who qualified as heavy lifetime cannabis users showed decreased brain activity while performing tests on their working memory, and nearly 68% of recent users showed similar impairment. It is essential to activities like driving or talking. Also, one study from the University of Southern California found that the risk of developing head and neck cancers was 3.5 to 5 times greater in regular heavy cannabis users than in non-smokers. These cancers consist of cancers of the lips, oral cavity, pharynx, larynx, salivary glands, and thyroid among others.

Segment analysis

By Application

The medical segment accounted for 78% of the global revenue in 2023, owing to its application in chronic pain treatment and neurological illnesses. According to the National Institutes of Health (NIH), prescriptions of medical cannabis increased by 28% annually between 2020 and 2023, with 36 states reporting efficacy in epilepsy and symptoms associated with cancer. According to federal agencies such as the CDC, one case for this increase is cannabis’ ability to help decrease reliance on opioids, with 42% of patients with chronic pain choosing treatments that include cannabis.

In contrast, the adult-use segment is predicted to grow at the highest CAGR over the forecast period of 2024-2032, driven by recreational legalization in Ohio in 2024, and expected USD 58 billion in U.S. sales by 2030. For example, In 2024, the number of adult-use licenses issued expanded by 35% compared to prior years in states such as New York and New Jersey, where consumers were shifting toward regulated markets.

By Product Type

In 2023, the oil and tinctures segment accounted for the largest share of revenue 54% for this segment, due to accurate dosing and some CBD oils and tinctures being FDA-approved to treat epilepsy and multiple sclerosis. One example includes how sales of tinctures in Florida soared 50% following legalization after the FDA approved CBD-based Epidiolex in 2023. Regulatory mandates, such as Colorado’s 2022 THC labeling requirements, enhanced consumer trust, driving a 40% increase in oil adoption for chronic conditions. Trend data up through 2021–2023 shows hybrid product innovations, including balanced tinctures, contributed to a 22% annual growth in this segment.

Regional Analysis

North America region dominated the market in 2023, and held for 76% of the market share. U.S. recreational cannabis sales surpassed USD 35.2 billion in 2024, with California contributing USD 7.2 billion. However, the anticipated benefits of legalization, such as reduced opioid addiction and crime rates, have not fully materialized. Instead, daily cannabis users have exploded from 2.5 million to 17.7 million, while the strength of the drug has tripled. All of these trends have sparked fears of cognitive impairment, more accidents, and higher levels of mental illness. In Canada, however, the market is grappling with the dual factors of an inflated supply and competition from the illicit market. Canadian companies are looking abroad, including Germany, to expand to become more competitive.

The Asia-Pacific region is expected to witness in fastest compound annual growth rate (CAGR) over the forecast period. Consistently growing legal frameworks, increasing acceptance of medical cannabis, and Increasing demand for both recreational and medicinal marijuana products are driving this growth. Countries like Japan, South Korea, and Thailand are expanding their cannabis markets, with medical cannabis gaining regulatory approval. Furthermore, the region's large population and increasing awareness of cannabis health benefits are fueling consumer interest. These factors are expected to propel market expansion at an accelerated pace during the forecast period.

Key Players

Key Service Providers/Manufacturers

  • Canopy Growth Corporation (Tweed, Spectrum Cannabis)

  • Aurora Cannabis Inc. (Aurora Sky, Aurora Drift)

  • Cronos Group (Peace Naturals, COVE)

  • Tilray, Inc. (Tilray, Aphria)

  • Hexo Corp. (Hexo, Redecan)

  • Charlotte's Web Holdings, Inc. (Charlotte's Web Hemp Extract, CBD Capsules)

  • Organigram Holdings Inc. (Organigram, Edison Cannabis Co.)

  • GW Pharmaceuticals (Epidiolex, Sativex)

  • Green Thumb Industries (Rythm, Dogwalkers)

  • Trulieve (Trulieve Cannabis, Muse)

Users of Services and Products:

  • MedMen

  • Curaleaf

  • The Green Organic Dutchman

  • Harvest Health & Recreation

  • Columbia Care

  • Cresco Labs

  • Verano Holdings

  • Acreage Holdings

  • Greenlane Holdings

  • Marimed Inc.

Recent Developments

  • In January 2025, The U.S. DEA proposed reclassifying cannabis as a Schedule III drug, exempting businesses from IRS Section 280E taxes and potentially saving the industry USD 2 billion annually.

  • Oklahoma’s Packaging Regulations in December 2024, New laws mandated pre-packaged products and stringent licensing to curb illicit trade, aligning with FDA safety standards.

  • Thailand’s Hemp Expansion in September 2024, Legislation permitted hemp use in cosmetics and food, targeting a USD 765 million market by 2029 while restricting non-medical cannabis.

Legal Marijuana Market Report Scope:

Report Attributes Details
Market Size in 2023 USD 26 Billion 
Market Size by 2032 USD 146.9 Billion 
CAGR CAGR of 21.2% From 2024 to 2032
Base Year 2023
Forecast Period 2024-2032
Historical Data 2020-2022
Report Scope & Coverage Market Size, Segments Analysis, Competitive  Landscape, Regional Analysis, DROC & SWOT Analysis, Forecast Outlook
Key Segments • By Product Type (Flower, Oil & Tinctures)
• By Application (Medical, Adult Use)
Regional Analysis/Coverage North America (US, Canada, Mexico), Europe (Eastern Europe [Poland, Romania, Hungary, Turkey, Rest of Eastern Europe] Western Europe] Germany, France, UK, Italy, Spain, Netherlands, Switzerland, Austria, Rest of Western Europe]), Asia Pacific (China, India, Japan, South Korea, Vietnam, Singapore, Australia, Rest of Asia Pacific), Middle East & Africa (Middle East [UAE, Egypt, Saudi Arabia, Qatar, Rest of Middle East], Africa [Nigeria, South Africa, Rest of Africa], Latin America (Brazil, Argentina, Colombia, Rest of Latin America)
Company Profiles Canopy Growth Corporation, Aurora Cannabis Inc., Cronos Group, Tilray, Inc., Hexo Corp., Charlotte's Web Holdings, Inc., Organigram Holdings Inc., GW Pharmaceuticals, Green Thumb Industries, Trulieve.

Frequently Asked Questions

Ans. The projected market size for the Legal Marijuana Market is USD 146.9 Billion by 2032.

Ans: The Asia Pacific region is growing with the fastest CAGR in the Legal Marijuana Market over the forecast period.

Ans. The CAGR of the Legal Marijuana Market is 21.2% During the forecast period of 2024-2032.

Ans:  The Strategic Initiatives provided under the Legal Marijuana Market report,

  • Marketing and promotional activities

  • Distribution and supply chain strategies

  • Expansion plans and new product launches

  • Strategic partnerships and collaborations

  • Technological Advancements

  • Market Positioning and Branding

Ans:  The Medical Application segment dominated the Legal Marijuana Market

Table of Contents

1. Introduction

1.1 Market Definition

1.2 Scope (Inclusion and Exclusions)

1.3 Research Assumptions

2. Executive Summary

2.1 Market Overview

2.2 Regional Synopsis

2.3 Competitive Summary

3. Research Methodology

3.1 Top-Down Approach

3.2 Bottom-up Approach

3.3. Data Validation

3.4 Primary Interviews

4. Market Dynamics Impact Analysis

4.1 Market Driving Factors Analysis

4.1.2 Drivers

4.1.2 Restraints

4.1.3 Opportunities

4.1.4 Challenges

4.2 PESTLE Analysis

4.3 Porter’s Five Forces Model

5. Statistical Insights and Trends Reporting

5.1 Product Sales Volume, by Type (2023)

5.2 Regulatory Landscape & Licensing Trends (2023)

5.3 Medical vs. Recreational Market Share (2023)

6. Competitive Landscape

6.1 List of Major Companies, By Region

6.2 Market Share Analysis, By Region

6.3 Product Benchmarking

6.3.1 Product specifications and features

6.3.2 Pricing

6.4 Strategic Initiatives

6.4.1 Marketing and promotional activities

6.4.2 Distribution and supply chain strategies

6.4.3 Expansion plans and new product launches

6.4.4 Strategic partnerships and collaborations

6.5 Technological Advancements

6.6 Market Positioning and Branding

7. Legal Marijuana Market Segmentation, By Product Type

7.1 Chapter Overview

7.2 Flower

7.2.1 Flower Market Trends Analysis (2020-2032)

7.2.2 Flower Market Size Estimates and Forecasts to 2032 (USD Billion)

7.3 Oil & Tinctures

7.3.1 Oil & Tinctures Market Trends Analysis (2020-2032)

7.3.2 Oil & Tinctures Market Size Estimates and Forecasts to 2032 (USD Billion)

8. Legal Marijuana Market Segmentation, By Application

8.1 Chapter Overview

8.2 Medical

8.2.1 Medical Market Trends Analysis (2020-2032)

8.2.2 Medical Market Size Estimates and Forecasts to 2032 (USD Billion)

8.2.3 Cancer

8.2.3.1 Cancer Market Trends Analysis (2020-2032)

8.2.3.2 Cancer Market Size Estimates and Forecasts to 2032 (USD Billion)

8.2.4 Chronic Pain

8.2.4.1 Chronic Pain Market Trends Analysis (2020-2032)

8.2.4.2 Chronic Pain Market Size Estimates and Forecasts to 2032 (USD Billion)

8.2.5 Diabetes

8.2.5.1 Diabetes Market Trends Analysis (2020-2032)

8.2.5.2 Diabetes Market Size Estimates and Forecasts to 2032 (USD Billion)

8.2.6 Depression and Anxiety

8.2.6.1 Depression and Anxiety Market Trends Analysis (2020-2032)

8.2.6.2 Depression and Anxiety Market Size Estimates and Forecasts to 2032 (USD Billion)

8.2.7 Epilepsy

8.2.7.1 Epilepsy Market Trends Analysis (2020-2032)

8.2.7.2 Epilepsy Market Size Estimates and Forecasts to 2032 (USD Billion)

8.2.8 Glaucoma

8.2.8.1 Glaucoma Market Trends Analysis (2020-2032)

8.2.8.2 Glaucoma Market Size Estimates and Forecasts to 2032 (USD Billion)

8.2.9 Migraines

8.2.9.1 Migraines Market Trends Analysis (2020-2032)

8.2.9.2 Migraines Market Size Estimates and Forecasts to 2032 (USD Billion)

8.2.10 Arthritis

8.2.10.1 Arthritis Market Trends Analysis (2020-2032)

8.2.10.2 Arthritis Market Size Estimates and Forecasts to 2032 (USD Billion)

8.2.11 AIDS

8.2.11.1 AIDS Market Trends Analysis (2020-2032)

8.2.11.2 AIDS Market Size Estimates and Forecasts to 2032 (USD Billion)

8.2.12 Amyotrophic Lateral Sclerosis

8.2.12.1 Amyotrophic Lateral Sclerosis Market Trends Analysis (2020-2032)

8.2.12.2 Amyotrophic Lateral Sclerosis Market Size Estimates and Forecasts to 2032 (USD Billion)

8.2.13 Multiple Sclerosis

8.2.13.1 Multiple Sclerosis Market Trends Analysis (2020-2032)

8.2.13.2 Multiple Sclerosis Market Size Estimates and Forecasts to 2032 (USD Billion)

8.2.14 Post-Traumatic Stress Disorder (PTSD)

8.2.14.1 Post-Traumatic Stress Disorder (PTSD) Market Trends Analysis (2020-2032)

8.2.14.2 Post-Traumatic Stress Disorder (PTSD) Market Size Estimates and Forecasts to 2032 (USD Billion)

8.2.15 Tourettes

8.2.15.1 Tourettes Market Trends Analysis (2020-2032)

8.2.15.2 Tourettes Market Size Estimates and Forecasts to 2032 (USD Billion)

8.2.16 Alzheimer’s

8.2.16.1 Alzheimer’s Market Trends Analysis (2020-2032)

8.2.16.2 Alzheimer’s Market Size Estimates and Forecasts to 2032 (USD Billion)

8.2.17 Parkinson’s

8.2.17.1 Parkinson’s Market Trends Analysis (2020-2032)

8.2.17.2 Parkinson’s Market Size Estimates and Forecasts to 2032 (USD Billion)

8.2.18 Others

8.2.18.1 Others Market Trends Analysis (2020-2032)

8.2.18.2 Others Market Size Estimates and Forecasts to 2032 (USD Billion)

8.3 Adult Use

8.3.1 Adult Use Market Trends Analysis (2020-2032)

8.3.2 Adult Use Market Size Estimates and Forecasts to 2032 (USD Billion)

9. Regional Analysis

9.1 Chapter Overview

9.2 North America

9.2.1 Trends Analysis

9.2.2 North America Legal Marijuana Market Estimates and Forecasts, by Country (2020-2032) (USD Billion)

9.2.3 North America Legal Marijuana Market Estimates and Forecasts, By Product Type (2020-2032) (USD Billion)  

9.2.4 North America Legal Marijuana Market Estimates and Forecasts, By Application (2020-2032) (USD Billion)

9.2.5 USA

9.2.5.1 USA Legal Marijuana Market Estimates and Forecasts, By Product Type (2020-2032) (USD Billion)

9.2.5.2 USA Legal Marijuana Market Estimates and Forecasts, By Application (2020-2032) (USD Billion)

9.2.6 Canada

9.2.6.1 Canada Legal Marijuana Market Estimates and Forecasts, By Product Type (2020-2032) (USD Billion)

9.2.6.2 Canada Legal Marijuana Market Estimates and Forecasts, By Application (2020-2032) (USD Billion)

9.2.7 Mexico

9.2.7.1 Mexico Legal Marijuana Market Estimates and Forecasts, By Product Type (2020-2032) (USD Billion)

9.2.7.2 Mexico Legal Marijuana Market Estimates and Forecasts, By Application (2020-2032) (USD Billion)

9.3 Europe

9.3.1 Eastern Europe

9.3.1.1 Trends Analysis

9.3.1.2 Eastern Europe Legal Marijuana Market Estimates and Forecasts, by Country (2020-2032) (USD Billion)

9.3.1.3 Eastern Europe Legal Marijuana Market Estimates and Forecasts, By Product Type (2020-2032) (USD Billion)  

9.3.1.4 Eastern Europe Legal Marijuana Market Estimates and Forecasts, By Application (2020-2032) (USD Billion)

9.3.1.5 Poland

9.3.1.5.1 Poland Legal Marijuana Market Estimates and Forecasts, By Product Type (2020-2032) (USD Billion)

9.3.1.5.2 Poland Legal Marijuana Market Estimates and Forecasts, By Application (2020-2032) (USD Billion)

9.3.1.6 Romania

9.3.1.6.1 Romania Legal Marijuana Market Estimates and Forecasts, By Product Type (2020-2032) (USD Billion)

9.3.1.6.2 Romania Legal Marijuana Market Estimates and Forecasts, By Application (2020-2032) (USD Billion)

9.3.1.7 Hungary

9.3.1.7.1 Hungary Legal Marijuana Market Estimates and Forecasts, By Product Type (2020-2032) (USD Billion)

9.3.1.7.2 Hungary Legal Marijuana Market Estimates and Forecasts, By Application (2020-2032) (USD Billion)

9.3.1.8 Turkey

9.3.1.8.1 Turkey Legal Marijuana Market Estimates and Forecasts, By Product Type (2020-2032) (USD Billion)

9.3.1.8.2 Turkey Legal Marijuana Market Estimates and Forecasts, By Application (2020-2032) (USD Billion)

9.3.1.9 Rest of Eastern Europe

9.3.1.9.1 Rest of Eastern Europe Legal Marijuana Market Estimates and Forecasts, By Product Type (2020-2032) (USD Billion)

9.3.1.9.2 Rest of Eastern Europe Legal Marijuana Market Estimates and Forecasts, By Application (2020-2032) (USD Billion)

9.3.2 Western Europe

9.3.2.1 Trends Analysis

9.3.2.2 Western Europe Legal Marijuana Market Estimates and Forecasts, by Country (2020-2032) (USD Billion)

9.3.2.3 Western Europe Legal Marijuana Market Estimates and Forecasts, By Product Type (2020-2032) (USD Billion)  

9.3.2.4 Western Europe Legal Marijuana Market Estimates and Forecasts, By Application (2020-2032) (USD Billion)

9.3.2.5 Germany

9.3.2.5.1 Germany Legal Marijuana Market Estimates and Forecasts, By Product Type (2020-2032) (USD Billion)

9.3.2.5.2 Germany Legal Marijuana Market Estimates and Forecasts, By Application (2020-2032) (USD Billion)

9.3.2.6 France

9.3.2.6.1 France Legal Marijuana Market Estimates and Forecasts, By Product Type (2020-2032) (USD Billion)

9.3.2.6.2 France Legal Marijuana Market Estimates and Forecasts, By Application (2020-2032) (USD Billion)

9.3.2.7 UK

9.3.2.7.1 UK Legal Marijuana Market Estimates and Forecasts, By Product Type (2020-2032) (USD Billion)

9.3.2.7.2 UK Legal Marijuana Market Estimates and Forecasts, By Application (2020-2032) (USD Billion)

9.3.2.8 Italy

9.3.2.8.1 Italy Legal Marijuana Market Estimates and Forecasts, By Product Type (2020-2032) (USD Billion)

9.3.2.8.2 Italy Legal Marijuana Market Estimates and Forecasts, By Application (2020-2032) (USD Billion)

9.3.2.9 Spain

9.3.2.9.1 Spain Legal Marijuana Market Estimates and Forecasts, By Product Type (2020-2032) (USD Billion)

9.3.2.9.2 Spain Legal Marijuana Market Estimates and Forecasts, By Application (2020-2032) (USD Billion)

9.3.2.10 Netherlands

9.3.2.10.1 Netherlands Legal Marijuana Market Estimates and Forecasts, By Product Type (2020-2032) (USD Billion)

9.3.2.10.2 Netherlands Legal Marijuana Market Estimates and Forecasts, By Application (2020-2032) (USD Billion)

9.3.2.11 Switzerland

9.3.2.11.1 Switzerland Legal Marijuana Market Estimates and Forecasts, By Product Type (2020-2032) (USD Billion)

9.3.2.11.2 Switzerland Legal Marijuana Market Estimates and Forecasts, By Application (2020-2032) (USD Billion)

9.3.2.12 Austria

9.3.2.12.1 Austria Legal Marijuana Market Estimates and Forecasts, By Product Type (2020-2032) (USD Billion)

9.3.2.12.2 Austria Legal Marijuana Market Estimates and Forecasts, By Application (2020-2032) (USD Billion)

9.3.2.13 Rest of Western Europe

9.3.2.13.1 Rest of Western Europe Legal Marijuana Market Estimates and Forecasts, By Product Type (2020-2032) (USD Billion)

9.3.2.13.2 Rest of Western Europe Legal Marijuana Market Estimates and Forecasts, By Application (2020-2032) (USD Billion)

9.4 Asia Pacific

9.4.1 Trends Analysis

9.4.2 Asia Pacific Legal Marijuana Market Estimates and Forecasts, by Country (2020-2032) (USD Billion)

9.4.3 Asia Pacific Legal Marijuana Market Estimates and Forecasts, By Product Type (2020-2032) (USD Billion)  

9.4.4 Asia Pacific Legal Marijuana Market Estimates and Forecasts, By Application (2020-2032) (USD Billion)

9.4.5 China

9.4.5.1 China Legal Marijuana Market Estimates and Forecasts, By Product Type (2020-2032) (USD Billion)

9.4.5.2 China Legal Marijuana Market Estimates and Forecasts, By Application (2020-2032) (USD Billion)

9.4.6 India

9.4.5.1 India Legal Marijuana Market Estimates and Forecasts, By Product Type (2020-2032) (USD Billion)

9.4.5.2 India Legal Marijuana Market Estimates and Forecasts, By Application (2020-2032) (USD Billion)

9.4.5 Japan

9.4.5.1 Japan Legal Marijuana Market Estimates and Forecasts, By Product Type (2020-2032) (USD Billion)

9.4.5.2 Japan Legal Marijuana Market Estimates and Forecasts, By Application (2020-2032) (USD Billion)

9.4.6 South Korea

9.4.6.1 South Korea Legal Marijuana Market Estimates and Forecasts, By Product Type (2020-2032) (USD Billion)

9.4.6.2 South Korea Legal Marijuana Market Estimates and Forecasts, By Application (2020-2032) (USD Billion)

9.4.7 Vietnam

9.4.7.1 Vietnam Legal Marijuana Market Estimates and Forecasts, By Product Type (2020-2032) (USD Billion)

9.2.7.2 Vietnam Legal Marijuana Market Estimates and Forecasts, By Application (2020-2032) (USD Billion)

9.4.8 Singapore

9.4.8.1 Singapore Legal Marijuana Market Estimates and Forecasts, By Product Type (2020-2032) (USD Billion)

9.4.8.2 Singapore Legal Marijuana Market Estimates and Forecasts, By Application (2020-2032) (USD Billion)

9.4.9 Australia

9.4.9.1 Australia Legal Marijuana Market Estimates and Forecasts, By Product Type (2020-2032) (USD Billion)

9.4.9.2 Australia Legal Marijuana Market Estimates and Forecasts, By Application (2020-2032) (USD Billion)

9.4.10 Rest of Asia Pacific

9.4.10.1 Rest of Asia Pacific Legal Marijuana Market Estimates and Forecasts, By Product Type (2020-2032) (USD Billion)

9.4.10.2 Rest of Asia Pacific Legal Marijuana Market Estimates and Forecasts, By Application (2020-2032) (USD Billion)

9.5 Middle East and Africa

9.5.1 Middle East

9.5.1.1 Trends Analysis

9.5.1.2 Middle East Legal Marijuana Market Estimates and Forecasts, by Country (2020-2032) (USD Billion)

9.5.1.3 Middle East Legal Marijuana Market Estimates and Forecasts, By Product Type (2020-2032) (USD Billion)  

9.5.1.4 Middle East Legal Marijuana Market Estimates and Forecasts, By Application (2020-2032) (USD Billion)

9.5.1.5 UAE

9.5.1.5.1 UAE Legal Marijuana Market Estimates and Forecasts, By Product Type (2020-2032) (USD Billion)

9.5.1.5.2 UAE Legal Marijuana Market Estimates and Forecasts, By Application (2020-2032) (USD Billion)

9.5.1.6 Egypt

9.5.1.6.1 Egypt Legal Marijuana Market Estimates and Forecasts, By Product Type (2020-2032) (USD Billion)

9.5.1.6.2 Egypt Legal Marijuana Market Estimates and Forecasts, By Application (2020-2032) (USD Billion)

9.5.1.7 Saudi Arabia

9.5.1.7.1 Saudi Arabia Legal Marijuana Market Estimates and Forecasts, By Product Type (2020-2032) (USD Billion)

9.5.1.7.2 Saudi Arabia Legal Marijuana Market Estimates and Forecasts, By Application (2020-2032) (USD Billion)

9.5.1.8 Qatar

9.5.1.8.1 Qatar Legal Marijuana Market Estimates and Forecasts, By Product Type (2020-2032) (USD Billion)

9.5.1.8.2 Qatar Legal Marijuana Market Estimates and Forecasts, By Application (2020-2032) (USD Billion)

9.5.1.9 Rest of Middle East

9.5.1.9.1 Rest of Middle East Legal Marijuana Market Estimates and Forecasts, By Product Type (2020-2032) (USD Billion)

9.5.1.9.2 Rest of Middle East Legal Marijuana Market Estimates and Forecasts, By Application (2020-2032) (USD Billion)

9.5.2 Africa

9.5.2.1 Trends Analysis

9.5.2.2 Africa Legal Marijuana Market Estimates and Forecasts, by Country (2020-2032) (USD Billion)

9.5.2.3 Africa Legal Marijuana Market Estimates and Forecasts, By Product Type (2020-2032) (USD Billion)  

9.5.2.4 Africa Legal Marijuana Market Estimates and Forecasts, By Application (2020-2032) (USD Billion)

9.5.2.5 South Africa

9.5.2.5.1 South Africa Legal Marijuana Market Estimates and Forecasts, By Product Type (2020-2032) (USD Billion)

9.5.2.5.2 South Africa Legal Marijuana Market Estimates and Forecasts, By Application (2020-2032) (USD Billion)

9.5.2.6 Nigeria

9.5.2.6.1 Nigeria Legal Marijuana Market Estimates and Forecasts, By Product Type (2020-2032) (USD Billion)

9.5.2.6.2 Nigeria Legal Marijuana Market Estimates and Forecasts, By Application (2020-2032) (USD Billion)

9.5.2.7 Rest of Africa

9.5.2.7.1 Rest of Africa Legal Marijuana Market Estimates and Forecasts, By Product Type (2020-2032) (USD Billion)

9.5.2.7.2 Rest of Africa Legal Marijuana Market Estimates and Forecasts, By Application (2020-2032) (USD Billion)

9.6 Latin America

9.6.1 Trends Analysis

9.6.2 Latin America Legal Marijuana Market Estimates and Forecasts, by Country (2020-2032) (USD Billion)

9.6.3 Latin America Legal Marijuana Market Estimates and Forecasts, By Product Type (2020-2032) (USD Billion)  

9.6.4 Latin America Legal Marijuana Market Estimates and Forecasts, By Application (2020-2032) (USD Billion)

9.6.5 Brazil

9.6.5.1 Brazil Legal Marijuana Market Estimates and Forecasts, By Product Type (2020-2032) (USD Billion)

9.6.5.2 Brazil Legal Marijuana Market Estimates and Forecasts, By Application (2020-2032) (USD Billion)

9.6.6 Argentina

9.6.6.1 Argentina Legal Marijuana Market Estimates and Forecasts, By Product Type (2020-2032) (USD Billion)

9.6.6.2 Argentina Legal Marijuana Market Estimates and Forecasts, By Application (2020-2032) (USD Billion)

9.6.7 Colombia

9.6.7.1 Colombia Legal Marijuana Market Estimates and Forecasts, By Product Type (2020-2032) (USD Billion)

9.6.7.2 Colombia Legal Marijuana Market Estimates and Forecasts, By Application (2020-2032) (USD Billion)

9.6.8 Rest of Latin America

9.6.8.1 Rest of Latin America Legal Marijuana Market Estimates and Forecasts, By Product Type (2020-2032) (USD Billion)

9.6.8.2 Rest of Latin America Legal Marijuana Market Estimates and Forecasts, By Application (2020-2032) (USD Billion)

10. Company Profiles

10.1 Canopy Growth Corporation

10.1.1 Company Overview

10.1.2 Financial

10.1.3 Products/ Services Offered

110.1.4 SWOT Analysis

10.2 Aurora Cannabis Inc.

10.2.1 Company Overview

10.2.2 Financial

10.2.3 Products/ Services Offered

10.2.4 SWOT Analysis

10.3 Cronos Group

10.3.1 Company Overview

10.3.2 Financial

10.3.3 Products/ Services Offered

10.3.4 SWOT Analysis

10.4 Tilray, Inc.

10.4.1 Company Overview

10.4.2 Financial

10.4.3 Products/ Services Offered

10.4.4 SWOT Analysis

10.5 Hexo Corp.

10.5.1 Company Overview

10.5.2 Financial

10.5.3 Products/ Services Offered

10.5.4 SWOT Analysis

10.6 Charlotte's Web Holdings, Inc.

10.6.1 Company Overview

10.6.2 Financial

10.6.3 Products/ Services Offered

10.6.4 SWOT Analysis

10.7 Organigram Holdings Inc.

10.7.1 Company Overview

10.7.2 Financial

10.7.3 Products/ Services Offered

10.7.4 SWOT Analysis

10.8 GW Pharmaceuticals

10.8.1 Company Overview

10.8.2 Financial

10.8.3 Products/ Services Offered

10.8.4 SWOT Analysis

10.9 Green Thumb Industries

10.9.1 Company Overview

10.9.2 Financial

10.9.3 Products/ Services Offered

10.9.4 SWOT Analysis

10.10 Trulieve

             10.9.1 Company Overview

10.9.2 Financial

10.9.3 Products/ Services Offered

10.9.4 SWOT Analysis

11. Use Cases and Best Practices

12. Conclusion

An accurate research report requires proper strategizing as well as implementation. There are multiple factors involved in the completion of good and accurate research report and selecting the best methodology to compete the research is the toughest part. Since the research reports we provide play a crucial role in any company’s decision-making process, therefore we at SNS Insider always believe that we should choose the best method which gives us results closer to reality. This allows us to reach at a stage wherein we can provide our clients best and accurate investment to output ratio.

Each report that we prepare takes a timeframe of 350-400 business hours for production. Starting from the selection of titles through a couple of in-depth brain storming session to the final QC process before uploading our titles on our website we dedicate around 350 working hours. The titles are selected based on their current market cap and the foreseen CAGR and growth.


The 5 steps process:

Step 1: Secondary Research:

Secondary Research or Desk Research is as the name suggests is a research process wherein, we collect data through the readily available information. In this process we use various paid and unpaid databases which our team has access to and gather data through the same. This includes examining of listed companies’ annual reports, Journals, SEC filling etc. Apart from this our team has access to various associations across the globe across different industries. Lastly, we have exchange relationships with various university as well as individual libraries.

Secondary Research

Step 2: Primary Research

When we talk about primary research, it is a type of study in which the researchers collect relevant data samples directly, rather than relying on previously collected data.  This type of research is focused on gaining content specific facts that can be sued to solve specific problems. Since the collected data is fresh and first hand therefore it makes the study more accurate and genuine.

We at SNS Insider have divided Primary Research into 2 parts.

Part 1 wherein we interview the KOLs of major players as well as the upcoming ones across various geographic regions. This allows us to have their view over the market scenario and acts as an important tool to come closer to the accurate market numbers. As many as 45 paid and unpaid primary interviews are taken from both the demand and supply side of the industry to make sure we land at an accurate judgement and analysis of the market.

This step involves the triangulation of data wherein our team analyses the interview transcripts, online survey responses and observation of on filed participants. The below mentioned chart should give a better understanding of the part 1 of the primary interview.

Primary Research

Part 2: In this part of primary research the data collected via secondary research and the part 1 of the primary research is validated with the interviews from individual consultants and subject matter experts.

Consultants are those set of people who have at least 12 years of experience and expertise within the industry whereas Subject Matter Experts are those with at least 15 years of experience behind their back within the same space. The data with the help of two main processes i.e., FGDs (Focused Group Discussions) and IDs (Individual Discussions). This gives us a 3rd party nonbiased primary view of the market scenario making it a more dependable one while collation of the data pointers.

Step 3: Data Bank Validation

Once all the information is collected via primary and secondary sources, we run that information for data validation. At our intelligence centre our research heads track a lot of information related to the market which includes the quarterly reports, the daily stock prices, and other relevant information. Our data bank server gets updated every fortnight and that is how the information which we collected using our primary and secondary information is revalidated in real time.

Data Bank Validation

Step 4: QA/QC Process

After all the data collection and validation our team does a final level of quality check and quality assurance to get rid of any unwanted or undesired mistakes. This might include but not limited to getting rid of the any typos, duplication of numbers or missing of any important information. The people involved in this process include technical content writers, research heads and graphics people. Once this process is completed the title gets uploader on our platform for our clients to read it.

Step 5: Final QC/QA Process:

This is the last process and comes when the client has ordered the study. In this process a final QA/QC is done before the study is emailed to the client. Since we believe in giving our clients a good experience of our research studies, therefore, to make sure that we do not lack at our end in any way humanly possible we do a final round of quality check and then dispatch the study to the client.

Key Segments:

By Product Type

  • Flower

  • Oil & Tinctures

By Application

  • Medical

    • Chronic Pain

    • Cancer

    • Depression and Anxiety

    • Arthritis

    • Diabetes

    • Glaucoma

    • Migraines

    • Epilepsy

    • Multiple Sclerosis

    • AIDS

    • Amyotrophic Lateral Sclerosis

    • Alzheimer’s

    • Post-traumatic Stress Disorder (PTSD)

    • Parkinson's

    • Tourette’

    • Other

  • Adult Use

Request for Segment Customization as per your Business Requirement: Segment Customization Request

REGIONAL COVERAGE:

North America

  • US

  • Canada

  • Mexico

Europe

  • Eastern Europe

    • Poland

    • Romania

    • Hungary

    • Turkey

    • Rest of Eastern Europe

  • Western Europe

    • Germany

    • France

    • UK

    • Italy

    • Spain

    • Netherlands

    • Switzerland

    • Austria

    • Rest of Western Europe

Asia Pacific

  • China

  • India

  • Japan

  • South Korea

  • Vietnam

  • Singapore

  • Australia

  • Rest of Asia Pacific

Middle East & Africa

  • Middle East

    • UAE

    • Egypt

    • Saudi Arabia

    • Qatar

    • Rest of the Middle East

  • Africa

    • Nigeria

    • South Africa

    • Rest of Africa

Latin America

  • Brazil

  • Argentina

  • Colombia

  • Rest of Latin America

Request for Country Level Research Report: Country Level Customization Request

Available Customization

With the given market data, SNS Insider offers customization as per the company’s specific needs. The following customization options are available for the report:

  • Product Analysis

  • Criss-Cross segment analysis (e.g. Product X Application)

  • Product Matrix which gives a detailed comparison of product portfolio of each company

  • Geographic Analysis

  • Additional countries in any of the regions

  • Company Information

  • Detailed analysis and profiling of additional market players (Up to five)


  •            5000 (33% Discount)


  •            8950 (40% Discount)


  •            3050 (23% Discount)

Start a Conversation

Hi! Click one of our member below to chat on Phone