Lancet Market Size & Overview:
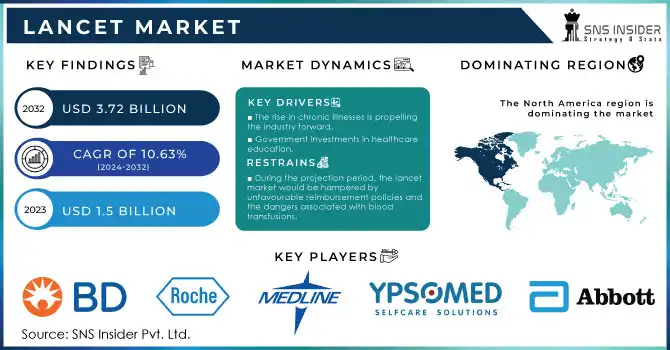
The Lancet Market size was estimated at USD 1.5 billion in 2023 and is expected to reach USD 3.72 billion by 2032 at a CAGR of 10.63% from 2024 to 2032.
Get more information on Lancet Market - Request Free Sample Report
This report emphasizes the prevalence and incidence of lancet use, fueled by the growing diabetes burden and expanding self-monitoring behavior. The research analyzes prescription and use patterns by regions, highlighting differences in demand based on healthcare infrastructure and access. It also discusses pricing trends and cost analysis, evaluating manufacturing costs, reimbursement policies, and affordability for various consumer segments. Regulatory and compliance patterns significantly influence market forces, guaranteeing product safety and alignment with international standards. Market trends are witnessing a shift towards pain-free and minimally invasive lancets, with increasing demand for innovative and user-friendly products. The report also provides an assessment of healthcare expenditure on lancets across geographies, examining contributions from government programs, commercial healthcare services, private facilities, and out-of-pocket spending.
Lancet Market Dynamics
Drivers
-
Growing prevalence of diabetes and increasing self-monitoring practices are major drivers of the lancet market.
The growing global prevalence of diabetes, with more than 537 million people living with diabetes across the world, is a major force behind the lancet market since regular blood glucose measurement demands the use of lancets. The growing use of self-monitoring blood glucose (SMBG) devices by diabetic patients has considerably increased demand for easy-to-use and painless lancets. Also, the growth of point-of-care testing (POCT) for infectious diseases, cholesterol testing, and anemia testing has boosted the application of lancets in diagnostic testing. Advances in technology, including ultra-thin needles and push-button safety lancets, are fueling consumer demand for less painful blood draws. Demand for safety lancets, which minimize the risk of needlestick injury and cross-contamination, is also on the rise in hospitals and clinics. In addition, rising healthcare spending and programs encouraging preventive medicine, like government-sponsored diabetes campaigns, are fueling increased use of self-testing devices. For example, the Global Diabetes Compact by the WHO hopes to enhance access to necessary diabetes care, like monitoring blood glucose levels, further bolstering growth in the lancet market. Additionally, the growth of e-commerce sites has facilitated greater access to consumers for a vast array of lancet products, driving market growth.
Restraints
-
High cost of advanced lancets and limited access to healthcare in low-income regions restrict market growth.
The cost of improved safety lancets, which cost more than basic lancets, is still a major issue, especially among lower-income groups. Most push-button or reusable lancets are overpriced because of advancements in technology and therefore less affordable for price-conscious buyers. The absence of adequate reimbursement policies for self-monitoring equipment in many countries also deters people from buying quality lancets. The reliance on traditional blood draws in rural care areas also restrains market penetration. Although greater awareness exists, in developing markets, some health practitioners and patients remain dependent upon cheaper, reusable lancets that increase the possibility of cross-contamination and discourage higher safety features' demand. Another notable restraint is the aversion of some diabetic patients to undertaking frequent self-monitoring out of fear of pain or inconvenience, resulting in lower adoption rates for lancets. Additionally, regulatory strictness for medical devices such as FDA and CE marks presents a hindrance to new market entrants. For instance, meeting ISO 13485 medical device standards raises costs associated with production, which impacts smaller producers. Limited healthcare infrastructure and supply chain disruptions in certain emerging markets also hamper market growth, as access to quality lancets is inconsistent.
Opportunities
-
Technological advancements and growing demand for home diagnostics present significant opportunities for market expansion.
The growing preference for pain-free and easy-to-use lancets offers a tremendous opportunity for product innovation by manufacturers. The emerging trend of the adoption of minimally invasive blood collection technologies like microneedle-based lancets is projected to transform the market. The rising trend towards personalized medicine and remote patient monitoring is also increasing demand for lancets in home-use diagnostic testing kits. For example, growth in telehealth services is boosting the demand for home-monitoring solutions such as lancets for in-home blood glucose testing. Also, increasing access to healthcare in emerging markets through government programs and NGOs is providing fresh market opportunities. Merging lancets with online health platforms and intelligent monitoring systems can accelerate growth further, with patients demanding intuitive healthcare management solutions. Yet another significant opportunity arises from the rising need for eco-friendly and biodegradable lancets to solve environmental issues related to disposable medical waste. Additionally, growth in online distribution channels and subscription delivery models for diabetes care products is making lancets more available to a larger group of consumers. For instance, businesses such as One Drop and mySugr provide diabetic testing kit subscription delivery plans for home delivery that include lancets, which makes it more convenient for patients. These together provide a good growth scenario for the lancet market.
Challenges
-
Limited awareness, counterfeit products, and waste management issues pose significant challenges to the lancet market.
In spite of increasing adoption, ignorance about proper lancet usage and self-monitoring is a significant challenge, particularly in developing areas. Several patients fail to conduct frequent blood glucose testing because of poor education on diabetes care, which contributes to reduced demand for lancets. The presence of counterfeit or inferior lancets, especially in unregulated markets, also poses a threat to market growth. Low-quality or fake lancets result in injury, incorrect results, or infections, lowering consumers' confidence in self-monitoring systems. Furthermore, disposal of spent lancets creates an environmental and healthcare burden. Infection risk and needle-stick injury risk are higher when contaminated sharps are improperly disposed of, making waste regulation stricter. Use of specialized sharps disposal units, especially for safety lancets, contributes to increased operational expense for healthcare practitioners.
Lancet Market Segmentation Insights
By Type
In 2023, the Safety Lancet segment commanded the highest market share of more than 55.6% of the overall lancet market. This is fueled by growing focus on patient safety, infection prevention, and needlestick injury prevention, particularly in hospitals and diagnostic laboratories. The broad use of safety lancets in blood glucose monitoring and point-of-care testing also helped them dominate the market.
The Push Button Safety Lancet segment is anticipated to experience the highest growth, led by its simplicity of use, automated activation system, and lower risk of accidental injuries. The increasing need for easy-to-use, single-use lancets, especially in home diagnostics and decentralized healthcare environments, is driving its high adoption. Rising awareness of self-monitoring among diabetic patients is also driving its growth.
By End User
The Hospitals & Clinics segment commanded the largest market share in 2023, accounting for more than 40.3% of the overall lancet market. This is due to the large number of blood tests performed in hospitals, the presence of skilled healthcare workers guaranteeing correct lancet use, and the demand for safety lancets in institutional healthcare settings. The increasing prevalence of chronic diseases such as diabetes and cardiovascular diseases further supported the demand in hospitals and clinics.
The fastest-growing segment is Home Diagnostics, driven by increased adoption of self-monitoring devices for blood glucose and other diagnostic tests. Consumer awareness, the advancement of user-friendly lancet designs, and the shift towards home-based healthcare due to convenience and cost-effectiveness are also driving the rapid expansion of this segment. Increasing e-commerce sales of home-use lancets and government initiatives in promoting self-care further accelerate growth.
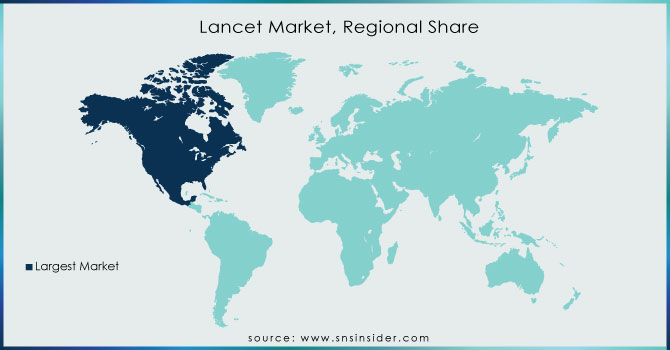
Lancet Market Regional Analysis
North America led the world in the lancet market in 2023, holding more than 35% of the overall market share, backed by the high incidence of diabetes, well-established healthcare system, and high adoption of self-monitoring devices. The availability of prominent market players, favorable reimbursement policies, and growing awareness regarding blood glucose monitoring also reinforced the region's dominance. The United States was the largest market share holder, where there was a boost in home diagnostic use and innovation in lancet designs.
Europe was the second-largest market share holder due to an increase in the aging population, an increase in demand for point-of-care testing, and government efforts favoring diabetes management programs. Germany, France, and the UK experienced strong demand due to robust healthcare infrastructure and patient interest in pain-free and safety lancets.
The Asia-Pacific market emerged as the largest-growing market, with growth driven by the growing prevalence of diabetes, increased access to healthcare, and rising awareness of self-monitoring in China, India, and Japan. Increased middle-class population, rising healthcare spending, and the trend towards home diagnostics were major drivers of growth in the market.
Get Customized Report as per your Business Requirement - Request For Customized Report
Key Players in Lancet Market
-
HTL-STREFA S.A. – Droplet Microneedles, Droplet Safety Lancets, Droplet Personal Lancets
-
Terumo Corporation – Finetouch Lancets, Capiject Safety Lancets
-
Becton Dickinson and Company – BD Microtainer Contact-Activated Lancets, BD Safety Lancets
-
Hoffmann-La Roche Ltd. – Accu-Chek Softclix
-
Improve Medical Instruments Co. Ltd. – IMI Safety Lancets, IMI Personal Lancets
-
Bayer AG – MICROLET Lancets
-
Sarstedt AG & Co. – Sarstedt Safety Lancets, Sarstedt Blood Lancets
-
Abbott Laboratories – FreeStyle Lancets
-
Greiner Bio-One International GmbH – Greiner Safety Lancets, Greiner Mini Collect Lancets
-
Medtronic plc – MiniMed Lancets
-
Nipro Medical Corporation – TRUEplus Lancets, TRUEdraw Lancing Device
-
Owen Mumford Ltd. – Unistik 3 Safety Lancets, Unistik Touch Lancets
-
Ypsomed AG – MyLife Lancets
-
Arkray Inc. – Glucocard Lancets
-
Edan Instruments Inc. – Edan Safety Lancets
Recent Developments
In Dec 2024, Terumo Health Outcomes (THO), a unit of Terumo Interventional Systems (TIS), and Medis Medical Imaging, a recognized cardiac imaging software firm, issued a statement today that they have formed a strategic alliance, in the United States, to accelerate cardiovascular care with the use of both ePRISM – the proprietary clinical decision support platform from Terumo – and Medis' Quantitative Flow Ratio (QFR) technology, an non-invasive software solution that is intended for the evaluation of angiography-derived coronary physiology.
| Report Attributes | Details |
| Market Size in 2023 | USD 2.18 billion |
| Market Size by 2032 | USD 4.47 billion |
| CAGR | CAGR of 8.33% From 2024 to 2032 |
| Base Year | 2023 |
| Forecast Period | 2024-2032 |
| Historical Data | 2020-2022 |
| Report Scope & Coverage | Market Size, Segments Analysis, Competitive Landscape, Regional Analysis, DROC & SWOT Analysis, Forecast Outlook |
| Key Segments | • By Type [Safety Lancet, Push Button Safety Lancet, Pressure Activated Safety Lancet, Personal Lancet] • By End User [Hospitals & Clinics, Diagnostic Centers and Pathology Laboratories, Home Diagnostics, Research and Academic Laboratories] |
| Regional Analysis/Coverage | North America (US, Canada, Mexico), Europe (Eastern Europe [Poland, Romania, Hungary, Turkey, Rest of Eastern Europe] Western Europe] Germany, France, UK, Italy, Spain, Netherlands, Switzerland, Austria, Rest of Western Europe]), Asia Pacific (China, India, Japan, South Korea, Vietnam, Singapore, Australia, Rest of Asia Pacific), Middle East & Africa (Middle East [UAE, Egypt, Saudi Arabia, Qatar, Rest of Middle East], Africa [Nigeria, South Africa, Rest of Africa], Latin America (Brazil, Argentina, Colombia, Rest of Latin America) |
| Company Profiles | HTL-STREFA S.A., Terumo Corporation, Becton Dickinson and Company, Hoffmann-La Roche Ltd., Improve Medical Instruments Co. Ltd., Bayer AG, Sarstedt AG & Co., Abbott Laboratories, Greiner Bio-One International GmbH, Medtronic plc, Nipro Medical Corporation, Owen Mumford Ltd., Ypsomed AG, Arkray Inc., Edan Instruments Inc. |
