image

Laboratory Supplies Market Report Scope & Overview:

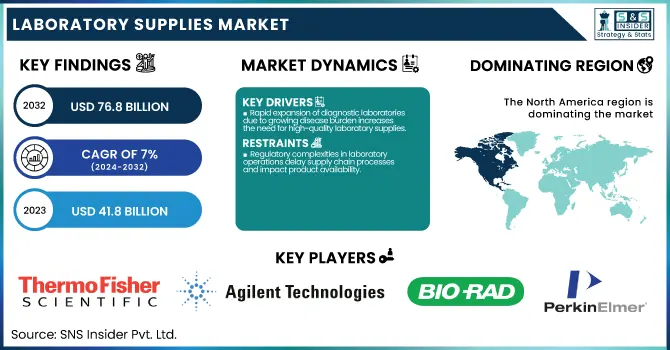
The Laboratory Supplies Market Size was valued at USD 41.8 Billion in 2023 and is expected to reach USD 76.8 billion by 2032, growing at a CAGR of 7% over the forecast period 2024-2032.

Laboratory Supplies Market Revenue Analysis

To Get more information on Laboratory Supplies Market - Request Free Sample Report

This report will identify crucial statistical views and emerging trends in the Laboratory Supplies Market. This report focuses on a diagnostic test's existence by prescription trends among major regions in the growing demand for lab consumables and instruments. The report analyzes consumption volumes by supply type and end-use sectors, alongside regional variations in healthcare spending on lab supplies, segmented by payer type. In addition, evolving supply chain patterns would be covered, like developing e-commerce distribution and regionally sourced supplies. Sustainability and regulatory compliance are also noted in their product demand, as mandated by environmental and safety legislation. Laboratory supplies are parts of progress in the research of science, diagnostics in health care, and quality control by industries.

The U.S. Laboratory Supplies Market has always been recorded to grow steadily, increasing from USD 13.02 billion in 2023 to USD 23.64 billion by 2032, with a CAGR of 6.86%. This is largely because of the rising diagnostic tests and advanced research programs and also the infrastructural strength of the health sector. Continuous demand for good consumables with quality compliance has made the market momentum going on both in clinical and academic settings. The development of advanced laboratory equipment and consumables for this technology demands further arguments around the world. According to the UNESCO Institute of Statistics, global R&D expenditure is at about USD 1.7 trillion figure is assumed to grow, as most developing countries will enhance their public and private research investments and develop the number of researchers by 2030.

Market Dynamics

Drivers

  • Rapid expansion of diagnostic laboratories due to growing disease burden increases the need for high-quality laboratory supplies.

The rapid expansion of diagnostic laboratories due to the increasing prevalence of infectious and chronic diseases has intensified the requirement for reliable laboratory supplies. Additionally, there is an increased dependence of healthcare providers on laboratory-based testing for such services, creating a high demand for consumable products such as specimen containers, test tubes, and reagents. The COVID-19 pandemic also helped in hastening the establishment of diagnostic labs around the country which has led to high levels of testing capabilities. And then personalized medicine and genetic testing, which require specialty and often customized lab supplies, have also become growth engines. Laboratories are facing increased regulatory scrutiny that drives laboratories to continuously have calibrated and standardized tools at their disposal. Consequently, lab supply manufacturers continue to see stable demand from both hospital-based and standalone diagnostics laboratories, particularly in areas where healthcare infrastructure is developing and patient volumes are increasing.

Restrain

  • Regulatory complexities in laboratory operations delay supply chain processes and impact product availability.

Regulatory complexities in laboratory operations delay supply chain processes and impact the availability of laboratory supplies across key markets. Compliance with region-specific guidelines related to safety, quality control, and import/export laws requires significant time and documentation. For instance, the requirements of the CE or ISO certification will further delay the approval of products related to different lab consumables. Regulatory inconsistencies between international and domestic rules frequently complicate imports causing shipment delays and backlogs. Furthermore, changing standards and the need for periodic audits further create uncertainty in the procurement cycle. These regulatory barriers not only delay the timely access to core supplies but also increase costs incurred over the barrier for manufacturers and distributors. Laboratories that depend just-in-time inventory systems are susceptible to these disruptions directly affecting their testing and research capabilities during peaks of demand.

Opportunities

  • Rising adoption of digital lab technologies and automation offers new revenue opportunities for lab equipment manufacturers.

Rising adoption of digital lab technologies and automation presents lucrative revenue opportunities for laboratory supply manufacturers worldwide. Laboratories are integrating automated sample handling, digital inventory management, and smart instruments to improve operational efficiency and data accuracy. The emergence of Lab Information Management Systems (LIMS), robotic pipetting systems, and IoT-enabled devices enhances throughput and reduces human error. As a result, suppliers are developing compatible lab consumables and smart tools that integrate seamlessly with these digital ecosystems. Additionally, artificial intelligence and machine learning are being embedded into lab operations, enabling predictive analytics and faster decision-making. This shift toward automation is not limited to elite institutions; even mid-sized labs are investing in semi-automated platforms. Consequently, manufacturers who innovate and align their products with this digital transformation are well-positioned to tap into high-growth segments of the Laboratory Supplies Market.

Challenges

  • Sustainability and waste management issues challenge manufacturers to reduce environmental impact of disposable lab consumables.

The growing trends of sustainability and waste management only pose a challenge to manufacturers to help reduce the environmental impact of disposable lab consumables. Faced with increasing scrutiny around single-use plastics and chemical waste, laboratories are coming under pressure to adopt greener practices. Nevertheless, the majority of consumables which include pipette tips, petri dishes, and reagent bottles, are still produced from non-biodegradable materials, accumulating in landfills and toxic waste. Regulatory agencies are tightening environmental compliance, and pressuring labs to minimize plastic usage, but options are still limited and usually costly. The hardest part is making sure you are creating the best-performing product you can while innovating with eco-friendly materials. Manufacturers are being challenged to create recyclable or biodegradable alternatives without compromising sterility or durability. Until a solution can scale and gain traction, environmental sustainability will continue to be a heavy burden for both lab operators and supply chain players in the market.

Segment Analysis

By Product

The equipment segment’s dominance in the Laboratory Supplies Market, with a commanding 64% revenue share in 2023, is the result of several converging trends and priorities within the global research and healthcare landscape. Laboratory equipment such as analytical instruments of very high precision, centrifuges, incubators, and photometers make up the core elements of modern scientific inquiry and diagnostics. These precious items are essential for basic laboratory operations as well as high-dimension research activities in genomics, proteomics, drug discovery, and personalized medicine. The high cost and long lifespan of these instruments mean that each purchase represents a significant investment, which is often supported by government grants and institutional funding. For instance, funding priority has been on acquisition or modernizing laboratory equipment under the U.S. National Institutes of Health (NIH) and the Canadian Foundation for Innovation as both organizations ensure that research facilities have systems that are improved technology-wise at any given time. Apart from the pace with which the innovations in laboratory automation, digital integration, and smart lab solutions methods, labs are frequenting equipment upgrades because of operational efficiency and regulatory compliance. Regulators in North America and Europe, such as those of the FDA and EMA, require laboratories to have certified, calibrated equipment that guarantees the safety and accuracy of data, thereby inciting the demand for new and replacement instruments. The proliferation of contract research organizations (CROs), biopharmaceutical companies, and academic research centers has also contributed to the robust growth of the equipment segment. As research becomes more complex and data-driven, the need for sophisticated, high-throughput instruments continues to rise.

Regional Analysis

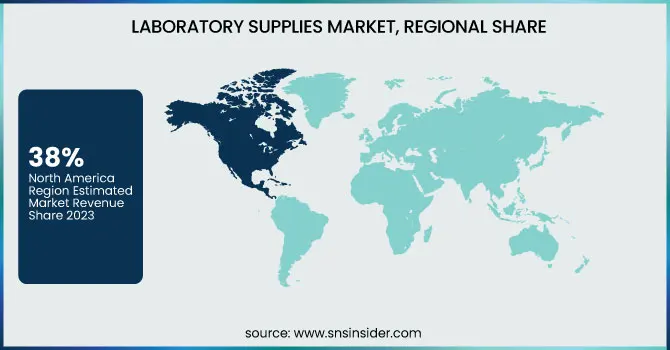
In 2023, North America solidified its position as the leading region in the global Laboratory Supplies Market, accounting for approximately 38% of total market revenue. The characteristics that make this region unique include huge government investments; a well-established biopharmaceutical and healthcare industry; and a highly developed research ecosystem. The continued commitment of the U.S. government towards research is clearly illustrated in the NIH 2024 budget allocation that exceeded USD 48 billion, most of which is earmarked for laboratory infrastructure, modernization, and advanced equipment. All these make demands for laboratory supplies higher, as databases contain some of the most prestigious research universities in the world as well as the finest hospitals and the highest concentration of biotechnology and pharmaceutical companies. Moreover, the regulatory framework of North America is heavily and strictly controlled by agencies such as the U.S. Food & Drug Administration, which ensures that all laboratories in the region keep upgrading their equipment to high standards for safety and data integrity.

Europe region is growing with significant growth rate during the forecast period. Countries like Germany, the UK, and France are intensively ramping up their research capabilities, investing in advanced laboratory infrastructure, and developing biotech hubs. A lot of this will also contribute to the focus on sustainability and increased digitalization in European laboratories. Moreover, the regulatory framework for quality and eco-friendly practices in this region is also resulting in a demand for new equipment and consumables. Thus, while North America retains its leadership through size and maturity, Europe's accelerated growth trajectory is shaping it into a major vehicle of international laboratory supplies driven by innovations, regulatory advancements, and strategic government support.

Laboratory Supplies Market Regional share

Get Customized Report as per Your Business Requirement - Enquiry Now

Key Players

Key Service Providers/Manufacturers

  • Thermo Fisher Scientific (NanoDrop One Microvolume UV-Vis Spectrophotometer, Orion Star A215 pH/Conductivity Benchtop Meter)

  • Agilent Technologies (Agilent 8890 GC System, Agilent 1260 Infinity II LC)

  • Bio-Rad Laboratories (CFX96 Touch Real-Time PCR Detection System, ChemiDoc MP Imaging System)

  • PerkinElmer (Lambda 365+ UV/Vis Spectrophotometer, NexION 2000 ICP-MS)

  • Bruker Corporation (MALDI Biotyper Microbial Identification System, Avance NEO NMR Spectrometer)

  • Danaher Corporation (DxH 900 Hematology Analyzer, Biomek i-Series Automated Workstations)

  • Fujifilm Irvine Scientific (CHOgro High Yield Expression System, IS Sf Insect Cell Culture Medium)

  • Sartorius AG (Cubis II Premium Laboratory Balance, Ambr 15 Cell Culture System)

  • Shimadzu Corporation (LCMS-8060NX Mass Spectrometer, UV-1900i UV-Vis Spectrophotometer)

  • Waters Corporation (ACQUITY UPLC H-Class PLUS System, Xevo TQ-S micro Mass Spectrometer)

  • Eppendorf AG (Eppendorf Centrifuge 5425 R, Eppendorf Research plus Pipette)

  • Merck Group (MilliporeSigma) (Milli-Q IQ 7000 Water Purification System, Stericup Quick Release Vacuum Filtration System)

  • VWR International (Avantor) (VWR Symphony UV-Visible Spectrophotometer, VWR Advanced Hotplate Stirrer)

  • Beckman Coulter (CytoFLEX Flow Cytometer, Optima XPN Ultracentrifuge)

  • Sysmex Corporation (XN-Series Hematology Analyzer, UF-5000 Urine Particle Analyzer)

  • INTEGRA Biosciences AG (EVOLVE Manual Pipette, VACUSAFE Aspiration System)

  • Antylia Scientific (Cole-Parmer) (Masterflex L/S Peristaltic Pump, Traceable Digital Thermometers)

  • Liberty Industries, Inc. (Modular Cleanrooms, Air Showers)

  • Fox Scientific, Inc. (FSI Analytical Balances, FSI Laboratory Glassware)

  • International Crystal Laboratories (KBr Optical Crystals, FTIR Gas Cells)

Recent Developments

  • In June 2024, Cytiva introduced Supor Prime sterilizing-grade filters, designed for high-concentration biologic drug production. This innovation addresses the growing demand for advanced filtration solutions in pharmaceutical and bioprocessing labs.

  • In October 2023, Sartorius introduced the Picus 2 Electronic Pipette to enhance connectivity with the most advanced performance for precise and repeatable dispensing in biopharmaceutical and quality control applications.

Laboratory Supplies Market Report Scope

Report Attributes Details
Market Size in 2023 USD 41.8 Billion 
Market Size by 2032 USD 76.8 Billion 
CAGR CAGR of 7% From 2024 to 2032
Base Year 2023
Forecast Period 2024-2032
Historical Data 2020-2022
Report Scope & Coverage Market Size, Segments Analysis, Competitive Landscape, Regional Analysis, DROC & SWOT Analysis, Forecast Outlook
Key Segments • By Product (Equipment {Incubators, Laminar Flow Hood, Lab Air Filtration System, Micro Manipulation Systems, Centrifuges, Scopes, Spectrophotometer & Microarray Equipment, Sonicators & Homogenizers, Autoclaves & Sterilizers, Others}, Disposables {Pipettes, Tips, Tubes, Gloves, Cuvettes, Masks, Dishes, Cell Imaging Consumables, Cell Culture Consumables})
Regional Analysis/Coverage North America (US, Canada, Mexico), Europe (Eastern Europe [Poland, Romania, Hungary, Turkey, Rest of Eastern Europe] Western Europe] Germany, France, UK, Italy, Spain, Netherlands, Switzerland, Austria, Rest of Western Europe]), Asia Pacific (China, India, Japan, South Korea, Vietnam, Singapore, Australia, Rest of Asia Pacific), Middle East & Africa (Middle East [UAE, Egypt, Saudi Arabia, Qatar, Rest of Middle East], Africa [Nigeria, South Africa, Rest of Africa], Latin America (Brazil, Argentina, Colombia, Rest of Latin America)
Company Profiles Thermo Fisher Scientific, Agilent Technologies, Bio-Rad Laboratories, PerkinElmer, Bruker Corporation, Danaher Corporation, Fujifilm Irvine Scientific, Sartorius AG, Shimadzu Corporation, Waters Corporation, Eppendorf AG, Merck Group (MilliporeSigma), VWR International (Avantor), Beckman Coulter, Sysmex Corporation, INTEGRA Biosciences AG, Antylia Scientific (Cole-Parmer), Liberty Industries, Inc., Fox Scientific, Inc., International Crystal Laboratories

Frequently Asked Questions

Ans. The projected market size for the Laboratory Supplies Market is USD 76.8 billion by 2032.

Ans: The North American region dominated the Laboratory Supplies Market in 2023.

Ans. The CAGR of the Laboratory Supplies Market is 7% during the forecast period of 2024-2032.

Ans: The rising trend of home-based healthcare and remote patient monitoring opens avenues for laboratory supplies designed specifically for home care settings. ?

Ans:  The equipment segment dominated the Laboratory Supplies Market.

Table of Content  

1. Introduction

1.1 Market Definition

1.2 Scope (Inclusion and Exclusions)

1.3 Research Assumptions

2. Executive Summary

2.1 Market Overview

2.2 Regional Synopsis

2.3 Competitive Summary

3. Research Methodology

3.1 Top-Down Approach

3.2 Bottom-up Approach

3.3. Data Validation

3.4 Primary Interviews

4. Market Dynamics Impact Analysis

4.1 Market Driving Factors Analysis

4.1.1 Drivers

4.1.2 Restraints

4.1.3 Opportunities

4.1.4 Challenges

4.2 PESTLE Analysis

4.3 Porter’s Five Forces Model

5. Statistical Insights and Trends Reporting

5.1 Regional Prescription and Testing Trends (2023)

5.2 Laboratory Supply Consumption Volume by Type (2023)

5.3 Healthcare Spending on Laboratory Supplies (2023)

5.4 Environmental and Regulatory Compliance Trends (2023)

6. Competitive Landscape

6.1 List of Major Companies, By Region

6.2 Market Share Analysis, By Region

6.3 Product Benchmarking

6.3.1 Product specifications and features

6.3.2 Pricing

6.4 Strategic Initiatives

6.4.1 Marketing and promotional activities

6.4.2 Distribution and supply chain strategies

6.4.3 Expansion plans and new product launches

6.4.4 Strategic partnerships and collaborations

6.5 Technological Advancements

6.6 Market Positioning and Branding

7. Laboratory Supplies Market Segmentation, By Product

7.1 Chapter Overview

      7.2 Equipment

             7.2.1 Equipment Market Trends Analysis (2020-2032)

7.2.2 Equipment Market Size Estimates and Forecasts to 2032 (USD Billion)

7.2.3 Incubators

      7.2.3.1 Incubators Market Trends Analysis (2020-2032)

      7.2.3.2 Incubators Market Size Estimates and Forecasts to 2032 (USD Billion)

 7.2.4 Laminar Flow Hood

       7.2.4.1 Laminar Flow Hood Market Trends Analysis (2020-2032)

      7.2.4.2 Laminar Flow Hood Market Size Estimates and Forecasts to 2032 (USD Billion)

7.2.5 Lab Air Filtration System

7.2.5.1 Lab Air Filtration System Market Trends Analysis (2020-2032)

7.2.5.2 Lab Air Filtration System Market Size Estimates and Forecasts to 2032 (USD Billion)

7.2.6 Micro Manipulation Systems

7.2.6.1 Micro Manipulation Systems Market Trends Analysis (2020-2032)

7.2.6.2 Micro Manipulation Systems Market Size Estimates and Forecasts to 2032 (USD Billion)

7.2.7 Centrifuges

7.2.7.1 Centrifuges Market Trends Analysis (2020-2032)

7.2.7.2 Centrifuges Market Size Estimates and Forecasts to 2032 (USD Billion)

7.2.8 Scopes

7.2.8.1 Scopes Market Trends Analysis (2020-2032)

7.2.8.2 Scopes Market Size Estimates and Forecasts to 2032 (USD Billion)

7.2.9 Spectrophotometer & Microarray Equipment

7.2.9.1 Spectrophotometer & Microarray Equipment Market Trends Analysis (2020-2032)

7.2.9.2 Spectrophotometer & Microarray Equipment Market Size Estimates and Forecasts to 2032 (USD Billion)

7.2.10 Sonicators & Homogenizers

7.2.10.1 Sonicators & Homogenizers Market Trends Analysis (2020-2032)

7.2.10.2 Sonicators & Homogenizers Market Size Estimates and Forecasts to 2032 (USD Billion)

7.2.11 Autoclaves & Sterilizers

7.2.11.1 Autoclaves & Sterilizers Market Trends Analysis (2020-2032)

7.2.11.2 Autoclaves & Sterilizers Market Size Estimates and Forecasts to 2032 (USD Billion)

7.2.12 Others

7.2.12.1 Others Market Trends Analysis (2020-2032)

7.2.12.2 Others Market Size Estimates and Forecasts to 2032 (USD Billion)

     7.3 Disposables

             7.3.1 Disposables Market Trends Analysis (2020-2032)

7.3.2 Disposables Market Size Estimates and Forecasts to 2032 (USD Billion)

7.3.3 Pipettes

7.3.3.1 Pipettes Market Trends Analysis (2020-2032)

7.3.3.2 Pipettes Market Size Estimates and Forecasts to 2032 (USD Billion)

7.3.4 Tips

7.3.4.1 Tips Market Trends Analysis (2020-2032)

7.3.4.2 Tips Market Size Estimates and Forecasts to 2032 (USD Billion)

7.3.5 Tubes

7.3.5.1 Tubes Market Trends Analysis (2020-2032)

7.3.5.2 Tubes Market Size Estimates and Forecasts to 2032 (USD Billion)

7.3.6 Gloves

7.3.6.1 Gloves Market Trends Analysis (2020-2032)

7.3.6.2 Gloves Market Size Estimates and Forecasts to 2032 (USD Billion)

7.3.7 Cuvettes

7.3.7.1 Cuvettes Market Trends Analysis (2020-2032)

7.3.7.2 Cuvettes Market Size Estimates and Forecasts to 2032 (USD Billion)

7.3.8 Masks

7.3.8.1 Masks Market Trends Analysis (2020-2032)

7.3.8.2 Masks Market Size Estimates and Forecasts to 2032 (USD Billion)

7.3.9 Dishes

7.3.9.1 Dishes Market Trends Analysis (2020-2032)

7.3.9.2 Dishes Market Size Estimates and Forecasts to 2032 (USD Billion)

7.3.10 Cell Imaging Consumables

7.3.10.1 Cell Imaging Consumables Market Trends Analysis (2020-2032)

7.3.10.2 Cell Imaging Consumables Market Size Estimates and Forecasts to 2032 (USD Billion)

7.3.11 Cell Culture Consumables

7.3.11.1 Cell Culture Consumables Market Trends Analysis (2020-2032)

7.3.11.2 Cell Culture Consumables Market Size Estimates and Forecasts to 2032 (USD Billion)

     8. Regional Analysis

8.1 Chapter Overview

8.2 North America

8.2.1 Trends Analysis

8.2.2 North America Laboratory Supplies Market Estimates and Forecasts, by Country (2020-2032) (USD Billion)

8.2.3 North America Laboratory Supplies Market Estimates and Forecasts, By Product (2020-2032) (USD Billion) 

8.2.2 USA

8.2.2.1 USA Laboratory Supplies Market Estimates and Forecasts, By Product (2020-2032) (USD Billion)

8.2.3 Canada

8.2.3.1 Canada Laboratory Supplies Market Estimates and Forecasts, By Product (2020-2032) (USD Billion)

8.2.4 Mexico

8.2.4.1 Mexico Laboratory Supplies Market Estimates and Forecasts, By Product (2020-2032) (USD Billion)

8.3 Europe

8.3.1 Eastern Europe

8.3.1.1 Trends Analysis

8.3.1.2 Eastern Europe Laboratory Supplies Market Estimates and Forecasts, by Country (2020-2032) (USD Billion)

8.3.1.3 Eastern Europe Laboratory Supplies Market Estimates and Forecasts, By Product (2020-2032) (USD Billion) 

8.3.1.4 Poland

8.3.1.4.1 Poland Laboratory Supplies Market Estimates and Forecasts, By Product (2020-2032) (USD Billion)

8.3.1.5 Romania

8.3.1.5.1 Romania Laboratory Supplies Market Estimates and Forecasts, By Product (2020-2032) (USD Billion)

8.3.1.6 Hungary

10.3.1.8.1 Hungary Laboratory Supplies Market Estimates and Forecasts, By Product (2020-2032) (USD Billion)

8.3.1.7 Turkey

8.3.1.7.1 Turkey Laboratory Supplies Market Estimates and Forecasts, By Product (2020-2032) (USD Billion)

8.3.1.8 Rest of Eastern Europe

8.3.1.8.1 Rest of Eastern Europe Laboratory Supplies Market Estimates and Forecasts, By Product (2020-2032) (USD Billion)

8.3.2 Western Europe

8.3.2.1 Trends Analysis

 8.3.2.2 Western Europe Laboratory Supplies Market Estimates and Forecasts, by Country (2020-2032) (USD Billion)

8.3.2.3 Western Europe Laboratory Supplies Market Estimates and Forecasts, By Product (2020-2032) (USD Billion) 

8.3.2.4 Germany

8.3.2.4.1 Germany Laboratory Supplies Market Estimates and Forecasts, By Product (2020-2032) (USD Billion)

8.3.2.5 France

8.3.2.5.1 France Laboratory Supplies Market Estimates and Forecasts, By Product (2020-2032) (USD Billion)

8.3.2.6 UK

8.3.2.6.1 UK Laboratory Supplies Market Estimates and Forecasts, By Product (2020-2032) (USD Billion)

8.3.2.7 Italy

8.3.2.7.1 Italy Laboratory Supplies Market Estimates and Forecasts, By Product (2020-2032) (USD Billion)

8.3.2.8 Spain

8.3.2.8.1 Spain Laboratory Supplies Market Estimates and Forecasts, By Product (2020-2032) (USD Billion)

8.3.2.9 Netherlands

8.3.2.9.1 Netherlands Laboratory Supplies Market Estimates and Forecasts, By Product (2020-2032) (USD Billion)

8.3.2.10 Switzerland

8.3.2.10.1 Switzerland Laboratory Supplies Market Estimates and Forecasts, By Product (2020-2032) (USD Billion)

8.3.2.11 Austria

8.3.2.11.1 Austria Laboratory Supplies Market Estimates and Forecasts, By Product (2020-2032) (USD Billion)

8.3.2.12 Rest of Western Europe

8.3.2.12.1 Rest of Western Europe Laboratory Supplies Market Estimates and Forecasts, By Product (2020-2032) (USD Billion)

8.4 Asia-Pacific

8.4.1 Trends Analysis

8.4.2 Asia-Pacific Laboratory Supplies Market Estimates and Forecasts, by Country (2020-2032) (USD Billion)

8.4.3 Asia-Pacific Laboratory Supplies Market Estimates and Forecasts, By Product (2020-2032) (USD Billion) 

8.4.4 China

8.4.4.1 China Laboratory Supplies Market Estimates and Forecasts, By Product (2020-2032) (USD Billion)

8.4.5 India

8.4.5.1 India Laboratory Supplies Market Estimates and Forecasts, By Product (2020-2032) (USD Billion)

8.4.6 Japan

8.4.6.1 Japan Laboratory Supplies Market Estimates and Forecasts, By Product (2020-2032) (USD Billion)

8.4.7 South Korea

8.4.7.1 South Korea Laboratory Supplies Market Estimates and Forecasts, By Product (2020-2032) (USD Billion)

8.4.8 Vietnam

8.4.8.1 Vietnam Laboratory Supplies Market Estimates and Forecasts, By Product (2020-2032) (USD Billion)

8.4.9 Singapore

8.4.9.1 Singapore Laboratory Supplies Market Estimates and Forecasts, By Product (2020-2032) (USD Billion)

8.4.10 Australia

8.4.10.1 Australia Laboratory Supplies Market Estimates and Forecasts, By Product (2020-2032) (USD Billion)

8.4.11 Rest of Asia-Pacific

8.4.11.1 Rest of Asia-Pacific Laboratory Supplies Market Estimates and Forecasts, By Product (2020-2032) (USD Billion)

8.5 Middle East and Africa

8.5.1 Middle East

8.5.1.1 Trends Analysis

8.5.1.2 Middle East Laboratory Supplies Market Estimates and Forecasts, by Country (2020-2032) (USD Billion)

10.5.1.3 Middle East Laboratory Supplies Market Estimates and Forecasts, By Product (2020-2032) (USD Billion) 

8.5.1.4 UAE

8.5.1.4.1 UAE Laboratory Supplies Market Estimates and Forecasts, By Product (2020-2032) (USD Billion)

8.5.1.5 Egypt

8.5.1.5.1 Egypt Laboratory Supplies Market Estimates and Forecasts, By Product (2020-2032) (USD Billion)

8.5.1.6 Saudi Arabia

8.5.1.6.1 Saudi Arabia Laboratory Supplies Market Estimates and Forecasts, By Product (2020-2032) (USD Billion)

8.5.1.7 Qatar

8.5.1.7.1 Qatar Laboratory Supplies Market Estimates and Forecasts, By Product (2020-2032) (USD Billion)

8.5.1.8 Rest of Middle East

8.5.1.8.1 Rest of Middle East Laboratory Supplies Market Estimates and Forecasts, By Product (2020-2032) (USD Billion)

8.5.2 Africa

8.5.2.1 Trends Analysis

8.5.2.2 Africa Laboratory Supplies Market Estimates and Forecasts, by Country (2020-2032) (USD Billion)

8.5.2.3 Africa Laboratory Supplies Market Estimates and Forecasts, By Product (2020-2032) (USD Billion) 

8.5.2.4 South Africa

8.5.2.4.1 South Africa Laboratory Supplies Market Estimates and Forecasts, By Product (2020-2032) (USD Billion)

8.5.2.5 Nigeria

8.5.2.5.1 Nigeria Laboratory Supplies Market Estimates and Forecasts, By Product (2020-2032) (USD Billion)

8.5.2.6 Rest of Africa

8.5.2.6.1 Rest of Africa Laboratory Supplies Market Estimates and Forecasts, By Product (2020-2032) (USD Billion)

8.6 Latin America

8.6.1 Trends Analysis

8.6.2 Latin America Laboratory Supplies Market Estimates and Forecasts, by Country (2020-2032) (USD Billion)

8.6.3 Latin America Laboratory Supplies Market Estimates and Forecasts, By Product (2020-2032) (USD Billion) 

8.6.4 Brazil

8.6.4.1 Brazil Laboratory Supplies Market Estimates and Forecasts, By Product (2020-2032) (USD Billion)

8.6.5 Argentina

8.6.5.1 Argentina Laboratory Supplies Market Estimates and Forecasts, By Product (2020-2032) (USD Billion)

8.6.6 Colombia

8.6.6.1 Colombia Laboratory Supplies Market Estimates and Forecasts, By Product (2020-2032) (USD Billion)

8.6.7 Rest of Latin America

8.6.7.1 Rest of Latin America Laboratory Supplies Market Estimates and Forecasts, By Product (2020-2032) (USD Billion)

9. Company Profiles

9.1 Thermo Fisher Scientific

9.1.1 Company Overview

9.1.2 Financial

9.1.3 Products/ Services Offered

9.1.4 SWOT Analysis

9.2 Agilent Technologies

9.2.1 Company Overview

9.2.2 Financial

9.2.3 Products/ Services Offered

9.2.4 SWOT Analysis

9.3 Bio-Rad Laboratories

9.3.1 Company Overview

9.3.2 Financial

9.3.3 Products/ Services Offered

9.3.4 SWOT Analysis

9.4 PerkinElmer

9.4.1 Company Overview

9.4.2 Financial

9.4.3 Products/ Services Offered

9.4.4 SWOT Analysis

9.5 Bruker Corporation

9.5.1 Company Overview

9.5.2 Financial

9.5.3 Products/ Services Offered

9.5.4 SWOT Analysis

9.6 Danaher Corporation

9.6.1 Company Overview

9.6.2 Financial

9.6.3 Products/ Services Offered

9.6.4 SWOT Analysis

9.7 Fujifilm Irvine Scientific

9.7.1 Company Overview

9.7.2 Financial

9.7.3 Products/ Services Offered

9.7.4 SWOT Analysis

9.8 Sartorius AG

9.8.1 Company Overview

9.8.2 Financial

9.8.3 Products/ Services Offered

9.8.4 SWOT Analysis

9.9 Shimadzu Corporation

9.9.1 Company Overview

9.9.2 Financial

9.9.3 Products/ Services Offered

9.9.4 SWOT Analysis

9.10 Waters Corporation

9.10.1 Company Overview

9.10.2 Financial

9.10.3 Products/ Services Offered

9.10.4 SWOT Analysis

10. Use Cases and Best Practices

11. Conclusion

An accurate research report requires proper strategizing as well as implementation. There are multiple factors involved in the completion of good and accurate research report and selecting the best methodology to compete the research is the toughest part. Since the research reports we provide play a crucial role in any company’s decision-making process, therefore we at SNS Insider always believe that we should choose the best method which gives us results closer to reality. This allows us to reach at a stage wherein we can provide our clients best and accurate investment to output ratio.

Each report that we prepare takes a timeframe of 350-400 business hours for production. Starting from the selection of titles through a couple of in-depth brain storming session to the final QC process before uploading our titles on our website we dedicate around 350 working hours. The titles are selected based on their current market cap and the foreseen CAGR and growth.


The 5 steps process:

Step 1: Secondary Research:

Secondary Research or Desk Research is as the name suggests is a research process wherein, we collect data through the readily available information. In this process we use various paid and unpaid databases which our team has access to and gather data through the same. This includes examining of listed companies’ annual reports, Journals, SEC filling etc. Apart from this our team has access to various associations across the globe across different industries. Lastly, we have exchange relationships with various university as well as individual libraries.

Secondary Research

Step 2: Primary Research

When we talk about primary research, it is a type of study in which the researchers collect relevant data samples directly, rather than relying on previously collected data.  This type of research is focused on gaining content specific facts that can be sued to solve specific problems. Since the collected data is fresh and first hand therefore it makes the study more accurate and genuine.

We at SNS Insider have divided Primary Research into 2 parts.

Part 1 wherein we interview the KOLs of major players as well as the upcoming ones across various geographic regions. This allows us to have their view over the market scenario and acts as an important tool to come closer to the accurate market numbers. As many as 45 paid and unpaid primary interviews are taken from both the demand and supply side of the industry to make sure we land at an accurate judgement and analysis of the market.

This step involves the triangulation of data wherein our team analyses the interview transcripts, online survey responses and observation of on filed participants. The below mentioned chart should give a better understanding of the part 1 of the primary interview.

Primary Research

Part 2: In this part of primary research the data collected via secondary research and the part 1 of the primary research is validated with the interviews from individual consultants and subject matter experts.

Consultants are those set of people who have at least 12 years of experience and expertise within the industry whereas Subject Matter Experts are those with at least 15 years of experience behind their back within the same space. The data with the help of two main processes i.e., FGDs (Focused Group Discussions) and IDs (Individual Discussions). This gives us a 3rd party nonbiased primary view of the market scenario making it a more dependable one while collation of the data pointers.

Step 3: Data Bank Validation

Once all the information is collected via primary and secondary sources, we run that information for data validation. At our intelligence centre our research heads track a lot of information related to the market which includes the quarterly reports, the daily stock prices, and other relevant information. Our data bank server gets updated every fortnight and that is how the information which we collected using our primary and secondary information is revalidated in real time.

Data Bank Validation

Step 4: QA/QC Process

After all the data collection and validation our team does a final level of quality check and quality assurance to get rid of any unwanted or undesired mistakes. This might include but not limited to getting rid of the any typos, duplication of numbers or missing of any important information. The people involved in this process include technical content writers, research heads and graphics people. Once this process is completed the title gets uploader on our platform for our clients to read it.

Step 5: Final QC/QA Process:

This is the last process and comes when the client has ordered the study. In this process a final QA/QC is done before the study is emailed to the client. Since we believe in giving our clients a good experience of our research studies, therefore, to make sure that we do not lack at our end in any way humanly possible we do a final round of quality check and then dispatch the study to the client.

Key Segments: 

By Product

  • Equipment

    • Incubators

    • Laminar Flow Hood

    • Lab Air Filtration System

    • Micro Manipulation Systems

    • Centrifuges

    • Scopes

    • Spectrophotometer & Microarray Equipment

    • Sonicators & Homogenizers

    • Autoclaves & Sterilizers

    • Others

  • Disposables

    • Pipettes

    • Tips

    • Tubes

    • Gloves

    • Cuvettes

    • Masks

    • Dishes

    • Cell Imaging Consumables

    • Cell Culture Consumables

Request for Segment Customization as per your Business Requirement: Segment Customization Request 

Regional Coverage: 

North America

  • US

  • Canada

  • Mexico

Europe

  • Eastern Europe

    • Poland

    • Romania

    • Hungary

    • Turkey

    • Rest of Eastern Europe

  • Western Europe

    • Germany

    • France

    • UK

    • Italy

    • Spain

    • Netherlands

    • Switzerland

    • Austria

    • Rest of Western Europe

Asia Pacific

  • China

  • India

  • Japan

  • South Korea

  • Vietnam

  • Singapore

  • Australia

  • Rest of Asia Pacific

Middle East & Africa

  • Middle East

    • UAE

    • Egypt

    • Saudi Arabia

    • Qatar

    • Rest of Middle East

  • Africa

    • Nigeria

    • South Africa

    • Rest of Africa

Latin America

  • Brazil

  • Argentina

  • Colombia

  • Rest of Latin America

Request for Country Level Research Report: Country Level Customization Request 

Available Customization 

With the given market data, SNS Insider offers customization as per the company’s specific needs. The following customization options are available for the report: 

  • Detailed Volume Analysis 

  • Criss-Cross segment analysis (e.g. Product X Application) 

  • Competitive Product Benchmarking 

  • Geographic Analysis 

  • Additional countries in any of the regions 

  • Customized Data Representation 

  • Detailed analysis and profiling of additional market players


  •            5000 (33% Discount)


  •            8950 (40% Discount)


  •            3050 (23% Discount)

Start a Conversation

Hi! Click one of our member below to chat on Phone