Get More Information on Lab Automation Market - Request Sample Report
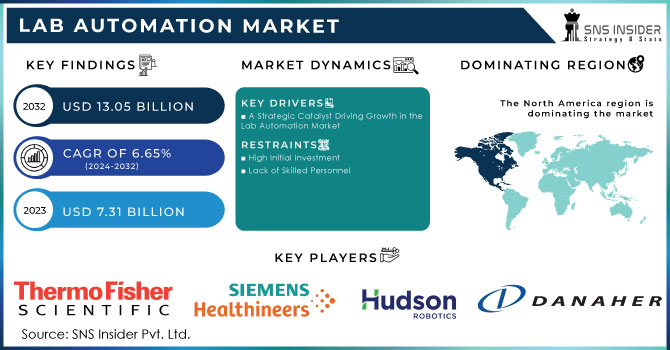
The Lab Automation Market size was estimated at USD 7.31 billion in 2023 and is expected to reach USD 13.05 billion by 2032, with a growing CAGR of 6.65% during the forecast period of 2024-2032.
The surge in demand for lab automation is primarily driven by the need for enhanced efficiency, accuracy, and safety within laboratory operations. The ability of robots and AI to execute tasks with precision, reducing human error, is a key factor. Moreover, the escalating volume of samples and the growing complexity of experiments necessitate automation to maintain productivity. The pivotal role of data in modern research has also fueled demand, as automated systems excel at data collection, analysis, and integration.
Demand for lab automation is particularly strong within academic and research institutions. These organizations seek to enhance productivity by automating time-consuming tasks, thereby freeing up researchers to focus on higher-level cognitive work. The expanding application of automated instruments in drug discovery and development is also expected to drive substantial market growth in the coming years. Miniaturization, expanding applications, and the need for high throughput are key drivers of the lab automation market. The demand for smaller, more efficient laboratory processes, coupled with the increasing complexity of scientific research, is accelerating the adoption of automated solutions. From drug discovery to clinical diagnostics, lab automation is being integrated into a wide range of applications, driving market growth. Additionally, the ability to process large volumes of samples efficiently through automation is a significant market opportunity.
Safety concerns, particularly when handling hazardous materials, have positioned lab automation as a crucial tool for risk mitigation. Industries such as drug discovery, diagnostics, and life sciences research are at the forefront of adopting automation to accelerate research, improve diagnostic accuracy, and tackle complex scientific challenges. However, high implementation costs and the need for specialized skills can hinder widespread adoption. Overcoming these obstacles and capitalizing on the burgeoning demand will be essential for the growth of the lab automation industry.
The supply of lab automation solutions is expanding rapidly as robotics capabilities advance. Robotics are evolving from tools for simple, repetitive tasks to versatile platforms capable of handling complex and dynamic laboratory workflows. This increased sophistication is driving the development of more sophisticated and adaptable automation systems, thereby expanding the supply of solutions for laboratories of all sizes.
For example, AI-powered systems can be used to analyze images and identify patterns that might be missed by human pathologists. Robotic arms can be used to automate tasks such as sample preparation and testing.
Lab automation is rapidly evolving with innovations like the Spinnaker 3 microplate mover. These user-friendly systems streamline workflows, boost accuracy, and accelerate research without demanding specialized training. This shift towards accessible automation is reshaping the future of laboratory efficiency.
Overall, the demand for lab automation is expected to grow in the coming years as diagnostic labs seek to improve efficiency, accuracy, and turnaround times. However, the supply of automated systems may be limited by factors such as cost and the availability of skilled workers to operate and maintain them.
Market Dynamics
Drivers
A Strategic Catalyst Driving Growth in the Lab Automation Market
Automation streamlines workflows accelerates processes, and enables laboratories to handle larger sample volumes. Simultaneously, the imperative for precision and accuracy, particularly in critical applications such as diagnostics and drug discovery, has fueled the demand for automation.
Moreover, the exponential growth of data in scientific research has necessitated efficient data management and analysis capabilities, which automation excels at providing. Beyond these operational benefits, automation contributes to cost reduction by optimizing resource utilization and minimizing labor expenses. It also plays a crucial role in enhancing laboratory safety by shielding personnel from hazardous materials. In an increasingly regulated environment, automation aids in ensuring compliance with stringent quality and regulatory standards. Ultimately, by accelerating research and development timelines, automation is a strategic tool for organizations seeking a competitive edge in today's fast-paced scientific landscape.
Restraints
High Initial Investment
The purchase and implementation of automated systems require significant upfront capital expenditure, which can be a barrier for smaller laboratories or institutions with limited budgets.
Lack of Skilled Personnel
Operating and maintaining complex automation systems require specialized expertise. A shortage of skilled labor can impede the effective utilization of these technologies.
By Process
In 2023, the continuous flow segment held the highest market share of 56.8% due to the rising usage of continuous flow in laboratories for the provision of high-quality services and the increased need for continuous flow systems in industries. In addition, continuous flow is one of the most popular procedures and is appropriate when a lot of samples need to be analyzed.
By Automation Type
In 2023, the modular automation systems segment dominated the market share of 51.7% due to the mix-and-match and flexibility features provided by modular automation systems. The increasing use of modular systems by end users is also another aspect promoting market expansion. These types of systems are appropriate for laboratories that require automation for particular procedures.
By End User
In 2023, the clinical chemistry analysis segment dominated the market growth with 27.3% due to factors such as technological advancements, increasing demand for automation in clinical chemistry labs for sample handling, storage, and labeling, as well as the growing preference for automated laboratory instruments.
Regional Analysis
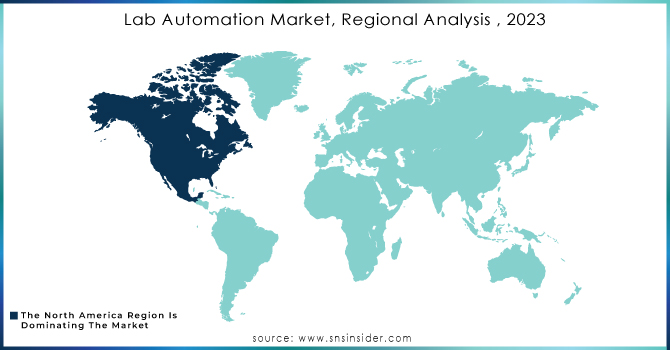
North America held a significant market share, growing with a CAGR of 35.9% in 2023, due to the presence of a well-established healthcare framework and the significant need for automation systems in laboratories because of their speed, consistency, and precision. Rising demand for integrated laboratory systems and government policies that promote research are further factors driving the market.
Asia-Pacific is witnessing the fastest CAGR rate of 8.6% during the forecast period due to the rising number of small and middle-sized laboratories in the area and the rising investments made by regional market leaders to introduce novel systems. Another aspect promoting the growth of the regional industry is the supportive government regulations for lab automation.
Get Customized Report as per Your Business Requirement - Request For Customized Report
Key Players
The major players are QIAGEN, PerkinElmer Inc., Thermo Fisher Scientific, Inc., Siemens Healthcare GmbH, Danaher, Agilent Technologies, Inc., Eppendorf SE, Hudson Robotics, Aurora Biomed Inc., BMG LABTECH GmbH, Tecan Trading AG, Hamilton Company, F. Hoffmann-La Roche Ltd, and Others.
Recent Developments
Abbott Laboratories (2023): Launched the GLP Systems Track lab automation system in India to streamline diagnostic laboratory workflows.
Kokilaben Dhirubhai Ambani Hospital (2023): Partnered with Roche Diagnostics to implement a total lab automation solution.
Recent Activities
Thermo Fisher Scientific: Continued to expand its product portfolio through acquisitions and new product launches, focusing on integrated solutions for various laboratory workflows.
Danaher Corporation: Leveraged its diverse business units to offer comprehensive automation solutions across different industries, such as diagnostics and life sciences.
Tecan Group: Introduced new automation platforms and software solutions to address the growing demand for high-throughput screening and sample management.
PerkinElmer: Expanded its presence in the genomics and drug discovery markets through product launches and strategic partnerships.
Report Attributes | Details |
Market Size in 2023 | US$ 7.31 Billion |
Market Size by 2032 | US$ 13.05 Billion |
CAGR | CAGR of 6.65% From 2024 to 2032 |
Base Year | 2023 |
Forecast Period | 2024-2032 |
Historical Data | 2020-2022 |
Report Scope & Coverage | Market Size, Segments Analysis, Competitive Landscape, Regional Analysis, DROC & SWOT Analysis, Forecast Outlook |
Key Segments | • By Process (Continuous Flow, Discrete Processing) • By Automation Type (Total Automation Systems, Modular Automation Systems) • By End User (Photometry & Fluorometry, Immunoassay Analysis, Electrolyte Analysis, Clinical Chemistry Analysis, Other end-user) |
Regional Analysis/Coverage | North America (US, Canada, Mexico), Europe (Eastern Europe [Poland, Romania, Hungary, Turkey, Rest of Eastern Europe] Western Europe] Germany, France, UK, Italy, Spain, Netherlands, Switzerland, Austria, Rest of Western Europe]), Asia Pacific (China, India, Japan, South Korea, Vietnam, Singapore, Australia, Rest of Asia Pacific), Middle East & Africa (Middle East [UAE, Egypt, Saudi Arabia, Qatar, Rest of Middle East], Africa [Nigeria, South Africa, Rest of Africa], Latin America (Brazil, Argentina, Colombia Rest of Latin America) |
Company Profiles | QIAGEN, PerkinElmer Inc., Thermo Fisher Scientific, Inc., Siemens Healthcare GmbH, Danaher, Agilent Technologies, Inc., Eppendorf SE, Hudson Robotics, Aurora Biomed Inc., BMG LABTECH GmbH, Tecan Trading AG, Hamilton Company, F. Hoffmann-La Roche Ltd |
Key Drivers | • A Strategic Catalyst Driving Growth in the Lab Automation Market |
Market Restraints | • High Initial Investment • Lack of Skilled Personnel |
Ans: The Lab Automation Market is expected to grow at 6.65% CAGR from 2024 to 2032.
Ans: According to our analysis, the Lab Automation Market is anticipated to reach USD 13.05 billion By 2032.
Ans: The leading participants are QIAGEN, PerkinElmer Inc., Thermo Fisher Scientific, Inc., Siemens Healthcare GmbH, Danaher, Agilent Technologies, Inc., Eppendorf SE, Hudson Robotics, Aurora Biomed Inc., BMG LABTECH GmbH, Tecan Trading AG, Hamilton Company, F. Hoffmann-La Roche Ltd, and Others.
Ans: Factors such as the increasing demand for integrated laboratory systems and supportive government legislation for research and the increasing range of applications for lab automation.
Ans: Yes, you may request customization based on your company's needs.
1. Introduction
1.1 Market Definition
1.2 Scope (Inclusion and Exclusions)
1.3 Research Assumptions
2. Executive Summary
2.1 Market Overview
2.2 Regional Synopsis
2.3 Competitive Summary
3. Research Methodology
3.1 Top-Down Approach
3.2 Bottom-up Approach
3.3. Data Validation
3.4 Primary Interviews
4. Market Dynamics Impact Analysis
4.1 Market Driving Factors Analysis
4.1.1 Drivers
4.1.2 Restraints
4.1.3 Opportunities
4.1.4 Challenges
4.2 PESTLE Analysis
4.3 Porter’s Five Forces Model
5. Statistical Insights and Trends Reporting
5.1 Adoption Rates, 2023
5.2 User Demographics, By User Type and Roles, 2023
5.3 Feature Analysis, by Feature Type
5.4 Cost Analysis, by Discrete Processing
5.5 Integration Capabilities
5.6 Regulatory Compliance, by Region
6. Competitive Landscape
6.1 List of Major Companies, By Region
6.2 Market Share Analysis, By Region
6.3 Product Benchmarking
6.3.1 Product specifications and features
6.3.2 Pricing
6.4 Strategic Initiatives
6.4.1 Marketing and promotional activities
6.4.2 Distribution and supply chain strategies
6.4.3 Expansion plans and new product launches
6.4.4 Strategic partnerships and collaborations
6.5 Technological Advancements
6.6 Market Positioning and Branding
7. Lab Automation Market Segmentation, by Process
7.1 Chapter Overview
7.2 Continuous Flow
7.2.1 Continuous Flow Market Trends Analysis (2020-2032)
7.2.2 Continuous Flow Market Size Estimates and Forecasts to 2032 (USD Million)
7.3 Discrete Processing
7.3.1 Discrete Processing Market Trends Analysis (2020-2032)
7.3.2 Discrete Processing Market Size Estimates and Forecasts to 2032 (USD Million)
8. Lab Automation Market Segmentation, by Automation Type
8.1 Chapter Overview
8.2 Total Automation Systems
8.2.1 Total Automation Systems Market Trends Analysis (2020-2032)
8.2.2 Total Automation SystemsMarket Size Estimates and Forecasts to 2032 (USD Million)
8.3 Modular Automation Systems
8.3.1 Modular Automation SystemsMarket Trends Analysis (2020-2032)
8.3.2 Modular Automation SystemsMarket Size Estimates and Forecasts to 2032 (USD Million)
9. Lab Automation Market Segmentation, by End User
9.1 Chapter Overview
9.2 Photometry & Fluorometry
9.2.1 Photometry & Fluorometry Market Trends Analysis (2020-2032)
9.2.2 Photometry & Fluorometry Market Size Estimates and Forecasts to 2032 (USD Million)
9.3 Immunoassay Analysis
9.3.1 Immunoassay Analysis Market Trends Analysis (2020-2032)
9.3.2 Immunoassay Analysis Market Size Estimates and Forecasts to 2032 (USD Million)
9.4 Electrolyte Analysis
9.4.1 Electrolyte Analysis Market Trends Analysis (2020-2032)
9.4.2 Electrolyte Analysis Market Size Estimates and Forecasts to 2032 (USD Million)
9.5 Clinical Chemistry Analysis
9.5.1 Clinical Chemistry Analysis Market Trends Analysis (2020-2032)
9.5.2 Clinical Chemistry Analysis Market Size Estimates and Forecasts to 2032 (USD Million)
9.6.1 Other end-user Market Trends Analysis (2020-2032)
9.6.2 Other end-user Market Size Estimates and Forecasts to 2032 (USD Million)
10. Regional Analysis
10.1 Chapter Overview
10.2 North America
10.2.1 Trends Analysis
10.2.2 North America Lab Automation Market Estimates and Forecasts, by Country (2020-2032) (USD Million)
10.2.3 North America Lab Automation Market Estimates and Forecasts, by Process (2020-2032) (USD Million)
10.2.4 North America Lab Automation Market Estimates and Forecasts, by Automation Type (2020-2032) (USD Million)
10.2.5 North America Lab Automation Market Estimates and Forecasts, by End User (2020-2032) (USD Million)
10.2.6 USA
10.2.6.1 USA Lab Automation Market Estimates and Forecasts, by Process (2020-2032) (USD Million)
10.2.6.2 USA Lab Automation Market Estimates and Forecasts, by Automation Type (2020-2032) (USD Million)
10.2.6.3 USA Lab Automation Market Estimates and Forecasts, by End User (2020-2032) (USD Million)
10.2.7 Canada
10.2.7.1 Canada Lab Automation Market Estimates and Forecasts, by Process (2020-2032) (USD Million)
10.2.7.2 Canada Lab Automation Market Estimates and Forecasts, by Automation Type (2020-2032) (USD Million)
10.2.7.3 Canada Lab Automation Market Estimates and Forecasts, by End User (2020-2032) (USD Million)
10.2.8 Mexico
10.2.8.1 Mexico Lab Automation Market Estimates and Forecasts, by Process (2020-2032) (USD Million)
10.2.8.2 Mexico Lab Automation Market Estimates and Forecasts, by Automation Type (2020-2032) (USD Million)
10.2.8.3 Mexico Lab Automation Market Estimates and Forecasts, by End User (2020-2032) (USD Million)
10.3 Europe
10.3.1 Eastern Europe
10.3.1.1 Trends Analysis
10.3.1.2 Eastern Europe Lab Automation Market Estimates and Forecasts, by Country (2020-2032) (USD Million)
10.3.1.3 Eastern Europe Lab Automation Market Estimates and Forecasts, by Process (2020-2032) (USD Million)
10.3.1.4 Eastern Europe Lab Automation Market Estimates and Forecasts, by Automation Type (2020-2032) (USD Million)
10.3.1.5 Eastern Europe Lab Automation Market Estimates and Forecasts, by End User (2020-2032) (USD Million)
10.3.1.6 Poland
10.3.1.6.1 Poland Lab Automation Market Estimates and Forecasts, by Process (2020-2032) (USD Million)
10.3.1.6.2 Poland Lab Automation Market Estimates and Forecasts, by Automation Type (2020-2032) (USD Million)
10.3.1.6.3 Poland Lab Automation Market Estimates and Forecasts, by End User (2020-2032) (USD Million)
10.3.1.7 Romania
10.3.1.7.1 Romania Lab Automation Market Estimates and Forecasts, by Process (2020-2032) (USD Million)
10.3.1.7.2 Romania Lab Automation Market Estimates and Forecasts, by Automation Type (2020-2032) (USD Million)
10.3.1.7.3 Romania Lab Automation Market Estimates and Forecasts, by End User (2020-2032) (USD Million)
10.3.1.8 Hungary
10.3.1.8.1 Hungary Lab Automation Market Estimates and Forecasts, by Process (2020-2032) (USD Million)
10.3.1.8.2 Hungary Lab Automation Market Estimates and Forecasts, by Automation Type (2020-2032) (USD Million)
10.3.1.8.3 Hungary Lab Automation Market Estimates and Forecasts, by End User (2020-2032) (USD Million)
10.3.1.9 Turkey
10.3.1.9.1 Turkey Lab Automation Market Estimates and Forecasts, by Process (2020-2032) (USD Million)
10.3.1.9.2 Turkey Lab Automation Market Estimates and Forecasts, by Automation Type (2020-2032) (USD Million)
10.3.1.9.3 Turkey Lab Automation Market Estimates and Forecasts, by End User (2020-2032) (USD Million)
10.3.1.10 Rest of Eastern Europe
10.3.1.10.1 Rest of Eastern Europe Lab Automation Market Estimates and Forecasts, by Process (2020-2032) (USD Million)
10.3.1.10.2 Rest of Eastern Europe Lab Automation Market Estimates and Forecasts, by Automation Type (2020-2032) (USD Million)
10.3.1.10.3 Rest of Eastern Europe Lab Automation Market Estimates and Forecasts, by End User (2020-2032) (USD Million)
10.3.2 Western Europe
10.3.2.1 Trends Analysis
10.3.2.2 Western Europe Lab Automation Market Estimates and Forecasts, by Country (2020-2032) (USD Million)
10.3.2.3 Western Europe Lab Automation Market Estimates and Forecasts, by Process (2020-2032) (USD Million)
10.3.2.4 Western Europe Lab Automation Market Estimates and Forecasts, by Automation Type (2020-2032) (USD Million)
10.3.2.5 Western Europe Lab Automation Market Estimates and Forecasts, by End User (2020-2032) (USD Million)
10.3.2.6 Germany
10.3.2.6.1 Germany Lab Automation Market Estimates and Forecasts, by Process (2020-2032) (USD Million)
10.3.2.6.2 Germany Lab Automation Market Estimates and Forecasts, by Automation Type (2020-2032) (USD Million)
10.3.2.6.3 Germany Lab Automation Market Estimates and Forecasts, by End User (2020-2032) (USD Million)
10.3.2.7 France
10.3.2.7.1 France Lab Automation Market Estimates and Forecasts, by Process (2020-2032) (USD Million)
10.3.2.7.2 France Lab Automation Market Estimates and Forecasts, by Automation Type (2020-2032) (USD Million)
10.3.2.7.3 France Lab Automation Market Estimates and Forecasts, by End User (2020-2032) (USD Million)
10.3.2.8 UK
10.3.2.8.1 UK Lab Automation Market Estimates and Forecasts, by Process (2020-2032) (USD Million)
10.3.2.8.2 UK Lab Automation Market Estimates and Forecasts, by Automation Type (2020-2032) (USD Million)
10.3.2.8.3 UK Lab Automation Market Estimates and Forecasts, by End User (2020-2032) (USD Million)
10.3.2.9 Italy
10.3.2.9.1 Italy Lab Automation Market Estimates and Forecasts, by Process (2020-2032) (USD Million)
10.3.2.9.2 Italy Lab Automation Market Estimates and Forecasts, by Automation Type (2020-2032) (USD Million)
10.3.2.9.3 Italy Lab Automation Market Estimates and Forecasts, by End User (2020-2032) (USD Million)
10.3.2.10 Spain
10.3.2.10.1 Spain Lab Automation Market Estimates and Forecasts, by Process (2020-2032) (USD Million)
10.3.2.10.2 Spain Lab Automation Market Estimates and Forecasts, by Automation Type (2020-2032) (USD Million)
10.3.2.10.3 Spain Lab Automation Market Estimates and Forecasts, by End User (2020-2032) (USD Million)
10.3.2.11 Netherlands
10.3.2.11.1 Netherlands Lab Automation Market Estimates and Forecasts, by Process (2020-2032) (USD Million)
10.3.2.11.2 Netherlands Lab Automation Market Estimates and Forecasts, by Automation Type (2020-2032) (USD Million)
10.3.2.11.3 Netherlands Lab Automation Market Estimates and Forecasts, by End User (2020-2032) (USD Million)
10.3.2.12 Switzerland
10.3.2.12.1 Switzerland Lab Automation Market Estimates and Forecasts, by Process (2020-2032) (USD Million)
10.3.2.12.2 Switzerland Lab Automation Market Estimates and Forecasts, by Automation Type (2020-2032) (USD Million)
10.3.2.12.3 Switzerland Lab Automation Market Estimates and Forecasts, by End User (2020-2032) (USD Million)
10.3.2.13 Austria
10.3.2.13.1 Austria Lab Automation Market Estimates and Forecasts, by Process (2020-2032) (USD Million)
10.3.2.13.2 Austria Lab Automation Market Estimates and Forecasts, by Automation Type (2020-2032) (USD Million)
10.3.2.13.3 Austria Lab Automation Market Estimates and Forecasts, by End User (2020-2032) (USD Million)
10.3.2.14 Rest of Western Europe
10.3.2.14.1 Rest of Western Europe Lab Automation Market Estimates and Forecasts, by Process (2020-2032) (USD Million)
10.3.2.14.2 Rest of Western Europe Lab Automation Market Estimates and Forecasts, by Automation Type (2020-2032) (USD Million)
10.3.2.14.3 Rest of Western Europe Lab Automation Market Estimates and Forecasts, by End User (2020-2032) (USD Million)
10.4 Asia Pacific
10.4.1 Trends Analysis
10.4.2 Asia Pacific Lab Automation Market Estimates and Forecasts, by Country (2020-2032) (USD Million)
10.4.3 Asia Pacific Lab Automation Market Estimates and Forecasts, by Process (2020-2032) (USD Million)
10.4.4 Asia Pacific Lab Automation Market Estimates and Forecasts, by Automation Type (2020-2032) (USD Million)
10.4.5 Asia Pacific Lab Automation Market Estimates and Forecasts, by End User (2020-2032) (USD Million)
10.4.6 China
10.4.6.1 China Lab Automation Market Estimates and Forecasts, by Process (2020-2032) (USD Million)
10.4.6.2 China Lab Automation Market Estimates and Forecasts, by Automation Type (2020-2032) (USD Million)
10.4.6.3 China Lab Automation Market Estimates and Forecasts, by End User (2020-2032) (USD Million)
10.4.7 India
10.4.7.1 India Lab Automation Market Estimates and Forecasts, by Process (2020-2032) (USD Million)
10.4.7.2 India Lab Automation Market Estimates and Forecasts, by Automation Type (2020-2032) (USD Million)
10.4.7.3 India Lab Automation Market Estimates and Forecasts, by End User (2020-2032) (USD Million)
10.4.8 Japan
10.4.8.1 Japan Lab Automation Market Estimates and Forecasts, by Process (2020-2032) (USD Million)
10.4.8.2 Japan Lab Automation Market Estimates and Forecasts, by Automation Type (2020-2032) (USD Million)
10.4.8.3 Japan Lab Automation Market Estimates and Forecasts, by End User (2020-2032) (USD Million)
10.4.9 South Korea
10.4.9.1 South Korea Lab Automation Market Estimates and Forecasts, by Process (2020-2032) (USD Million)
10.4.9.2 South Korea Lab Automation Market Estimates and Forecasts, by Automation Type (2020-2032) (USD Million)
10.4.9.3 South Korea Lab Automation Market Estimates and Forecasts, by End User (2020-2032) (USD Million)
10.4.10 Vietnam
10.4.10.1 Vietnam Lab Automation Market Estimates and Forecasts, by Process (2020-2032) (USD Million)
10.4.10.2 Vietnam Lab Automation Market Estimates and Forecasts, by Automation Type (2020-2032) (USD Million)
10.4.10.3 Vietnam Lab Automation Market Estimates and Forecasts, by End User (2020-2032) (USD Million)
10.4.11 Singapore
10.4.11.1 Singapore Lab Automation Market Estimates and Forecasts, by Process (2020-2032) (USD Million)
10.4.11.2 Singapore Lab Automation Market Estimates and Forecasts, by Automation Type (2020-2032) (USD Million)
10.4.11.3 Singapore Lab Automation Market Estimates and Forecasts, by End User (2020-2032) (USD Million)
10.4.12 Australia
10.4.12.1 Australia Lab Automation Market Estimates and Forecasts, by Process (2020-2032) (USD Million)
10.4.12.2 Australia Lab Automation Market Estimates and Forecasts, by Automation Type (2020-2032) (USD Million)
10.4.12.3 Australia Lab Automation Market Estimates and Forecasts, by End User (2020-2032) (USD Million)
10.4.13 Rest of Asia Pacific
10.4.13.1 Rest of Asia Pacific Lab Automation Market Estimates and Forecasts, by Process (2020-2032) (USD Million)
10.4.13.2 Rest of Asia Pacific Lab Automation Market Estimates and Forecasts, by Automation Type (2020-2032) (USD Million)
10.4.13.3 Rest of Asia Pacific Lab Automation Market Estimates and Forecasts, by End User (2020-2032) (USD Million)
10.5 Middle East and Africa
10.5.1 Middle East
10.5.1.1 Trends Analysis
10.5.1.2 Middle East Lab Automation Market Estimates and Forecasts, by Country (2020-2032) (USD Million)
10.5.1.3 Middle East Lab Automation Market Estimates and Forecasts, by Process (2020-2032) (USD Million)
10.5.1.4 Middle East Lab Automation Market Estimates and Forecasts, by Automation Type (2020-2032) (USD Million)
10.5.1.5 Middle East Lab Automation Market Estimates and Forecasts, by End User (2020-2032) (USD Million)
10.5.1.6 UAE
10.5.1.6.1 UAE Lab Automation Market Estimates and Forecasts, by Process (2020-2032) (USD Million)
10.5.1.6.2 UAE Lab Automation Market Estimates and Forecasts, by Automation Type (2020-2032) (USD Million)
10.5.1.6.3 UAE Lab Automation Market Estimates and Forecasts, by End User (2020-2032) (USD Million)
10.5.1.7 Egypt
10.5.1.7.1 Egypt Lab Automation Market Estimates and Forecasts, by Process (2020-2032) (USD Million)
10.5.1.7.2 Egypt Lab Automation Market Estimates and Forecasts, by Automation Type (2020-2032) (USD Million)
10.5.1.7.3 Egypt Lab Automation Market Estimates and Forecasts, by End User (2020-2032) (USD Million)
10.5.1.8 Saudi Arabia
10.5.1.8.1 Saudi Arabia Lab Automation Market Estimates and Forecasts, by Process (2020-2032) (USD Million)
10.5.1.8.2 Saudi Arabia Lab Automation Market Estimates and Forecasts, by Automation Type (2020-2032) (USD Million)
10.5.1.8.3 Saudi Arabia Lab Automation Market Estimates and Forecasts, by End User (2020-2032) (USD Million)
10.5.1.9 Qatar
10.5.1.9.1 Qatar Lab Automation Market Estimates and Forecasts, by Process (2020-2032) (USD Million)
10.5.1.9.2 Qatar Lab Automation Market Estimates and Forecasts, by Automation Type (2020-2032) (USD Million)
10.5.1.9.3 Qatar Lab Automation Market Estimates and Forecasts, by End User (2020-2032) (USD Million)
10.5.1.10 Rest of Middle East
10.5.1.10.1 Rest of Middle East Lab Automation Market Estimates and Forecasts, by Process (2020-2032) (USD Million)
10.5.1.10.2 Rest of Middle East Lab Automation Market Estimates and Forecasts, by Automation Type (2020-2032) (USD Million)
10.5.1.10.3 Rest of Middle East Lab Automation Market Estimates and Forecasts, by End User (2020-2032) (USD Million)
10.5.2 Africa
10.5.2.1 Trends Analysis
10.5.2.2 Africa Lab Automation Market Estimates and Forecasts, by Country (2020-2032) (USD Million)
10.5.2.3 Africa Lab Automation Market Estimates and Forecasts, by Process (2020-2032) (USD Million)
10.5.2.4 Africa Lab Automation Market Estimates and Forecasts, by Automation Type (2020-2032) (USD Million)
10.5.2.5 Africa Lab Automation Market Estimates and Forecasts, by End User (2020-2032) (USD Million)
10.5.2.6 South Africa
10.5.2.6.1 South Africa Lab Automation Market Estimates and Forecasts, by Process (2020-2032) (USD Million)
10.5.2.6.2 South Africa Lab Automation Market Estimates and Forecasts, by Automation Type (2020-2032) (USD Million)
10.5.2.6.3 South Africa Lab Automation Market Estimates and Forecasts, by End User (2020-2032) (USD Million)
10.5.2.7 Nigeria
10.5.2.7.1 Nigeria Lab Automation Market Estimates and Forecasts, by Process (2020-2032) (USD Million)
10.5.2.7.2 Nigeria Lab Automation Market Estimates and Forecasts, by Automation Type (2020-2032) (USD Million)
10.5.2.7.3 Nigeria Lab Automation Market Estimates and Forecasts, by End User (2020-2032) (USD Million)
10.5.2.8 Rest of Africa
10.5.2.8.1 Rest of Africa Lab Automation Market Estimates and Forecasts, by Process (2020-2032) (USD Million)
10.5.2.8.2 Rest of Africa Lab Automation Market Estimates and Forecasts, by Automation Type (2020-2032) (USD Million)
10.5.2.8.3 Rest of Africa Lab Automation Market Estimates and Forecasts, by End User (2020-2032) (USD Million)
10.6 Latin America
10.6.1 Trends Analysis
10.6.2 Latin America Lab Automation Market Estimates and Forecasts, by Country (2020-2032) (USD Million)
10.6.3 Latin America Lab Automation Market Estimates and Forecasts, by Process (2020-2032) (USD Million)
10.6.4 Latin America Lab Automation Market Estimates and Forecasts, by Automation Type (2020-2032) (USD Million)
10.6.5 Latin America Lab Automation Market Estimates and Forecasts, by End User (2020-2032) (USD Million)
10.6.6 Brazil
10.6.6.1 Brazil Lab Automation Market Estimates and Forecasts, by Process (2020-2032) (USD Million)
10.6.6.2 Brazil Lab Automation Market Estimates and Forecasts, by Automation Type (2020-2032) (USD Million)
10.6.6.3 Brazil Lab Automation Market Estimates and Forecasts, by End User (2020-2032) (USD Million)
10.6.7 Argentina
10.6.7.1 Argentina Lab Automation Market Estimates and Forecasts, by Process (2020-2032) (USD Million)
10.6.7.2 Argentina Lab Automation Market Estimates and Forecasts, by Automation Type (2020-2032) (USD Million)
10.6.7.3 Argentina Lab Automation Market Estimates and Forecasts, by End User (2020-2032) (USD Million)
10.6.8 Colombia
10.6.8.1 Colombia Lab Automation Market Estimates and Forecasts, by Process (2020-2032) (USD Million)
10.6.8.2 Colombia Lab Automation Market Estimates and Forecasts, by Automation Type (2020-2032) (USD Million)
10.6.8.3 Colombia Lab Automation Market Estimates and Forecasts, by End User (2020-2032) (USD Million)
10.6.9 Rest of Latin America
10.6.9.1 Rest of Latin America Lab Automation Market Estimates and Forecasts, by Process (2020-2032) (USD Million)
10.6.9.2 Rest of Latin America Lab Automation Market Estimates and Forecasts, by Automation Type (2020-2032) (USD Million)
10.6.9.3 Rest of Latin America Lab Automation Market Estimates and Forecasts, by End User (2020-2032) (USD Million)
11. Company Profiles
11.1 QIAGEN
11.1.1 Company Overview
11.1.2 Financial
11.1.3 Products/ Services Offered
11.1.4 SWOT Analysis
11.2 PerkinElmer Inc.
11.2.1 Company Overview
11.2.2 Financial
11.2.3 Products/ Services Offered
11.2.4 SWOT Analysis
11.3 Thermo Fisher Scientific, Inc.
11.3.1 Company Overview
11.3.2 Financial
11.3.3 Products/ Services Offered
11.3.4 SWOT Analysis
11.4 Siemens Healthcare GmbH
11.4.1 Company Overview
11.4.2 Financial
11.4.3 Products/ Services Offered
11.4.4 SWOT Analysis
11.5 Danaher
11.5.1 Company Overview
11.5.2 Financial
11.5.3 Products/ Services Offered
11.5.4 SWOT Analysis
11.6 Agilent Technologies, Inc.
11.6.1 Company Overview
11.6.2 Financial
11.6.3 Products/ Services Offered
11.6.4 SWOT Analysis
11.7 Eppendorf SE
11.7.1 Company Overview
11.7.2 Financial
11.7.3 Products/ Services Offered
11.7.4 SWOT Analysis
11.8 Hudson Robotics
11.8.1 Company Overview
11.8.2 Financial
11.8.3 Products/ Services Offered
11.8.4 SWOT Analysis
11.9 Aurora Biomed Inc.
11.9.1 Company Overview
11.9.2 Financial
11.9.3 Products/ Services Offered
11.9.4 SWOT Analysis
11.10 BMG LABTECH GmbH
11.10.1 Company Overview
11.10.2 Financial
11.10.3 Products/ Services Offered
11.10.4 SWOT Analysis
12. Use Cases and Best Practices
13. Conclusion
An accurate research report requires proper strategizing as well as implementation. There are multiple factors involved in the completion of good and accurate research report and selecting the best methodology to compete the research is the toughest part. Since the research reports we provide play a crucial role in any company’s decision-making process, therefore we at SNS Insider always believe that we should choose the best method which gives us results closer to reality. This allows us to reach at a stage wherein we can provide our clients best and accurate investment to output ratio.
Each report that we prepare takes a timeframe of 350-400 business hours for production. Starting from the selection of titles through a couple of in-depth brain storming session to the final QC process before uploading our titles on our website we dedicate around 350 working hours. The titles are selected based on their current market cap and the foreseen CAGR and growth.
The 5 steps process:
Step 1: Secondary Research:
Secondary Research or Desk Research is as the name suggests is a research process wherein, we collect data through the readily available information. In this process we use various paid and unpaid databases which our team has access to and gather data through the same. This includes examining of listed companies’ annual reports, Journals, SEC filling etc. Apart from this our team has access to various associations across the globe across different industries. Lastly, we have exchange relationships with various university as well as individual libraries.
Step 2: Primary Research
When we talk about primary research, it is a type of study in which the researchers collect relevant data samples directly, rather than relying on previously collected data. This type of research is focused on gaining content specific facts that can be sued to solve specific problems. Since the collected data is fresh and first hand therefore it makes the study more accurate and genuine.
We at SNS Insider have divided Primary Research into 2 parts.
Part 1 wherein we interview the KOLs of major players as well as the upcoming ones across various geographic regions. This allows us to have their view over the market scenario and acts as an important tool to come closer to the accurate market numbers. As many as 45 paid and unpaid primary interviews are taken from both the demand and supply side of the industry to make sure we land at an accurate judgement and analysis of the market.
This step involves the triangulation of data wherein our team analyses the interview transcripts, online survey responses and observation of on filed participants. The below mentioned chart should give a better understanding of the part 1 of the primary interview.
Part 2: In this part of primary research the data collected via secondary research and the part 1 of the primary research is validated with the interviews from individual consultants and subject matter experts.
Consultants are those set of people who have at least 12 years of experience and expertise within the industry whereas Subject Matter Experts are those with at least 15 years of experience behind their back within the same space. The data with the help of two main processes i.e., FGDs (Focused Group Discussions) and IDs (Individual Discussions). This gives us a 3rd party nonbiased primary view of the market scenario making it a more dependable one while collation of the data pointers.
Step 3: Data Bank Validation
Once all the information is collected via primary and secondary sources, we run that information for data validation. At our intelligence centre our research heads track a lot of information related to the market which includes the quarterly reports, the daily stock prices, and other relevant information. Our data bank server gets updated every fortnight and that is how the information which we collected using our primary and secondary information is revalidated in real time.
Step 4: QA/QC Process
After all the data collection and validation our team does a final level of quality check and quality assurance to get rid of any unwanted or undesired mistakes. This might include but not limited to getting rid of the any typos, duplication of numbers or missing of any important information. The people involved in this process include technical content writers, research heads and graphics people. Once this process is completed the title gets uploader on our platform for our clients to read it.
Step 5: Final QC/QA Process:
This is the last process and comes when the client has ordered the study. In this process a final QA/QC is done before the study is emailed to the client. Since we believe in giving our clients a good experience of our research studies, therefore, to make sure that we do not lack at our end in any way humanly possible we do a final round of quality check and then dispatch the study to the client.
Key Segments:
By Process
Continuous Flow
By Workflow
Sequential Processing
Parallel Processing
By Components
Consumables
Equipment
Discrete Processing
By Method
Centrifugal Discrete Processing
Random Access Discrete Processing
By Components
Consumables
Equipment
By Workflow
Dependent Analysis
Independent Analysis
By Automation Type
Total Automation Systems
By Steps
Pre-analysis
Centrifugation
Sample Preparation
Sample Sorting
Transport Mechanisms
Liquid Handling
Sample Storage
Sample Analysis
Modular Automation Systems
By Steps
Specimen Acquisition & Identification & Labelling
Transport Mechanisms
Sample Preparation
Sample Loading & Aspiration
Reagent Handling & Storage
Sample Analysis & Measurements
By End User
Photometry & Fluorometry
Immunoassay Analysis
Electrolyte Analysis
Clinical Chemistry Analysis
Other end-user
Request for Segment Customization as per your Business Requirement: Segment Customization Request
Regional Coverage:
North America
US
Canada
Mexico
Europe
Eastern Europe
Poland
Romania
Hungary
Turkey
Rest of Eastern Europe
Western Europe
Germany
France
UK
Italy
Spain
Netherlands
Switzerland
Austria
Rest of Western Europe
Asia Pacific
China
India
Japan
South Korea
Vietnam
Singapore
Australia
Rest of Asia Pacific
Middle East & Africa
Middle East
UAE
Egypt
Saudi Arabia
Qatar
Rest of Middle East
Africa
Nigeria
South Africa
Rest of Africa
Latin America
Brazil
Argentina
Colombia
Rest of Latin America
Request for Country Level Research Report: Country Level Customization Request
Available Customization
With the given market data, SNS Insider offers customization as per the company’s specific needs. The following customization options are available for the report:
Product Analysis
Criss-Cross segment analysis (e.g. Product X Application)
Product Matrix which gives a detailed comparison of product portfolio of each company
Geographic Analysis
Additional countries in any of the regions
Company Information
Detailed analysis and profiling of additional market players (Up to five)
The AI In Medical Imaging Market was USD 1.76 billion in 2023 and is expected to Reach USD 23.65 billion by 2032 and grow at a CAGR of 33.48% over the forecast period of 2024-2032.
The Single-Use Bioreactors Market Size was valued at USD 3872.40 million in 2023 and is expected to reach USD 13784.83 million by 2031 and grow at a CAGR of 17.2% over the forecast period 2024-2031.
The Medical Image Management Market Size was valued at USD 5.93 billion in 2023, and is expected to reach USD 10.77 billion by 2032, and grow at a CAGR of 6.86% over the forecast period 2024-2032.
The Ultrasound Probe Disinfection Market size was estimated at USD 573.04 million in 2023 and is expected to reach USD 1819.84 million by 2032 with a growing CAGR of 13.7% during the forecast period of 2024-2032.
The global medical x-ray market is projected to reach 24.50 billion by 2032 which is anticipated to expand at a CAGR of 6.22% from 2024 to 2032.
The High Throughput Screening Market Size was valued at USD 25.80 billion in 2023 and is witnessed to reach USD 69.46 Billion by 2032 and grow at a CAGR of 12.18% over the forecast period 2024-2032.
Hi! Click one of our member below to chat on Phone