K-12 Education Market Report Scope and Overview:
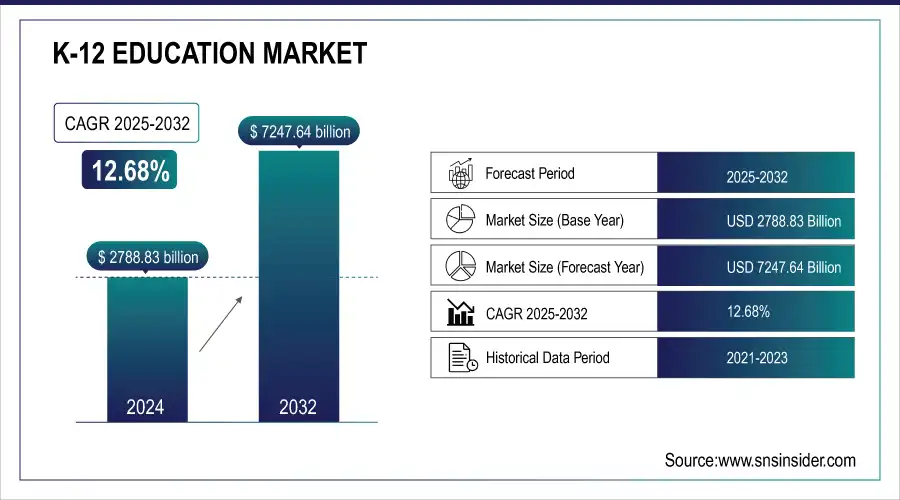
The K-12 Education Market was valued at USD 2788.83 Billion in 2025E and is expected to reach USD 7247.64 Billion by 2033, growing at a CAGR of 12.68% from 2026-2033.
K-12 Education Market Size and Forecast:
-
Market Size in 2025E: USD 2,788.83 Billion
-
Market Size by 2033: USD 7,247.64 Billion
-
CAGR: 12.68% from 2026 to 2033
-
Base Year: 2025
-
Forecast Period: 2026–2033
-
Historical Data: 2022–2024
Get more information on K-12 Education Market - Request Free Sample Report
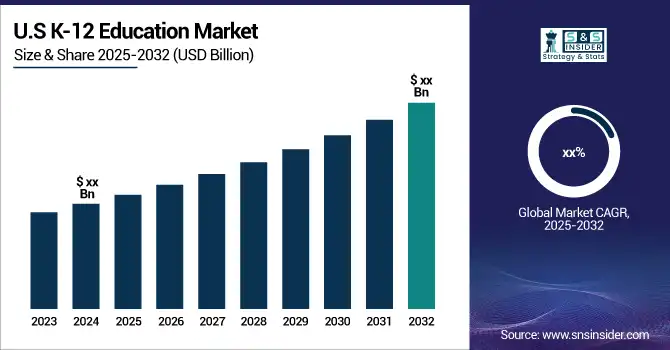
The U.S. K-12 Education market size was valued at an estimated USD 1,050.00 billion in 2025 and is projected to reach USD 2,750.00 billion by 2033, growing at a CAGR of 12.1% over the forecast period 2026–2033. Market growth is driven by increasing student enrollment, rising government and private sector investments in education infrastructure, and the growing adoption of digital learning platforms across public and private schools. Expanding use of e-learning tools, AI-enabled personalized learning solutions, and hybrid education models is accelerating market expansion. Additionally, federal and state funding initiatives, curriculum modernization, and increasing focus on STEM education and skill-based learning further strengthen the growth outlook of the U.S. K-12 education market during the forecast period.
K-12 Education Market Highlights:
-
The K-12 education industry is rapidly transforming due to technology, government initiatives, and a shift toward individualized learning experiences, with AI, interactive tools, and digital materials enhancing student engagement and providing adaptive learning pathways.
-
Governments worldwide are investing in infrastructure, curriculum modernization, and teacher training to improve educational equity, student performance, and mental health programs.
-
Personalized learning models, project-based learning, elective choices, and blended learning environments are gaining traction, supported by increasing access to digital devices and internet connectivity in rural areas.
-
The rise of online and hybrid learning models has increased the demand for digital learning tools, virtual classrooms, cloud-based learning management systems, and gamified educational resources.
-
Growing reliance on technology emphasizes the importance of teaching digital literacy and ensuring students can effectively learn and collaborate through digital platforms.
-
The proliferation of online educational content can lead to inconsistent quality, fragmented curricula, and challenges in maintaining uniform learning experiences, highlighting the need for content curation and quality standards.
The K-12 education industry is undergoing a significant transition accelerated by technology, government policy, and a shift in focus to a more individualized experience. One of the major contributors to this growth is the use of educational technology as a means of enhancing the experience of learning. AI technology, interactive tools, and digital teaching materials contribute to new engagement mechanisms at the student level and influence individual learning pathways. By providing adaptive learning experiences based on the individual requirements of each student, directly in the classroom, these advances are giving tailored tuition plans and immediate feedback, improving the quality of teaching. Governments worldwide are also significant contributors to the growth of the market as they are making more investments in education. Such as improving infrastructure, curriculum, and teacher training. For instance, much of the funding going toward improving educational equity includes most K-12 students' academic performance and mental health programs, which are efforts to bridge the educational inequities gap and provide all students with better access to good education in the United States.
Rapidly growing interest in personalized learning models, including project-based learning, elective choices and flexible, and blended learning environments where students learn at their own pace and on their own time may also be making a comeback. Such trends have been further enabled by the rise of technology and educational reforms favoring student-centered learning. This is contributing to the higher market growth due to the increasing focus on digital literacy and digital devices and the internet is reaching students even in rural areas, creating a more inclusive and adaptable teaching-learning environment.
K-12 Education Market Drivers:
-
The rise of online and hybrid learning models, accelerated by the pandemic, has increased the demand for digital learning tools.
The transition to online and hybrid learning modes has radically changed the K-12 education market and that was particularly true post-COVID-19 pandemic. As schools transitioned to remote learning to ensure learning continuity during lockdowns, digital learning tools became essential for delivering lessons and nurturing student engagement. This shift has led to the increasing use of online platforms, virtual classrooms, and engaging learning resources. Offering a potential solution to this challenge, hybrid learning combines face-to-face and virtual instruction, enabling students to log in from home or access the classroom for a tailored experience to fit their current situation.
As students engage with dynamic, interactive content that provides real-time assessments and allows for virtual collaboration with teachers, the need for digital learning tools has continued to grow. Tools such as video conferencing, cloud-based learning management systems, and gamified learning have been essential to successfully upholding the highest standards of education in a digital-first world. Furthermore, as tech dependency increases, it has been more important than ever for schools to provide the tools that will teach students digital literacy: How to learn from and work through technology. With the adoption of many digital solutions to meet the needs of students, K-12 education will continue to deliver a substantial portion of instruction through hybrid learning models, which ensure flexible, broad access to content. Along with this, the demand for digital content, virtual classrooms, and interactive tools is on the rise, creating new opportunities for EdTech companies and transforming the future of education.
K-12 Education Market Restraints:
-
The proliferation of online educational content can lead to inconsistent quality, making it difficult to ensure a uniform learning experience.
The evolution of the steady stream of online educational content within the K -12 education market has created platforms for personalized and flexible learning. At the same time, however, it has led to some problems with the quality and consistency of the content. As digital resources in the form of courses, videos, and interactive tools have dramatically expanded, educators, students, and parents alike struggle to distinguish high-quality content from inferior content. These variations in quality could create inconsistencies experienced by students and in turn impact educational outcomes. One of the key problems is inconsistent content across the platforms. Although certain of these educational tools are distributed from respectable schools or specialists, others may come from less solid sources. Consequently, students may stumble upon unearthed, inaccurate, or poorly structured material that scatters their learning process. In addition, the diverse content types such as video lessons, quizzes, and games can lead to variations in user engagement and learning outcomes.
In one more factor, there is a unification of curriculum between digital platforms which will only leave the learning experience fragmented. It instead presents a challenge for teachers and schools to combine online resources with their current lesson plans, resulting in milk gaps, or the learning process not continued. Addressing these challenges will require more quality control, curation, and standards that ensure online resources provide the same high-quality learning experiences for all students.
K-12 Education Market Segment Analysis:
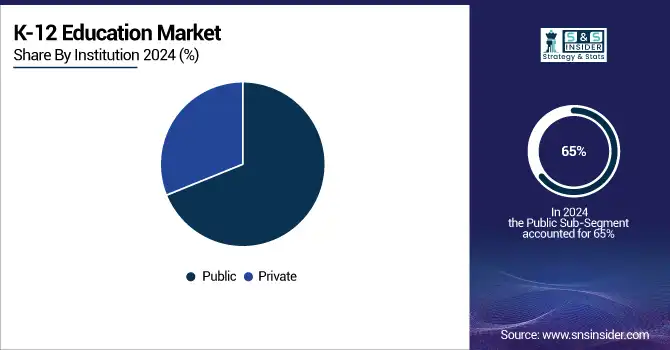
By Institution
Public institutes dominated the market and generated the most revenue of 65% in the market in 2025 due to initiatives like Sarva Shiksha Abhiyan, and the Right to Education Act by the government to universalize access to good quality education. Public school funding has received attention, leading to improvements in infrastructure, teacher training, and learning materials. Also, public schools which provide education at economic rates have made it possible for rural areas and families that belong to weaker sections of society to get education; where it is not economically feasible for private schools to establish themselves. Moreover, the unequal approach and commitment to high standard sections, such as a unified curriculum and quality control, that companies promise tend to increase the appeal of public institutions, getting government investments into training programs and leading to a higher quality of teaching, too.
The private segment is expected to register the fastest CAGR during the forecast period. Parents looking for their kids to get the best education possible then turn their heads towards private schools, which typically offer smaller class sizes, experienced teachers, and an experienced curriculum to meet these needs. Some say that private schools can offer such low student-to-teacher ratios that they can tailor education to the individual needs and learning styles of children. In addition, the focus on extracurricular activities and integration of educational technologies by the private sector is another factor anticipated to propel the growth of this segment in the market.
By Application
In 2025, the high school (9-12) segment dominated the market and held a revenue share of 49%. The segment growth is fueled by a new emphasis on college and career readiness, which is creating demand for programs that develop key competencies such as problem-solving and communication. Technological advancement, especially in tools available through educational technology, has put high schools on the leading edge of personalized learning and other innovations that help students achieve academically. Increased diversity in the educational portfolio, with a mixture of vocational development and industrial placements attracting a wider range of students, while intense standardised testing and university admissions create a demand for teaching services and materials to get better exam results. Furthermore, the growth of the segment is due to the government initiatives investing in high school education.
The middle school (6-8) segment is expected to anticipate the fastest CAGR during the forecast period. Parental awareness regarding the significance of quality education for their children's academic success is resulting in the segment’s growth and subsequently boosting demand. This, in turn, sparks an increased demand for quality educational programming. Additionally, the middle school portion of the market gains from the increased global focus on STEM education as it introduces students to these topics early on, and acts to build strong STEM programs. As a result, the quality and STEM education gap enables the middle school segment to grow in the forecast years.
K-12 Education Market Regional Analysis:
North America K-12 Education Market Trends:
North America dominated the market with the region holding a 38% share in 2025 It is now a leader in the digital education space, incorporating tools and platforms like adaptive learning software and interactive whiteboards at breakneck speed. The deep pockets of VCs and government funding for EdTech companies can still nurture innovations and variation for educational solutions. With a high rate of internet penetration, people can access technology that provides opportunities for online learning, sharing resources, and remote collaboration.

Need any customization research on K-12 Education Market - Enquiry Now
Asia-Pacific K-12 Education Market Trends:
Asia Pacific is expected to show the fastest growth over the forecast period owing to the massive and fastest-growing population in countries such as India and China. Population growth drives the need for educational facilities at all levels but in K-12 education specifically. Moreover, some Asian governments play an active role in improving K-12 education by launching plans for curriculum modernization, teacher training programs, and digital infrastructure development to support the growth of the K-12 education market.
Europe K-12 Education Market Trends:
Europe holds a significant share of the K–12 education market, driven by strong government initiatives to integrate digital learning solutions and interactive classroom technologies. Countries such as the UK, Germany, and France are investing heavily in EdTech adoption, including virtual learning environments and adaptive learning software. High digital literacy, stable infrastructure, and supportive policies accelerate the adoption of e-learning platforms, fostering personalized and blended learning experiences.
Latin America K-12 Education Market Trends:
Latin America is witnessing moderate growth in the K–12 education market, supported by increasing government focus on digital education and infrastructure expansion. Countries like Brazil and Mexico are investing in online learning platforms and smart classroom technologies to address educational gaps. While internet penetration and funding are improving, disparities in access and regional infrastructure remain challenges that are gradually being addressed.
Middle East & Africa (MEA) K-12 Education Market Trends:
The MEA region is expected to grow steadily, driven by government initiatives to improve access to quality education and implement digital learning solutions. Countries like the UAE, Saudi Arabia, and South Africa are investing in EdTech platforms, e-learning solutions, and interactive classroom tools. Growth is supported by increasing private sector involvement, public-private partnerships, and rising awareness of the benefits of technology-enabled education.
K-12 Education Market Key Players:
-
Google for Education – Offers tools like Google Classroom and Google Meet to facilitate digital learning environments.
-
Microsoft Education – Provides Microsoft Teams for Education, integrating Office 365 tools for collaborative learning.
-
Pearson – Delivers MyLab & Mastering, digital platforms for personalized learning experiences.
-
Apple Education – Supports institutions with Apple School Manager and a range of educational apps.
-
Khan Academy – Offers free educational resources, including Khan Academy Kids for early learners.
-
Blackboard – Provides Blackboard Learn, a comprehensive learning management system.
-
Chegg – Offers Chegg Study, providing homework help and textbook solutions.
-
Duolingo – Features Duolingo for Schools, a platform for language learning and classroom integration.
-
Coursera – Offers Coursera for Campus, providing access to online courses and degrees.
-
Edmodo – Provides Edmodo Classroom, a communication platform for students and teachers.
-
Schoology – Offers Schoology Learning Management System, facilitating course management and collaboration.
-
Canvas by Instructure – Provides Canvas LMS, a scalable learning management system.
-
SMART Technologies – Offers SMART Learning Suite, interactive classroom technology solutions.
-
PowerSchool – Provides a suite of K–12 education technology solutions, including student information systems.
-
Edmentum – Offers personalized learning programs and educational consulting services.
-
Nearpod – Provides interactive lessons and formative assessments for K–12 classrooms.
-
DreamBox Learning – Offers adaptive math programs for personalized learning.
-
Newsela – Provides leveled reading materials to support literacy development.
-
Panorama Education – Offers tools for social-emotional learning and student feedback.
-
ClassLink – Provides single sign-on solutions and application access management.
K-12 Education Market Competitive Landscape:
Google LLC – Established in 1998, Google is a global technology leader specializing in search, cloud computing, software, and digital services. The company provides innovative educational solutions through Google for Education, including Google Classroom. In January 2024, Google launched new AI-powered tools for Classroom to help teachers with grading and deliver personalized feedback to students.
-
January 2024: Google announced the launch of new AI-powered tools for Google Classroom to assist teachers with grading and personalized feedback for students.
Microsoft Corporation – Established in 1975, Microsoft is a global technology company providing software, cloud services, and productivity solutions. Its Microsoft Teams for Education platform supports collaboration and learning for K–12 and higher education. In February 2024, Microsoft launched new accessibility features in Teams for Education, enhancing support for students with disabilities and improving tools for educators.
-
February 2024: Microsoft launched new accessibility features in Microsoft Teams for Education, enhancing support for students with disabilities and improving collaboration tools for educators.
Pearson plc – Established in 1844, Pearson is a leading educational publisher and digital learning company offering solutions for K–12 and higher education. In March 2024, Pearson unveiled an updated version of its MyLab & Mastering platform, integrating interactive features and personalized learning pathways to enhance engagement and learning outcomes for K–12 students.
-
March 2024: Pearson unveiled an updated version of its MyLab & Mastering platform, integrating more interactive features and personalized learning pathways for K-12 students.
| Report Attributes | Details |
|---|---|
| Market Size in 2025E | USD 2788.83 Billion |
| Market Size by 2033 | USD 7247.64 Billion |
| CAGR | CAGR of 12.68% From 2026 to 2033 |
| Base Year | 2025 |
| Forecast Period | 2026-2033 |
| Historical Data | 2022-2024 |
| Report Scope & Coverage | Market Size, Segments Analysis, Competitive Landscape, Regional Analysis, DROC & SWOT Analysis, Forecast Outlook |
| Key Segments | • By Application (Elementary School, Middle School, High School) • By Institution (Public, Private) • By Delivery Mode (Online, Offline) |
| Regional Analysis/Coverage | North America (US, Canada), Europe (Germany, UK, France, Italy, Spain, Russia, Poland, Rest of Europe), Asia Pacific (China, India, Japan, South Korea, Australia, ASEAN Countries, Rest of Asia Pacific), Middle East & Africa (UAE, Saudi Arabia, Qatar, South Africa, Rest of Middle East & Africa), Latin America (Brazil, Argentina, Mexico, Colombia, Rest of Latin America). |
| Company Profiles |
Google for Education, Microsoft Education, Pearson, Apple Education, Khan Academy, Blackboard, Chegg, Duolingo, Coursera, Edmodo, Schoology, Canvas by Instructure, SMART Technologies, PowerSchool, Edmentum, Nearpod, DreamBox Learning, Newsela, Panorama Education, ClassLink |
