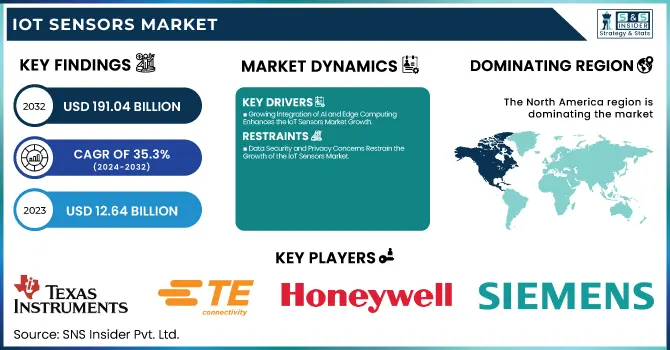
The IoT Sensors Market Size was valued at USD 12.64 Billion in 2023 and is expected to reach USD 191.04 Billion by 2032 and grow at a CAGR of 35.3% over the forecast period 2024-2032. The market is growing rapidly, driven by the adoption of smart technologies across industries such as healthcare, automotive, industrial automation, and smart homes. IoT sensors enable real-time monitoring, automation, and data-driven decision-making, fueled by AI, 5G, and edge computing advancements.
To Get more information on IoT Sensors Market - Request Free Sample Report
Key growth factors include rising demand for real-time solutions, sensor miniaturization, and Industry 4.0 investments, while data security, high costs, and interoperability remain challenges. The market is shifting toward wireless, battery-operated, and AI-powered sensors, with sustainability and regulatory compliance shaping innovation. As industries embrace digitalization, the IoT sensors market presents vast opportunities for R&D, new products, and strategic collaborations.
Key Drivers:
Growing Integration of AI and Edge Computing Enhances the IoT Sensors Market Growth
The increasing integration of AI and edge computing in IoT sensors is a major driver fueling market growth. AI-powered sensors enable real-time data analysis, predictive maintenance, and automation, reducing latency and improving efficiency across industries like smart homes, healthcare, and industrial automation. Edge computing further enhances sensor capabilities by processing data locally, minimizing the need for cloud dependency and enabling faster decision-making.
These technologies optimize energy consumption and improve security by reducing data transmission vulnerabilities. Industries leveraging AI-driven IoT sensors benefit from enhanced operational efficiency, reduced downtime, and lower maintenance costs. With 5G connectivity and advanced machine learning algorithms, AI-integrated IoT sensors are expected to revolutionize applications such as autonomous vehicles, smart cities, and precision agriculture. This trend is driving significant investments in R&D, making AI and edge computing a key growth accelerator for the IoT sensors market.
Restrain:
Data Security and Privacy Concerns Restrain the Growth of the IoT Sensors Market
Data security and privacy issues are significant restraints in the IoT sensors market, limiting their widespread adoption across industries. IoT sensors collect and transmit vast amounts of sensitive data, including personal, industrial, and medical information, making them prime targets for cyberattacks and unauthorized access. The lack of standardized security protocols across different IoT ecosystems increases vulnerabilities, leading to potential data breaches, hacking, and compliance risks. Many organizations hesitate to adopt IoT sensors due to concerns about data integrity, regulatory compliance (such as GDPR), and consumer trust.
Additionally, end-to-end encryption, authentication mechanisms, and secure firmware updates require continuous advancements, adding to implementation costs. Governments and regulatory bodies are enforcing strict cybersecurity measures, but businesses must invest in robust security frameworks, blockchain-based authentication, and AI-driven threat detection to mitigate risks. Addressing data security challenges is crucial to sustaining market growth and ensuring widespread IoT sensor adoption.
Opportunities:
Rising Adoption of Smart Cities and Infrastructure Development Creates Opportunities in the IoT Sensors Market
The rapid development of smart cities and infrastructure projects presents a significant opportunity for IoT sensor adoption. Governments and urban planners are leveraging IoT sensors to enable real-time monitoring, automation, and data-driven decision-making in sectors like traffic management, energy efficiency, waste management, and public safety. IoT sensors integrated with AI, cloud computing, and 5G networks are revolutionizing city operations, improving efficiency, sustainability, and connectivity.
Additionally, IoT-enabled surveillance systems and environmental monitoring sensors enhance urban security and sustainability. Governments worldwide are investing in smart infrastructure initiatives, creating a massive demand for scalable, low-power, and wireless IoT sensors. As cities move toward digital transformation, IoT sensor manufacturers have opportunities to collaborate with municipal bodies and tech firms, driving market expansion.
Challenges:
High Deployment and Maintenance Costs Pose Challenges to IoT Sensors Market Expansion
The high cost of deploying and maintaining IoT sensors remains a major challenge in market growth. IoT sensor integration requires advanced hardware, software platforms, and network infrastructure, making initial setup costly, especially for small and medium-sized enterprises (SMEs). The complexity of IoT sensor ecosystems necessitates continuous updates, firmware upgrades, and cybersecurity enhancements, leading to recurring expenses.
Additionally, sensor maintenance in harsh environments such as industrial sites, oil & gas fields, and remote locations is costly and labour-intensive. Limited battery life, calibration needs, and sensor replacement add to the financial burden. Many organizations struggle with interoperability issues due to diverse IoT protocols, increasing the cost of integration with existing systems. To overcome these challenges, manufacturers are focusing on energy-efficient designs, low-cost sensors, and AI-driven predictive maintenance solutions. However, reducing deployment costs remains critical for wider adoption across industries.
By Type
The motion sensors segment led the IoT sensors market in 2023, accounting for 37% of total revenue, driven by increasing adoption in smart homes, industrial automation, automotive safety, and healthcare applications. Motion sensors, including accelerometers, gyroscopes, and infrared sensors, enable precise object detection, movement tracking, and security enhancements. Companies like STMicroelectronics, Bosch, and Murata Manufacturing have launched advanced motion sensors to meet the growing demand. The rise of AI-powered IoT motion sensors is revolutionizing automation, enabling predictive maintenance, smart surveillance, and autonomous navigation. With the expansion of Industry 4.0 and smart infrastructure, motion sensors will remain crucial in enhancing efficiency, security, and user experiences, further solidifying their market dominance.
The light sensors segment is experiencing the fastest growth in the IoT sensors market, projected at a CAGR of 36.8% during the forecast period. Increasing integration of ambient light sensors, photodetectors, and proximity sensors in smart lighting, automotive, and environmental monitoring is fueling demand.
Meanwhile, Analog Devices launched an AI-powered optical sensor, enabling energy-efficient smart lighting and automation. The rise of connected devices, smart cities, and sustainable energy solutions is further boosting adoption. In the automotive sector, NXP Semiconductor’s light sensors enhance adaptive headlights and driver-assist systems. IoT-enabled light sensors are revolutionizing energy conservation and smart infrastructure, playing a key role in automated lighting control, daylight harvesting, and environmental sensing. With rising demand for energy-efficient and adaptive technologies, light sensors are becoming essential in next-generation IoT ecosystems.
By End-Use
The consumer electronics segment led the IoT sensors market in 2023, driven by the growing demand for smartphones, wearables, smart home devices, and connected appliances. IoT sensors play a critical role in enhancing user experience, automation, and energy efficiency in consumer devices. Leading companies have been actively launching innovative sensor-based products to meet rising demand.
Additionally, Murata and Bosch Sensortec have developed MEMS motion sensors and environmental sensors, widely used in wearables and smart home devices. The expansion of 5G, AI-powered assistants, and connected ecosystems is accelerating IoT sensor adoption in consumer electronics. As demand for smart, automated, and energy-efficient devices grows, IoT sensors will continue to drive innovation, solidifying this segment’s dominant position in the market.
The automotive & transportation segment is the fastest-growing sector in the IoT sensors market, projected to expand during the forecast period 2024-2032. The rise of autonomous vehicles, advanced driver-assistance systems (ADAS), and connected mobility solutions is fueling demand for IoT sensors in this sector. Companies are launching innovative sensor technologies to enhance vehicle safety, navigation, and efficiency. The increasing adoption of V2X (Vehicle-to-Everything) communication, fleet telematics, and predictive maintenance is further accelerating IoT sensor deployment. As the industry shifts toward electric and autonomous mobility, IoT sensors will be crucial in enhancing safety, reducing emissions, and enabling smart transportation networks, driving rapid growth in this segment.
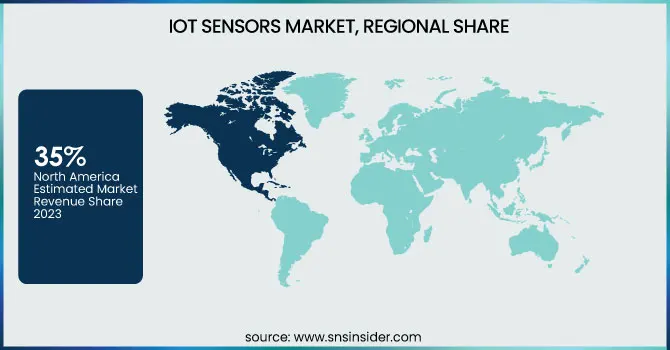
North America held the largest share in the IoT sensors market in 2023, accounting for an estimated 35% of total revenue, driven by high adoption of smart technologies, strong IoT infrastructure, and significant R&D investments. The region's leadership is fueled by advancements in smart homes, industrial automation, connected healthcare, and automotive IoT. Companies like Texas Instruments, Honeywell, and Analog Devices are actively innovating sensor technologies to meet rising demand.
Additionally, General Electric (GE) has integrated predictive maintenance IoT sensors into industrial machinery, optimizing performance and reducing downtime. The growing adoption of 5G, AI-driven analytics, and cloud-based IoT platforms in North America has further accelerated sensor deployment. With continuous advancements in IoT security, edge computing, and connected ecosystems, North America is expected to maintain its dominance in the IoT sensors market.
Asia Pacific is the fastest-growing region in the IoT sensors market, projected to expand at a CAGR of over 38% during the forecast period. The region's growth is driven by rapid urbanization, increasing adoption of smart manufacturing, and government initiatives for IoT expansion. Countries like China, Japan, and India are heavily investing in smart cities, Industry 4.0, and connected healthcare, accelerating demand for IoT sensors.
For instance, China’s Made in China 2025 initiative promotes the use of IoT sensors in smart factories to enhance automation. Similarly, Japan’s advancements in automotive IoT, including Nissan and Toyota’s ADAS systems, rely on high-precision sensors for safety and navigation.
In India, government projects like Digital India and smart infrastructure initiatives are boosting IoT sensor adoption in transportation, energy management, and agriculture. With strong manufacturing capabilities and increasing investments in AI, 5G, and cloud connectivity, Asia Pacific is emerging as the fastest-growing hub for IoT sensors.
Get Customized Report as per Your Business Requirement - Enquiry Now
Some of the major players in the IoT Sensors Market are:
Texas Instruments (TI Temperature Sensors, TI mmWave Radar Sensors)
TE Connectivity Corporation (TE Pressure Sensors, TE Humidity Sensors)
STMicroelectronics International N.V. (ST MEMS Motion Sensors, ST Environmental Sensors)
NXP Semiconductor N.V. (NXP Smart Edge Sensors, NXP UWB Positioning Sensors)
Honeywell International Inc. (Honeywell Industrial Pressure Sensors, Honeywell Gas Sensors)
Siemens AG (Siemens Smart Building Sensors, Siemens Industrial IoT Sensors)
General Electric (GE Condition Monitoring Sensors, GE Industrial Vibration Sensors)
OMRON Corporation (OMRON Proximity Sensors, OMRON Environmental Sensors)
Murata Manufacturing Co., Ltd. (Murata MEMS Gyroscopes, Murata Humidity Sensors)
Analog Devices, Inc. (ADI Vibration Sensors, ADI Optical Sensors)
Robert Bosch GmbH (Bosch Smart Home Sensors, Bosch Motion Sensors)
Infineon Technologies AG (Infineon CO2 Sensors, Infineon Radar Sensors)
Sensirion AG (Sensirion Air Quality Sensors, Sensirion Flow Sensors)
December 2024: STMicroelectronics introduced the ST67W611M1 module, the first product from its collaboration with Qualcomm Technologies. This module integrates Wi-Fi 6, Bluetooth 5.3, and Thread protocols, simplifying the development of advanced consumer and industrial IoT solutions.
September 2024: NXP Semiconductors unveiled the Trimension® SR250, a single-chip solution combining short-range ultra-wideband (UWB) radar and secure ranging. This innovation enables new user experiences in autonomous homes and industrial IoT applications by detecting presence, location, or motion.
| Report Attributes | Details |
|---|---|
| Market Size in 2023 | USD 12.64 Billion |
| Market Size by 2032 | USD 191.04 Billion |
| CAGR | CAGR of 35.3% From 2024 to 2032 |
| Base Year | 2023 |
| Forecast Period | 2024-2032 |
| Historical Data | 2020-2022 |
| Report Scope & Coverage | Market Size, Segments Analysis, Competitive Landscape, Regional Analysis, DROC & SWOT Analysis, Forecast Outlook |
| Key Segments | • By Type (Temperature Sensors, Motion Sensors, Light Sensors, Others) • By End-Use (Consumer Electronics, Wearable Devices, Automotive & Transportation, BFSI, Healthcare, Retail, Building Automation, Oil & Gas, Agriculture, Aerospace & Defense, Others) |
| Regional Analysis/Coverage | North America (US, Canada, Mexico), Europe (Eastern Europe [Poland, Romania, Hungary, Turkey, Rest of Eastern Europe] Western Europe] Germany, France, UK, Italy, Spain, Netherlands, Switzerland, Austria, Rest of Western Europe]), Asia Pacific (China, India, Japan, South Korea, Vietnam, Singapore, Australia, Rest of Asia Pacific), Middle East & Africa (Middle East [UAE, Egypt, Saudi Arabia, Qatar, Rest of Middle East], Africa [Nigeria, South Africa, Rest of Africa], Latin America (Brazil, Argentina, Colombia, Rest of Latin America) |
| Company Profiles | Texas Instruments, TE Connectivity Corporation, STMicroelectronics International N.V., NXP Semiconductor N.V., Honeywell International Inc., Siemens AG, General Electric, OMRON Corporation, Murata Manufacturing Co., Ltd., Analog Devices, Inc., Robert Bosch GmbH, Infineon Technologies AG, Sensirion AG. |
Ans: The IoT Sensors Market is expected to grow at a CAGR of 35.3% during 2024-2032.
Ans: The IoT Sensors Market size was USD 12.64 billion in 2023 and is expected to Reach USD 191.04 billion by 2032.
Ans: The major growth factor of the IoT Sensors Market is the increasing adoption of smart technologies, AI-driven analytics, and 5G connectivity across industries.
Ans: The Motion Sensors segment dominated the IoT Sensors Market.
Ans: North America dominated the IoT Sensors Market in 2023.
1. Introduction
1.1 Market Definition
1.2 Scope (Inclusion and Exclusions)
1.3 Research Assumptions
2. Executive Summary
2.1 Market Overview
2.2 Regional Synopsis
2.3 Competitive Summary
3. Research Methodology
3.1 Top-Down Approach
3.2 Bottom-up Approach
3.3. Data Validation
3.4 Primary Interviews
4. Market Dynamics Impact Analysis
4.1 Market Driving Factors Analysis
4.1.2 Drivers
4.1.2 Restraints
4.1.3 Opportunities
4.1.4 Challenges
4.2 PESTLE Analysis
4.3 Porter’s Five Forces Model
5. Statistical Insights and Trends Reporting
5.1 Adoption Rate & Penetration (2023)
5.2 Investment & R&D Spending
5.3 Production & Supply Chain Metrics (2023)
5.4 Environmental & Regulatory Compliance
6. Competitive Landscape
6.1 List of Major Companies, By Region
6.2 Market Share Analysis, By Region
6.3 Product Benchmarking
6.3.1 Product specifications and features
6.3.2 Pricing
6.4 Strategic Initiatives
6.4.1 Marketing and promotional activities
6.4.2 Distribution and supply chain strategies
6.4.3 Expansion plans and new product launches
6.4.4 Strategic partnerships and collaborations
6.5 Technological Advancements
6.6 Market Positioning and Branding
7. IoT Sensors Market Segmentation, By Type
7.1 Chapter Overview
7.2 Temperature Sensors
7.2.1 Temperature Sensors Market Trends Analysis (2020-2032)
7.2.2 Temperature Sensors Market Size Estimates and Forecasts to 2032 (USD Billion)
7.3 Motion Sensors
7.3.1 Motion Sensors Market Trends Analysis (2020-2032)
7.3.2 Motion Sensors Market Size Estimates and Forecasts to 2032 (USD Billion)
7.4 Light Sensors
7.4.1 Light Sensors Market Trends Analysis (2020-2032)
7.4.2 Light Sensors Market Size Estimates and Forecasts to 2032 (USD Billion)
7.5 Others
7.5.1 Others Market Trends Analysis (2020-2032)
7.5.2 Others Market Size Estimates and Forecasts to 2032 (USD Billion)
8. IoT Sensors Market Segmentation, By End-Use
8.1 Chapter Overview
8.2 Consumer Electronics
8.2.1 Consumer Electronics Market Trends Analysis (2020-2032)
8.2.2 Consumer Electronics Market Size Estimates and Forecasts to 2032 (USD Billion)
8.3 Wearable Devices
8.3.1 Wearable Devices Market Trends Analysis (2020-2032)
8.3.2 Wearable Devices Market Size Estimates and Forecasts to 2032 (USD Billion)
8.4 Automotive & Transportation
8.4.1 Automotive & Transportation Market Trends Analysis (2020-2032)
8.4.2 Automotive & Transportation Market Size Estimates and Forecasts to 2032 (USD Billion)
8.5 BFSI
8.5.1 BFSI Market Trends Analysis (2020-2032)
8.5.2 BFSI Market Size Estimates and Forecasts to 2032 (USD Billion)
8.6 Healthcare
8.6.1 Healthcare Market Trends Analysis (2020-2032)
8.6.2 Healthcare Market Size Estimates and Forecasts to 2032 (USD Billion)
8.7 Retail
8.7.1 Retail Market Trends Analysis (2020-2032)
8.5.2 Retail Market Size Estimates and Forecasts to 2032 (USD Billion)
8.8 Building Automation
8.8.1 Building Automation Market Trends Analysis (2020-2032)
8.8.2 Building Automation Market Size Estimates and Forecasts to 2032 (USD Billion)
8.9 Oil & Gas
8.9.1 Oil & Gas Market Trends Analysis (2020-2032)
8.9.2 Oil & Gas Market Size Estimates and Forecasts to 2032 (USD Billion)
8.10 Agriculture
8.10.1 Agriculture Market Trends Analysis (2020-2032)
8.10.2 Agriculture Market Size Estimates and Forecasts to 2032 (USD Billion)
8.11 Aerospace & Defense
8.11.1 Aerospace & Defense Market Trends Analysis (2020-2032)
8.11.2 Aerospace & Defense Market Size Estimates and Forecasts to 2032 (USD Billion)
8.12 Others
8.12.1 Others Market Trends Analysis (2020-2032)
8.12.2 Others Market Size Estimates and Forecasts to 2032 (USD Billion)
9. Regional Analysis
9.1 Chapter Overview
9.2 North America
9.2.1 Trends Analysis
9.2.2 North America IoT Sensors Market Estimates and Forecasts, by Country (2020-2032) (USD Billion)
9.2.3 North America IoT Sensors Market Estimates and Forecasts, By Type (2020-2032) (USD Billion)
9.2.4 North America IoT Sensors Market Estimates and Forecasts, By End-Use (2020-2032) (USD Billion)
9.2.5 USA
9.2.5.1 USA IoT Sensors Market Estimates and Forecasts, By Type (2020-2032) (USD Billion)
9.2.5.2 USA IoT Sensors Market Estimates and Forecasts, By End-Use (2020-2032) (USD Billion)
9.2.6 Canada
9.2.6.1 Canada IoT Sensors Market Estimates and Forecasts, By Type (2020-2032) (USD Billion)
9.2.6.2 Canada IoT Sensors Market Estimates and Forecasts, By End-Use (2020-2032) (USD Billion)
9.2.7 Mexico
9.2.7.1 Mexico IoT Sensors Market Estimates and Forecasts, By Type (2020-2032) (USD Billion)
9.2.7.2 Mexico IoT Sensors Market Estimates and Forecasts, By End-Use (2020-2032) (USD Billion)
9.3 Europe
9.3.1 Eastern Europe
9.3.1.1 Trends Analysis
9.3.1.2 Eastern Europe IoT Sensors Market Estimates and Forecasts, by Country (2020-2032) (USD Billion)
9.3.1.3 Eastern Europe IoT Sensors Market Estimates and Forecasts, By Type (2020-2032) (USD Billion)
9.3.1.4 Eastern Europe IoT Sensors Market Estimates and Forecasts, By End-Use (2020-2032) (USD Billion)
9.3.1.5 Poland
9.3.1.5.1 Poland IoT Sensors Market Estimates and Forecasts, By Type (2020-2032) (USD Billion)
9.3.1.5.2 Poland IoT Sensors Market Estimates and Forecasts, By End-Use (2020-2032) (USD Billion)
9.3.1.6 Romania
9.3.1.6.1 Romania IoT Sensors Market Estimates and Forecasts, By Type (2020-2032) (USD Billion)
9.3.1.6.2 Romania IoT Sensors Market Estimates and Forecasts, By End-Use (2020-2032) (USD Billion)
9.3.1.7 Hungary
9.3.1.7.1 Hungary IoT Sensors Market Estimates and Forecasts, By Type (2020-2032) (USD Billion)
9.3.1.7.2 Hungary IoT Sensors Market Estimates and Forecasts, By End-Use (2020-2032) (USD Billion)
9.3.1.8 Turkey
9.3.1.8.1 Turkey IoT Sensors Market Estimates and Forecasts, By Type (2020-2032) (USD Billion)
9.3.1.8.2 Turkey IoT Sensors Market Estimates and Forecasts, By End-Use (2020-2032) (USD Billion)
9.3.1.9 Rest of Eastern Europe
9.3.1.9.1 Rest of Eastern Europe IoT Sensors Market Estimates and Forecasts, By Type (2020-2032) (USD Billion)
9.3.1.9.2 Rest of Eastern Europe IoT Sensors Market Estimates and Forecasts, By End-Use (2020-2032) (USD Billion)
9.3.2 Western Europe
9.3.2.1 Trends Analysis
9.3.2.2 Western Europe IoT Sensors Market Estimates and Forecasts, by Country (2020-2032) (USD Billion)
9.3.2.3 Western Europe IoT Sensors Market Estimates and Forecasts, By Type (2020-2032) (USD Billion)
9.3.2.4 Western Europe IoT Sensors Market Estimates and Forecasts, By End-Use (2020-2032) (USD Billion)
9.3.2.5 Germany
9.3.2.5.1 Germany IoT Sensors Market Estimates and Forecasts, By Type (2020-2032) (USD Billion)
9.3.2.5.2 Germany IoT Sensors Market Estimates and Forecasts, By End-Use (2020-2032) (USD Billion)
9.3.2.6 France
9.3.2.6.1 France IoT Sensors Market Estimates and Forecasts, By Type (2020-2032) (USD Billion)
9.3.2.6.2 France IoT Sensors Market Estimates and Forecasts, By End-Use (2020-2032) (USD Billion)
9.3.2.7 UK
9.3.2.7.1 UK IoT Sensors Market Estimates and Forecasts, By Type (2020-2032) (USD Billion)
9.3.2.7.2 UK IoT Sensors Market Estimates and Forecasts, By End-Use (2020-2032) (USD Billion)
9.3.2.8 Italy
9.3.2.8.1 Italy IoT Sensors Market Estimates and Forecasts, By Type (2020-2032) (USD Billion)
9.3.2.8.2 Italy IoT Sensors Market Estimates and Forecasts, By End-Use (2020-2032) (USD Billion)
9.3.2.9 Spain
9.3.2.9.1 Spain IoT Sensors Market Estimates and Forecasts, By Type (2020-2032) (USD Billion)
9.3.2.9.2 Spain IoT Sensors Market Estimates and Forecasts, By End-Use (2020-2032) (USD Billion)
9.3.2.10 Netherlands
9.3.2.10.1 Netherlands IoT Sensors Market Estimates and Forecasts, By Type (2020-2032) (USD Billion)
9.3.2.10.2 Netherlands IoT Sensors Market Estimates and Forecasts, By End-Use (2020-2032) (USD Billion)
9.3.2.11 Switzerland
9.3.2.11.1 Switzerland IoT Sensors Market Estimates and Forecasts, By Type (2020-2032) (USD Billion)
9.3.2.11.2 Switzerland IoT Sensors Market Estimates and Forecasts, By End-Use (2020-2032) (USD Billion)
9.3.2.12 Austria
9.3.2.12.1 Austria IoT Sensors Market Estimates and Forecasts, By Type (2020-2032) (USD Billion)
9.3.2.12.2 Austria IoT Sensors Market Estimates and Forecasts, By End-Use (2020-2032) (USD Billion)
9.3.2.13 Rest of Western Europe
9.3.2.13.1 Rest of Western Europe IoT Sensors Market Estimates and Forecasts, By Type (2020-2032) (USD Billion)
9.3.2.13.2 Rest of Western Europe IoT Sensors Market Estimates and Forecasts, By End-Use (2020-2032) (USD Billion)
9.4 Asia Pacific
9.4.1 Trends Analysis
9.4.2 Asia Pacific IoT Sensors Market Estimates and Forecasts, by Country (2020-2032) (USD Billion)
9.4.3 Asia Pacific IoT Sensors Market Estimates and Forecasts, By Type (2020-2032) (USD Billion)
9.4.4 Asia Pacific IoT Sensors Market Estimates and Forecasts, By End-Use (2020-2032) (USD Billion)
9.4.5 China
9.4.5.1 China IoT Sensors Market Estimates and Forecasts, By Type (2020-2032) (USD Billion)
9.4.5.2 China IoT Sensors Market Estimates and Forecasts, By End-Use (2020-2032) (USD Billion)
9.4.6 India
9.4.5.1 India IoT Sensors Market Estimates and Forecasts, By Type (2020-2032) (USD Billion)
9.4.5.2 India IoT Sensors Market Estimates and Forecasts, By End-Use (2020-2032) (USD Billion)
9.4.5 Japan
9.4.5.1 Japan IoT Sensors Market Estimates and Forecasts, By Type (2020-2032) (USD Billion)
9.4.5.2 Japan IoT Sensors Market Estimates and Forecasts, By End-Use (2020-2032) (USD Billion)
9.4.6 South Korea
9.4.6.1 South Korea IoT Sensors Market Estimates and Forecasts, By Type (2020-2032) (USD Billion)
9.4.6.2 South Korea IoT Sensors Market Estimates and Forecasts, By End-Use (2020-2032) (USD Billion)
9.4.7 Vietnam
9.4.7.1 Vietnam IoT Sensors Market Estimates and Forecasts, By Type (2020-2032) (USD Billion)
9.2.7.2 Vietnam IoT Sensors Market Estimates and Forecasts, By End-Use (2020-2032) (USD Billion)
9.4.8 Singapore
9.4.8.1 Singapore IoT Sensors Market Estimates and Forecasts, By Type (2020-2032) (USD Billion)
9.4.8.2 Singapore IoT Sensors Market Estimates and Forecasts, By End-Use (2020-2032) (USD Billion)
9.4.9 Australia
9.4.9.1 Australia IoT Sensors Market Estimates and Forecasts, By Type (2020-2032) (USD Billion)
9.4.9.2 Australia IoT Sensors Market Estimates and Forecasts, By End-Use (2020-2032) (USD Billion)
9.4.10 Rest of Asia Pacific
9.4.10.1 Rest of Asia Pacific IoT Sensors Market Estimates and Forecasts, By Type (2020-2032) (USD Billion)
9.4.10.2 Rest of Asia Pacific IoT Sensors Market Estimates and Forecasts, By End-Use (2020-2032) (USD Billion)
9.5 Middle East and Africa
9.5.1 Middle East
9.5.1.1 Trends Analysis
9.5.1.2 Middle East IoT Sensors Market Estimates and Forecasts, by Country (2020-2032) (USD Billion)
9.5.1.3 Middle East IoT Sensors Market Estimates and Forecasts, By Type (2020-2032) (USD Billion)
9.5.1.4 Middle East IoT Sensors Market Estimates and Forecasts, By End-Use (2020-2032) (USD Billion)
9.5.1.5 UAE
9.5.1.5.1 UAE IoT Sensors Market Estimates and Forecasts, By Type (2020-2032) (USD Billion)
9.5.1.5.2 UAE IoT Sensors Market Estimates and Forecasts, By End-Use (2020-2032) (USD Billion)
9.5.1.6 Egypt
9.5.1.6.1 Egypt IoT Sensors Market Estimates and Forecasts, By Type (2020-2032) (USD Billion)
9.5.1.6.2 Egypt IoT Sensors Market Estimates and Forecasts, By End-Use (2020-2032) (USD Billion)
9.5.1.7 Saudi Arabia
9.5.1.7.1 Saudi Arabia IoT Sensors Market Estimates and Forecasts, By Type (2020-2032) (USD Billion)
9.5.1.7.2 Saudi Arabia IoT Sensors Market Estimates and Forecasts, By End-Use (2020-2032) (USD Billion)
9.5.1.8 Qatar
9.5.1.8.1 Qatar IoT Sensors Market Estimates and Forecasts, By Type (2020-2032) (USD Billion)
9.5.1.8.2 Qatar IoT Sensors Market Estimates and Forecasts, By End-Use (2020-2032) (USD Billion)
9.5.1.9 Rest of Middle East
9.5.1.9.1 Rest of Middle East IoT Sensors Market Estimates and Forecasts, By Type (2020-2032) (USD Billion)
9.5.1.9.2 Rest of Middle East IoT Sensors Market Estimates and Forecasts, By End-Use (2020-2032) (USD Billion)
9.5.2 Africa
9.5.2.1 Trends Analysis
9.5.2.2 Africa IoT Sensors Market Estimates and Forecasts, by Country (2020-2032) (USD Billion)
9.5.2.3 Africa IoT Sensors Market Estimates and Forecasts, By Type (2020-2032) (USD Billion)
9.5.2.4 Africa IoT Sensors Market Estimates and Forecasts, By End-Use (2020-2032) (USD Billion)
9.5.2.5 South Africa
9.5.2.5.1 South Africa IoT Sensors Market Estimates and Forecasts, By Type (2020-2032) (USD Billion)
9.5.2.5.2 South Africa IoT Sensors Market Estimates and Forecasts, By End-Use (2020-2032) (USD Billion)
9.5.2.6 Nigeria
9.5.2.6.1 Nigeria IoT Sensors Market Estimates and Forecasts, By Type (2020-2032) (USD Billion)
9.5.2.6.2 Nigeria IoT Sensors Market Estimates and Forecasts, By End-Use (2020-2032) (USD Billion)
9.5.2.7 Rest of Africa
9.5.2.7.1 Rest of Africa IoT Sensors Market Estimates and Forecasts, By Type (2020-2032) (USD Billion)
9.5.2.7.2 Rest of Africa IoT Sensors Market Estimates and Forecasts, By End-Use (2020-2032) (USD Billion)
9.6 Latin America
9.6.1 Trends Analysis
9.6.2 Latin America IoT Sensors Market Estimates and Forecasts, by Country (2020-2032) (USD Billion)
9.6.3 Latin America IoT Sensors Market Estimates and Forecasts, By Type (2020-2032) (USD Billion)
9.6.4 Latin America IoT Sensors Market Estimates and Forecasts, By End-Use (2020-2032) (USD Billion)
9.6.5 Brazil
9.6.5.1 Brazil IoT Sensors Market Estimates and Forecasts, By Type (2020-2032) (USD Billion)
9.6.5.2 Brazil IoT Sensors Market Estimates and Forecasts, By End-Use (2020-2032) (USD Billion)
9.6.6 Argentina
9.6.6.1 Argentina IoT Sensors Market Estimates and Forecasts, By Type (2020-2032) (USD Billion)
9.6.6.2 Argentina IoT Sensors Market Estimates and Forecasts, By End-Use (2020-2032) (USD Billion)
9.6.7 Colombia
9.6.7.1 Colombia IoT Sensors Market Estimates and Forecasts, By Type (2020-2032) (USD Billion)
9.6.7.2 Colombia IoT Sensors Market Estimates and Forecasts, By End-Use (2020-2032) (USD Billion)
9.6.8 Rest of Latin America
9.6.8.1 Rest of Latin America IoT Sensors Market Estimates and Forecasts, By Type (2020-2032) (USD Billion)
9.6.8.2 Rest of Latin America IoT Sensors Market Estimates and Forecasts, By End-Use (2020-2032) (USD Billion)
10. Company Profiles
10.1 Texas Instruments
10.1.1 Company Overview
10.1.2 Financial
10.1.3 Products/ Services Offered
110.1.4 SWOT Analysis
10.2 TE Connectivity Corporation
10.2.1 Company Overview
10.2.2 Financial
10.2.3 Products/ Services Offered
10.2.4 SWOT Analysis
10.3 STMicroelectronics International N.V.
10.3.1 Company Overview
10.3.2 Financial
10.3.3 Products/ Services Offered
10.3.4 SWOT Analysis
10.4 NXP Semiconductor N.V.
10.4.1 Company Overview
10.4.2 Financial
10.4.3 Products/ Services Offered
10.4.4 SWOT Analysis
10.5 General Data Company, Inc.
10.5.1 Company Overview
10.5.2 Financial
10.5.3 Products/ Services Offered
10.5.4 SWOT Analysis
10.6 Honeywell International, Inc.
10.6.1 Company Overview
10.6.2 Financial
10.6.3 Products/ Services Offered
10.6.4 SWOT Analysis
10.7 Siemens AG
10.7.1 Company Overview
10.7.2 Financial
10.7.3 Products/ Services Offered
10.7.4 SWOT Analysis
10.8 General Electric
10.8.1 Company Overview
10.8.2 Financial
10.8.3 Products/ Services Offered
10.8.4 SWOT Analysis
10.9 OMRON Corporation
10.9.1 Company Overview
10.9.2 Financial
10.9.3 Products/ Services Offered
10.9.4 SWOT Analysis
10.10 Murata Manufacturing Co., Ltd.
10.9.1 Company Overview
10.9.2 Financial
10.9.3 Products/ Services Offered
10.9.4 SWOT Analysis
11. Use Cases and Best Practices
12. Conclusion
An accurate research report requires proper strategizing as well as implementation. There are multiple factors involved in the completion of good and accurate research report and selecting the best methodology to compete the research is the toughest part. Since the research reports we provide play a crucial role in any company’s decision-making process, therefore we at SNS Insider always believe that we should choose the best method which gives us results closer to reality. This allows us to reach at a stage wherein we can provide our clients best and accurate investment to output ratio.
Each report that we prepare takes a timeframe of 350-400 business hours for production. Starting from the selection of titles through a couple of in-depth brain storming session to the final QC process before uploading our titles on our website we dedicate around 350 working hours. The titles are selected based on their current market cap and the foreseen CAGR and growth.
The 5 steps process:
Step 1: Secondary Research:
Secondary Research or Desk Research is as the name suggests is a research process wherein, we collect data through the readily available information. In this process we use various paid and unpaid databases which our team has access to and gather data through the same. This includes examining of listed companies’ annual reports, Journals, SEC filling etc. Apart from this our team has access to various associations across the globe across different industries. Lastly, we have exchange relationships with various university as well as individual libraries.

Step 2: Primary Research
When we talk about primary research, it is a type of study in which the researchers collect relevant data samples directly, rather than relying on previously collected data. This type of research is focused on gaining content specific facts that can be sued to solve specific problems. Since the collected data is fresh and first hand therefore it makes the study more accurate and genuine.
We at SNS Insider have divided Primary Research into 2 parts.
Part 1 wherein we interview the KOLs of major players as well as the upcoming ones across various geographic regions. This allows us to have their view over the market scenario and acts as an important tool to come closer to the accurate market numbers. As many as 45 paid and unpaid primary interviews are taken from both the demand and supply side of the industry to make sure we land at an accurate judgement and analysis of the market.
This step involves the triangulation of data wherein our team analyses the interview transcripts, online survey responses and observation of on filed participants. The below mentioned chart should give a better understanding of the part 1 of the primary interview.

Part 2: In this part of primary research the data collected via secondary research and the part 1 of the primary research is validated with the interviews from individual consultants and subject matter experts.
Consultants are those set of people who have at least 12 years of experience and expertise within the industry whereas Subject Matter Experts are those with at least 15 years of experience behind their back within the same space. The data with the help of two main processes i.e., FGDs (Focused Group Discussions) and IDs (Individual Discussions). This gives us a 3rd party nonbiased primary view of the market scenario making it a more dependable one while collation of the data pointers.
Step 3: Data Bank Validation
Once all the information is collected via primary and secondary sources, we run that information for data validation. At our intelligence centre our research heads track a lot of information related to the market which includes the quarterly reports, the daily stock prices, and other relevant information. Our data bank server gets updated every fortnight and that is how the information which we collected using our primary and secondary information is revalidated in real time.

Step 4: QA/QC Process
After all the data collection and validation our team does a final level of quality check and quality assurance to get rid of any unwanted or undesired mistakes. This might include but not limited to getting rid of the any typos, duplication of numbers or missing of any important information. The people involved in this process include technical content writers, research heads and graphics people. Once this process is completed the title gets uploader on our platform for our clients to read it.
Step 5: Final QC/QA Process:
This is the last process and comes when the client has ordered the study. In this process a final QA/QC is done before the study is emailed to the client. Since we believe in giving our clients a good experience of our research studies, therefore, to make sure that we do not lack at our end in any way humanly possible we do a final round of quality check and then dispatch the study to the client.
Key Segments:
By Type
Temperature Sensors
Motion Sensors
Light Sensors
Others
By End-Use
Consumer Electronics
Wearable Devices
Automotive & Transportation
BFSI
Healthcare
Retail
Building Automation
Oil & Gas
Agriculture
Aerospace & Defense
Others
Request for Segment Customization as per your Business Requirement: Segment Customization Request
Regional Coverage:
North America
US
Canada
Mexico
Europe
Eastern Europe
Poland
Romania
Hungary
Turkey
Rest of Eastern Europe
Western Europe
Germany
France
UK
Italy
Spain
Netherlands
Switzerland
Austria
Rest of Western Europe
Asia Pacific
China
India
Japan
South Korea
Vietnam
Singapore
Australia
Rest of Asia Pacific
Middle East & Africa
Middle East
UAE
Egypt
Saudi Arabia
Qatar
Rest of Middle East
Africa
Nigeria
South Africa
Rest of Africa
Latin America
Brazil
Argentina
Colombia
Rest of Latin America
Request for Country Level Research Report: Country Level Customization Request
Available Customization
With the given market data, SNS Insider offers customization as per the company’s specific needs. The following customization options are available for the report:
Detailed Volume Analysis
Criss-Cross segment analysis (e.g. Product X Application)
Competitive Product Benchmarking
Geographic Analysis
Additional countries in any of the regions
Customized Data Representation
Detailed analysis and profiling of additional market players
The LED Chip Market size was valued at USD 28.81 billion in 2023. It is expected to grow to USD 78.01 billion by 2032 and grow at a CAGR of 11.7% over the forecast period of 2024-2032.
The Fiber Optics Collimating Lens Market Size was valued at USD 734.2 million in 2023 and expected to grow at a CAGR of 12.45% During 2024-2032.
The Industrial Barrier Systems Market Size was valued at USD 2.35 billion in 2023 and is projected to grow at 6.80% CAGR to reach USD 4.25 billion by 2032.
The Fiber Optics Gyroscope Market Size was valued at USD 1.05 Billion in 2023 and is expected to grow at a CAGR of 4.73% to reach USD 1.59 Billion by 2032.
The Laser Technology Market Size was valued at USD 18.76 Billion in 2023 and is expected to reach USD 37.26 Billion by 2032 and grow at a CAGR of 7.96% over the forecast period 2024-2032.
The Radar Sensors for Smart City Applications Market was valued at USD 248.7 Million in 2023 and is expected to reach USD 701.9 Million by 2032, growing at a CAGR of 12.24% from 2024-2032.

Hi! Click one of our member below to chat on Phone
© 2025 All Rights Reserved by SNS Insider Pvt Ltd


