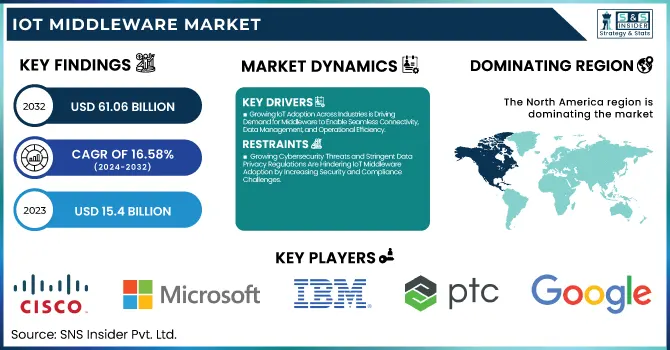
The IoT Middleware Market was valued at USD 15.4 billion in 2023 and is expected to reach USD 61.06 billion by 2032, growing at a CAGR of 16.58% from 2024-2032.
To Get more information on IoT Middleware Market - Request Free Sample Report
This report includes an analysis of customer satisfaction & retention rates, investment patterns, cost structure, number of connected devices, and security breaches. The market is witnessing strong growth owing to growing IoT adoption across various sectors, which results in more connected devices. Companies are concentrating on cost-effective solutions while having solid security infrastructures to protect against cyber threats. Investment in next-generation middleware technology is increasing due to the necessity of smooth device integration and enhanced data management. Customer satisfaction and retention at high levels are dictating competitive plans, leading to greater long-term market stability.
Drivers
Growing IoT Adoption Across Industries is Driving Demand for Middleware to Enable Seamless Connectivity, Data Management, and Operational Efficiency.
Manufacturing, healthcare, and smart cities are among the industries that are embracing IoT solutions to improve efficiency, automation, and data-driven decision-making. With more devices connected, organizations need middleware solutions to ensure seamless device interoperability, data management, and security. Middleware is the backbone that allows real-time communication between IoT ecosystems while ensuring scalability and integration with cloud and edge computing platforms. Also, increasing demand for predictive maintenance, remote monitoring, and automation also boosts middleware adoption. As IoT growth fuels networks of sensors and intelligent devices, middleware solutions become vital in managing connectivity, data flow, and improving operational efficiency across various industry verticals.
Restraints
Growing Cybersecurity Threats and Stringent Data Privacy Regulations Are Hindering IoT Middleware Adoption by Increasing Security and Compliance Challenges.
With more devices connected, cybersecurity threats and data breaches pose significant challenges for companies deploying IoT solutions. IoT middleware is vital in controlling device-to-device communication, but weak points in security protocols can make sensitive data vulnerable to cyberattacks. Moreover, strict data privacy laws necessitate organizations to install strong security features, raising compliance complexities. The necessity for end-to-end encryption, authentication, and access control features contributes to implementation difficulties. While hackers target IoT networks, organizations have to spend a lot on security frameworks and threat detection solutions, increasing the difficulty of adoption. Security concerns need to be addressed to create trust and enable safe and efficient IoT ecosystem functioning.
Opportunities
Rising Smart City Investments Are Boosting Demand for IoT Middleware to Enable Seamless Integration of Connected Infrastructure and Real-Time Data Management.
Governments and city planners are investing significantly in smart city programs to improve public services, traffic management, energy efficiency, and security. These initiatives are based on IoT-connected infrastructure, such as smart grids, smart transportation systems, and networked surveillance, placing a high need for middleware solutions to orchestrate data exchanges and device communication. Middleware facilitates real-time exchange of messages between sensors, cloud platforms, and city-level networks, facilitating effective automation and decision-making. With cities embracing 5G, edge computing, and AI-powered analytics, IoT middleware is the key to scalability and unification of sophisticated systems. The relentless drive toward sustainable and technologically advanced urban growth further fast-tracks the demand for middleware, making it a central piece of future-proof smart cities.
Challenges
Increasing IoT Device Volumes Are Creating Scalability Challenges, Driving the Need for Advanced Middleware to Ensure Efficiency and Low Latency.
As the number of IoT devices connecting to the web is growing constantly, efficient flow of data, low latency, and smooth management of devices pose an ever-greater challenge. Legacy middleware products tend to scale poorly, resulting in performance bottlenecks at scale. Sectors deploying massive IoT networks, including smart cities, manufacturing, and healthcare, need middleware that supports high volumes of data, real-time processing, and device interoperability without sacrificing speed or security. Moreover, the convergence of cloud, edge computing, and AI-based analytics necessitates middleware with sophisticated scalability features. Without strong solutions, companies can expect network congestion, latency, and inefficiency in operations, which creates the need to build next-generation middleware capable of backing the escalating IoT environment.
By Enterprise Size
Large enterprises led the IoT Middleware Market with the largest revenue share of around 63% in 2023 because of their large-scale IoT deployments, high IT expenditure, and superior infrastructure capabilities. Such companies need powerful middleware solutions to support extensive IoT ecosystems spread across different locations, providing uninterrupted connectivity, real-time data processing, and security compliance. Besides, big companies are early adopters of cutting-edge technologies such as AI, edge computing, and cloud-based IoT platforms, thereby fueling middleware demand. Their capacity to invest in tailored solutions and high-end security frameworks confirms their market dominance.
Small and Medium Enterprises (SMEs) will expand at the fastest CAGR of approximately 17.97% during 2024-2032 owing to their growing adoption of IoT for automation, efficiency, and cost reduction. Increased use of low-cost and cloud-based middleware offerings allows SMEs to implement IoT with minimal investments in infrastructure. Furthermore, government programs and digitalization of industries stimulate SMEs to adopt IoT for smart manufacturing, logistics, and remote monitoring. With increased competition, SMEs are integrating scalable IoT offerings, edge computing, and AI-powered analytics at an increasing rate, leading to strong growth in the middleware market.
By Vertical
The manufacturing industry led the IoT Middleware Market with the largest revenue share of around 31% in 2023 as a result of the extensive use of Industrial IoT (IIoT) for automation, predictive maintenance, and real-time monitoring. Manufacturers depend on middleware solutions to combine smart sensors, robotics, and AI-based analytics to achieve better operational efficiency and cost reduction. Moreover, middleware allows for easy communication between machines, cloud environments, and enterprise systems, ensuring maximum production efficiency. The increasing requirement for smart factories and Industry 4.0 technologies further amplifies its hegemony.
The healthcare sector will expand at the fastest CAGR of approximately 19.84% during the period from 2024 to 2032 owing to increasing IoT adoption in remote patient monitoring, telemedicine, and intelligent medical devices. Middleware solutions are essential for secure data transfer, interoperability, and real-time health analytics to ensure effective patient care. Growing interest in AI-based diagnostics, wearable health monitoring, and hospital automation fuels IoT middleware demand. Stringent data security laws and the requirement for transparent healthcare system integration also spur market growth in this segment.
By Platform
The device management segment led the IoT Middleware Market with the largest revenue share of around 38% in 2023 because of the increasing requirement for hassle-free provisioning, monitoring, and maintenance of connected devices. With increasing IoT adoption across sectors, organizations need middleware to provide device security, firmware updates, and performance optimization. Device management solutions assist companies in minimizing downtime, improving operational efficiency, and enhancing scalability in large-scale IoT networks. The increasing complexity of multi-device environments and remote monitoring solutions further fortifies its market leadership.
The connectivity management segment is expected to grow at the fastest CAGR of approximately 18.90% during the forecast period 2024-2032 with rising demand for optimized network orchestration, low-latency communications, and transparent IoT connectivity. As 5G, LPWAN, and edge computing grow at a fast pace, organizations require middleware solutions to handle network traffic, optimize bandwidth consumption, and provide secure data transmission. Smart cities, industrial automation, and remote IoT applications increase the growth of connectivity management platforms, accelerating the adoption at a fast rate.
Regional Analysis
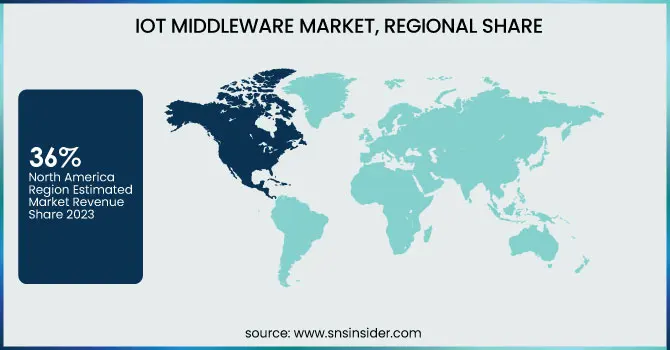
North America dominated the IoT Middleware Market with the highest revenue share of about 36% in 2023 due to its advanced technology infrastructure, high IoT adoption across industries, and strong presence of key market players. The region benefits from widespread deployment of smart manufacturing, healthcare IoT, and industrial automation solutions, driving middleware demand. Additionally, early adoption of 5G, AI-driven analytics, and cloud computing enhances IoT ecosystem efficiency. Stringent cybersecurity regulations and enterprise investments in IoT security further contribute to the region’s market leadership.
Asia Pacific is expected to grow at the fastest CAGR of about 18.95% from 2024 to 2032 due to rapid industrialization, increasing smart city initiatives, and expanding IoT deployments across manufacturing and healthcare. Government support for digital transformation, growing 5G networks, and rising adoption of cloud-based IoT solutions drive regional growth. Additionally, the expansion of automotive IoT, consumer electronics, and smart infrastructure projects accelerates demand for middleware solutions. The region’s large-scale investments in automation and connectivity advancements further fuel its rapid market expansion.
Get Customized Report as per Your Business Requirement - Enquiry Now
Microsoft (Azure IoT Hub, Azure Digital Twins)
IBM (IBM Watson IoT, IBM Maximo)
PTC (ThingWorx, Vuforia)
Cisco (IoT Control Center, Cisco Kinetic)
AWS (AWS IoT Core, AWS IoT Greengrass)
SAP (SAP Leonardo IoT, SAP Cloud Platform IoT)
Google (Google Cloud IoT, Google Cloud IoT Core)
Hitachi (Lumada, Hitachi Vantara)
Oracle (Oracle IoT Cloud, Oracle Integration Cloud)
HPE (HPE Edgeline, HPE GreenLake)
Bosch (Bosch IoT Suite, Bosch IoT Cloud)
Siemens (MindSphere, Siemens Industrial IoT)
GE (Predix, GE Digital)
Schneider Electric (EcoStruxure, Schneider Electric IoT)
Software AG (Cumulocity IoT, webMethods)
Aeris Communication (Aeris IoT Platform, Aeris Mobility Suite)
Salesforce (Salesforce IoT Cloud, Salesforce Einstein)
Atos (Atos Codex IoT, Atos Digital Transformation)
ClearBlade (ClearBlade IoT Platform, ClearBlade Edge)
Davra Networks (Davra IoT Platform, Davra Edge)
Axiros (Axiros AXCESS, Axiros AXPERIENCE)
Eurotech (Eurotech Everyware IoT, Eurotech IoT Edge)
Litmus Automation (Litmus Edge, Litmus Edge Connect)
Ayla Networks (Ayla IoT Platform, Ayla IoT Cloud)
SumatoSoft (SumatoSoft IoT Solutions, SumatoSoft Cloud Integration)
QiO Technologies (QiO IoT, QiO AI for Industry)
Particle Industries (Particle IoT Platform, Particle Device Cloud)
Exosite (Exosite IoT Platform, Exosite Device Management)
2024 Microsoft announced the general availability of Windows Server IoT 2025 with enhanced security, hybrid cloud capabilities, and AI-driven performance improvements. Key features include strengthened Active Directory security, SMB over QUIC for secure file sharing, and GPU partitioning support for AI workloads.
2025 Qualcomm and IBM expanded their collaboration to enhance enterprise-grade generative AI across edge and cloud devices. IBM’s watsonx.governance and Granite models will integrate with Qualcomm’s AI Inference Suite, enabling AI solutions with improved reliability, privacy, and energy efficiency. Qualcomm's AI accelerators also received Red Hat OpenShift certification for hybrid cloud deployments.
| Report Attributes | Details |
|---|---|
| Market Size in 2023 | USD 15.4 Billion |
| Market Size by 2032 | USD 61.06 Billion |
| CAGR | CAGR of 16.58% From 2024 to 2032 |
| Base Year | 2023 |
| Forecast Period | 2024-2032 |
| Historical Data | 2020-2022 |
| Report Scope & Coverage | Market Size, Segments Analysis, Competitive Landscape, Regional Analysis, DROC & SWOT Analysis, Forecast Outlook |
| Key Segments | • By Platform (Device Management, Application Management, Connectivity Management, Security Management, Data Management) • By Enterprise Size (Large Enterprises, Small And Medium Enterprises) • By Vertical (Government & Defense, Manufacturing, BFSI, Transportation & Logistics, Energy & Utilities, Healthcare, Retail, Other Vertical) |
| Regional Analysis/Coverage | North America (US, Canada, Mexico), Europe (Eastern Europe [Poland, Romania, Hungary, Turkey, Rest of Eastern Europe] Western Europe] Germany, France, UK, Italy, Spain, Netherlands, Switzerland, Austria, Rest of Western Europe]), Asia Pacific (China, India, Japan, South Korea, Vietnam, Singapore, Australia, Rest of Asia Pacific), Middle East & Africa (Middle East [UAE, Egypt, Saudi Arabia, Qatar, Rest of Middle East], Africa [Nigeria, South Africa, Rest of Africa], Latin America (Brazil, Argentina, Colombia, Rest of Latin America) |
| Company Profiles | Microsoft, IBM, PTC, Cisco, AWS, SAP, Google, Hitachi, Oracle, HPE, Bosch, Siemens, GE, Schneider Electric, Software AG, Aeris Communication, Salesforce, Atos, ClearBlade, Davra Networks, Axiros, Eurotech, Litmus Automation, Ayla Networks, SumatoSoft, QiO Technologies, Particle Industries, Exosite |
ANS: IoT Middleware Market was valued at USD 15.4 billion in 2023 and is expected to reach USD 61.06 billion by 2032, growing at a CAGR of 16.58% from 2024-2032.
ANS: Large enterprises led with a 63% revenue share.
ANS: Manufacturing dominated with a 31% revenue share.
ANS: Device Management led with a 38% revenue share.
ANS: North America led with a 36% revenue share.
Table of Contents:
1. Introduction
1.1 Market Definition
1.2 Scope (Inclusion and Exclusions)
1.3 Research Assumptions
2. Executive Summary
2.1 Market Overview
2.2 Regional Synopsis
2.3 Competitive Summary
3. Research Methodology
3.1 Top-Down Approach
3.2 Bottom-up Approach
3.3. Data Validation
3.4 Primary Interviews
4. Market Dynamics Impact Analysis
4.1 Market Driving Factors Analysis
4.1.1 Drivers
4.1.2 Restraints
4.1.3 Opportunities
4.1.4 Challenges
4.2 PESTLE Analysis
4.3 Porter’s Five Forces Model
5. Statistical Insights and Trends Reporting
5.1 Customer Satisfaction & Retention Rates
5.2 Investment Trends
5.3 Cost Analysis
5.4 Number of Connected Devices
5.5 Security Incidents
6. Competitive Landscape
6.1 List of Major Companies, By Region
6.2 Market Share Analysis, By Region
6.3 Product Benchmarking
6.3.1 Product specifications and features
6.3.2 Pricing
6.4 Strategic Initiatives
6.4.1 Marketing and promotional activities
6.4.2 Distribution and supply chain strategies
6.4.3 Expansion plans and new product launches
6.4.4 Strategic partnerships and collaborations
6.5 Technological Advancements
6.6 Market Positioning and Branding
7. IoT Middleware Market Segmentation, By Platform
7.1 Chapter Overview
7.2 Device Management
7.2.1 Device Management Market Trends Analysis (2020-2032)
7.2.2 Device Management Market Size Estimates and Forecasts to 2032 (USD Billion)
7.3 Application Management
7.3.1 Application Management Market Trends Analysis (2020-2032)
7.3.2 Application Management Market Size Estimates and Forecasts to 2032 (USD Billion)
7.4 Connectivity Management
7.4.1 Connectivity Management Market Trends Analysis (2020-2032)
7.4.2 Connectivity Management Market Size Estimates and Forecasts to 2032 (USD Billion)
7.5 Security Management
7.5.1 Security Management Market Trends Analysis (2020-2032)
7.5.2 Security Management Market Size Estimates and Forecasts to 2032 (USD Billion)
7.6 Data Management
7.6.1 Data Management Market Trends Analysis (2020-2032)
7.6.2 Data Management Market Size Estimates and Forecasts to 2032 (USD Billion)
8. IoT Middleware Market Segmentation, By Enterprise Size
8.1 Chapter Overview
8.2 Large Enterprises
8.2.1 Large Enterprises Market Trends Analysis (2020-2032)
8.2.2 Large Enterprises Market Size Estimates and Forecasts to 2032 (USD Billion)
8.3 Small And Medium Enterprises
8.3.1 Small And Medium Enterprises Market Trends Analysis (2020-2032)
8.3.2 Small And Medium Enterprises Market Size Estimates and Forecasts to 2032 (USD Billion)
9. IoT Middleware Market Segmentation, By Vertical
9.1 Chapter Overview
9.2 Government & Defense
9.2.1 Government & Defense Market Trends Analysis (2020-2032)
9.2.2 Government & Defense Market Size Estimates and Forecasts to 2032 (USD Billion)
9.3 Manufacturing
9.3.1 Manufacturing Market Trends Analysis (2020-2032)
9.3.2 Manufacturing Market Size Estimates and Forecasts to 2032 (USD Billion)
9.4 BFSI
9.4.1 BFSI Market Trends Analysis (2020-2032)
9.4.2 BFSI Market Size Estimates and Forecasts to 2032 (USD Billion)
9.5 Transportation & Logistics
9.5.1 Transportation & Logistics Market Trends Analysis (2020-2032)
9.5.2 Transportation & Logistics Market Size Estimates and Forecasts to 2032 (USD Billion)
9.6 Energy & Utilities
9.6.1 Energy & Utilities Market Trends Analysis (2020-2032)
9.6.2 Energy & Utilities Market Size Estimates and Forecasts to 2032 (USD Billion)
9.7 Healthcare
9.7.1 Healthcare Market Trends Analysis (2020-2032)
9.7.2 Healthcare Market Size Estimates and Forecasts to 2032 (USD Billion)
9.8 Retail
9.8.1 Retail Market Trends Analysis (2020-2032)
9.8.2 Retail Market Size Estimates and Forecasts to 2032 (USD Billion)
9.9 Other Vertical
9.9.1 Other Vertical Market Trends Analysis (2020-2032)
9.9.2 Other Vertical Market Size Estimates and Forecasts to 2032 (USD Billion)
10. Regional Analysis
10.1 Chapter Overview
10.2 North America
10.2.1 Trends Analysis
10.2.2 North America IoT Middleware Market Estimates and Forecasts, by Country (2020-2032) (USD Billion)
10.2.3 North America IoT Middleware Market Estimates and Forecasts, By Platform (2020-2032) (USD Billion)
10.2.4 North America IoT Middleware Market Estimates and Forecasts, By Enterprise Size (2020-2032) (USD Billion)
10.2.5 North America IoT Middleware Market Estimates and Forecasts, By Vertical (2020-2032) (USD Billion)
10.2.6 USA
10.2.6.1 USA IoT Middleware Market Estimates and Forecasts, By Platform (2020-2032) (USD Billion)
10.2.6.2 USA IoT Middleware Market Estimates and Forecasts, By Enterprise Size (2020-2032) (USD Billion)
10.2.6.3 USA IoT Middleware Market Estimates and Forecasts, By Vertical (2020-2032) (USD Billion)
10.2.7 Canada
10.2.7.1 Canada IoT Middleware Market Estimates and Forecasts, By Platform (2020-2032) (USD Billion)
10.2.7.2 Canada IoT Middleware Market Estimates and Forecasts, By Enterprise Size (2020-2032) (USD Billion)
10.2.7.3 Canada IoT Middleware Market Estimates and Forecasts, By Vertical (2020-2032) (USD Billion)
10.2.8 Mexico
10.2.8.1 Mexico IoT Middleware Market Estimates and Forecasts, By Platform (2020-2032) (USD Billion)
10.2.8.2 Mexico IoT Middleware Market Estimates and Forecasts, By Enterprise Size (2020-2032) (USD Billion)
10.2.8.3 Mexico IoT Middleware Market Estimates and Forecasts, By Vertical (2020-2032) (USD Billion)
10.3 Europe
10.3.1 Eastern Europe
10.3.1.1 Trends Analysis
10.3.1.2 Eastern Europe IoT Middleware Market Estimates and Forecasts, by Country (2020-2032) (USD Billion)
10.3.1.3 Eastern Europe IoT Middleware Market Estimates and Forecasts, By Platform (2020-2032) (USD Billion)
10.3.1.4 Eastern Europe IoT Middleware Market Estimates and Forecasts, By Enterprise Size (2020-2032) (USD Billion)
10.3.1.5 Eastern Europe IoT Middleware Market Estimates and Forecasts, By Vertical (2020-2032) (USD Billion)
10.3.1.6 Poland
10.3.1.6.1 Poland IoT Middleware Market Estimates and Forecasts, By Platform (2020-2032) (USD Billion)
10.3.1.6.2 Poland IoT Middleware Market Estimates and Forecasts, By Enterprise Size (2020-2032) (USD Billion)
10.3.1.6.3 Poland IoT Middleware Market Estimates and Forecasts, By Vertical (2020-2032) (USD Billion)
10.3.1.7 Romania
10.3.1.7.1 Romania IoT Middleware Market Estimates and Forecasts, By Platform (2020-2032) (USD Billion)
10.3.1.7.2 Romania IoT Middleware Market Estimates and Forecasts, By Enterprise Size (2020-2032) (USD Billion)
10.3.1.7.3 Romania IoT Middleware Market Estimates and Forecasts, By Vertical (2020-2032) (USD Billion)
10.3.1.8 Hungary
10.3.1.8.1 Hungary IoT Middleware Market Estimates and Forecasts, By Platform (2020-2032) (USD Billion)
10.3.1.8.2 Hungary IoT Middleware Market Estimates and Forecasts, By Enterprise Size (2020-2032) (USD Billion)
10.3.1.8.3 Hungary IoT Middleware Market Estimates and Forecasts, By Vertical (2020-2032) (USD Billion)
10.3.1.9 Turkey
10.3.1.9.1 Turkey IoT Middleware Market Estimates and Forecasts, By Platform (2020-2032) (USD Billion)
10.3.1.9.2 Turkey IoT Middleware Market Estimates and Forecasts, By Enterprise Size (2020-2032) (USD Billion)
10.3.1.9.3 Turkey IoT Middleware Market Estimates and Forecasts, By Vertical (2020-2032) (USD Billion)
10.3.1.10 Rest of Eastern Europe
10.3.1.10.1 Rest of Eastern Europe IoT Middleware Market Estimates and Forecasts, By Platform (2020-2032) (USD Billion)
10.3.1.10.2 Rest of Eastern Europe IoT Middleware Market Estimates and Forecasts, By Enterprise Size (2020-2032) (USD Billion)
10.3.1.10.3 Rest of Eastern Europe IoT Middleware Market Estimates and Forecasts, By Vertical (2020-2032) (USD Billion)
10.3.2 Western Europe
10.3.2.1 Trends Analysis
10.3.2.2 Western Europe IoT Middleware Market Estimates and Forecasts, by Country (2020-2032) (USD Billion)
10.3.2.3 Western Europe IoT Middleware Market Estimates and Forecasts, By Platform (2020-2032) (USD Billion)
10.3.2.4 Western Europe IoT Middleware Market Estimates and Forecasts, By Enterprise Size (2020-2032) (USD Billion)
10.3.2.5 Western Europe IoT Middleware Market Estimates and Forecasts, By Vertical (2020-2032) (USD Billion)
10.3.2.6 Germany
10.3.2.6.1 Germany IoT Middleware Market Estimates and Forecasts, By Platform (2020-2032) (USD Billion)
10.3.2.6.2 Germany IoT Middleware Market Estimates and Forecasts, By Enterprise Size (2020-2032) (USD Billion)
10.3.2.6.3 Germany IoT Middleware Market Estimates and Forecasts, By Vertical (2020-2032) (USD Billion)
10.3.2.7 France
10.3.2.7.1 France IoT Middleware Market Estimates and Forecasts, By Platform (2020-2032) (USD Billion)
10.3.2.7.2 France IoT Middleware Market Estimates and Forecasts, By Enterprise Size (2020-2032) (USD Billion)
10.3.2.7.3 France IoT Middleware Market Estimates and Forecasts, By Vertical (2020-2032) (USD Billion)
10.3.2.8 UK
10.3.2.8.1 UK IoT Middleware Market Estimates and Forecasts, By Platform (2020-2032) (USD Billion)
10.3.2.8.2 UK IoT Middleware Market Estimates and Forecasts, By Enterprise Size (2020-2032) (USD Billion)
10.3.2.8.3 UK IoT Middleware Market Estimates and Forecasts, By Vertical (2020-2032) (USD Billion)
10.3.2.9 Italy
10.3.2.9.1 Italy IoT Middleware Market Estimates and Forecasts, By Platform (2020-2032) (USD Billion)
10.3.2.9.2 Italy IoT Middleware Market Estimates and Forecasts, By Enterprise Size (2020-2032) (USD Billion)
10.3.2.9.3 Italy IoT Middleware Market Estimates and Forecasts, By Vertical (2020-2032) (USD Billion)
10.3.2.10 Spain
10.3.2.10.1 Spain IoT Middleware Market Estimates and Forecasts, By Platform (2020-2032) (USD Billion)
10.3.2.10.2 Spain IoT Middleware Market Estimates and Forecasts, By Enterprise Size (2020-2032) (USD Billion)
10.3.2.10.3 Spain IoT Middleware Market Estimates and Forecasts, By Vertical (2020-2032) (USD Billion)
10.3.2.11 Netherlands
10.3.2.11.1 Netherlands IoT Middleware Market Estimates and Forecasts, By Platform (2020-2032) (USD Billion)
10.3.2.11.2 Netherlands IoT Middleware Market Estimates and Forecasts, By Enterprise Size (2020-2032) (USD Billion)
10.3.2.11.3 Netherlands IoT Middleware Market Estimates and Forecasts, By Vertical (2020-2032) (USD Billion)
10.3.2.12 Switzerland
10.3.2.12.1 Switzerland IoT Middleware Market Estimates and Forecasts, By Platform (2020-2032) (USD Billion)
10.3.2.12.2 Switzerland IoT Middleware Market Estimates and Forecasts, By Enterprise Size (2020-2032) (USD Billion)
10.3.2.12.3 Switzerland IoT Middleware Market Estimates and Forecasts, By Vertical (2020-2032) (USD Billion)
10.3.2.13 Austria
10.3.2.13.1 Austria IoT Middleware Market Estimates and Forecasts, By Platform (2020-2032) (USD Billion)
10.3.2.13.2 Austria IoT Middleware Market Estimates and Forecasts, By Enterprise Size (2020-2032) (USD Billion)
10.3.2.13.3 Austria IoT Middleware Market Estimates and Forecasts, By Vertical (2020-2032) (USD Billion)
10.3.2.14 Rest of Western Europe
10.3.2.14.1 Rest of Western Europe IoT Middleware Market Estimates and Forecasts, By Platform (2020-2032) (USD Billion)
10.3.2.14.2 Rest of Western Europe IoT Middleware Market Estimates and Forecasts, By Enterprise Size (2020-2032) (USD Billion)
10.3.2.14.3 Rest of Western Europe IoT Middleware Market Estimates and Forecasts, By Vertical (2020-2032) (USD Billion)
10.4 Asia Pacific
10.4.1 Trends Analysis
10.4.2 Asia Pacific IoT Middleware Market Estimates and Forecasts, by Country (2020-2032) (USD Billion)
10.4.3 Asia Pacific IoT Middleware Market Estimates and Forecasts, By Platform (2020-2032) (USD Billion)
10.4.4 Asia Pacific IoT Middleware Market Estimates and Forecasts, By Enterprise Size (2020-2032) (USD Billion)
10.4.5 Asia Pacific IoT Middleware Market Estimates and Forecasts, By Vertical (2020-2032) (USD Billion)
10.4.6 China
10.4.6.1 China IoT Middleware Market Estimates and Forecasts, By Platform (2020-2032) (USD Billion)
10.4.6.2 China IoT Middleware Market Estimates and Forecasts, By Enterprise Size (2020-2032) (USD Billion)
10.4.6.3 China IoT Middleware Market Estimates and Forecasts, By Vertical (2020-2032) (USD Billion)
10.4.7 India
10.4.7.1 India IoT Middleware Market Estimates and Forecasts, By Platform (2020-2032) (USD Billion)
10.4.7.2 India IoT Middleware Market Estimates and Forecasts, By Enterprise Size (2020-2032) (USD Billion)
10.4.7.3 India IoT Middleware Market Estimates and Forecasts, By Vertical (2020-2032) (USD Billion)
10.4.8 Japan
10.4.8.1 Japan IoT Middleware Market Estimates and Forecasts, By Platform (2020-2032) (USD Billion)
10.4.8.2 Japan IoT Middleware Market Estimates and Forecasts, By Enterprise Size (2020-2032) (USD Billion)
10.4.8.3 Japan IoT Middleware Market Estimates and Forecasts, By Vertical (2020-2032) (USD Billion)
10.4.9 South Korea
10.4.9.1 South Korea IoT Middleware Market Estimates and Forecasts, By Platform (2020-2032) (USD Billion)
10.4.9.2 South Korea IoT Middleware Market Estimates and Forecasts, By Enterprise Size (2020-2032) (USD Billion)
10.4.9.3 South Korea IoT Middleware Market Estimates and Forecasts, By Vertical (2020-2032) (USD Billion)
10.4.10 Vietnam
10.4.10.1 Vietnam IoT Middleware Market Estimates and Forecasts, By Platform (2020-2032) (USD Billion)
10.4.10.2 Vietnam IoT Middleware Market Estimates and Forecasts, By Enterprise Size (2020-2032) (USD Billion)
10.4.10.3 Vietnam IoT Middleware Market Estimates and Forecasts, By Vertical (2020-2032) (USD Billion)
10.4.11 Singapore
10.4.11.1 Singapore IoT Middleware Market Estimates and Forecasts, By Platform (2020-2032) (USD Billion)
10.4.11.2 Singapore IoT Middleware Market Estimates and Forecasts, By Enterprise Size (2020-2032) (USD Billion)
10.4.11.3 Singapore IoT Middleware Market Estimates and Forecasts, By Vertical (2020-2032) (USD Billion)
10.4.12 Australia
10.4.12.1 Australia IoT Middleware Market Estimates and Forecasts, By Platform (2020-2032) (USD Billion)
10.4.12.2 Australia IoT Middleware Market Estimates and Forecasts, By Enterprise Size (2020-2032) (USD Billion)
10.4.12.3 Australia IoT Middleware Market Estimates and Forecasts, By Vertical (2020-2032) (USD Billion)
10.4.13 Rest of Asia Pacific
10.4.13.1 Rest of Asia Pacific IoT Middleware Market Estimates and Forecasts, By Platform (2020-2032) (USD Billion)
10.4.13.2 Rest of Asia Pacific IoT Middleware Market Estimates and Forecasts, By Enterprise Size (2020-2032) (USD Billion)
10.4.13.3 Rest of Asia Pacific IoT Middleware Market Estimates and Forecasts, By Vertical (2020-2032) (USD Billion)
10.5 Middle East and Africa
10.5.1 Middle East
10.5.1.1 Trends Analysis
10.5.1.2 Middle East IoT Middleware Market Estimates and Forecasts, by Country (2020-2032) (USD Billion)
10.5.1.3 Middle East IoT Middleware Market Estimates and Forecasts, By Platform (2020-2032) (USD Billion)
10.5.1.4 Middle East IoT Middleware Market Estimates and Forecasts, By Enterprise Size (2020-2032) (USD Billion)
10.5.1.5 Middle East IoT Middleware Market Estimates and Forecasts, By Vertical (2020-2032) (USD Billion)
10.5.1.6 UAE
10.5.1.6.1 UAE IoT Middleware Market Estimates and Forecasts, By Platform (2020-2032) (USD Billion)
10.5.1.6.2 UAE IoT Middleware Market Estimates and Forecasts, By Enterprise Size (2020-2032) (USD Billion)
10.5.1.6.3 UAE IoT Middleware Market Estimates and Forecasts, By Vertical (2020-2032) (USD Billion)
10.5.1.7 Egypt
10.5.1.7.1 Egypt IoT Middleware Market Estimates and Forecasts, By Platform (2020-2032) (USD Billion)
10.5.1.7.2 Egypt IoT Middleware Market Estimates and Forecasts, By Enterprise Size (2020-2032) (USD Billion)
10.5.1.7.3 Egypt IoT Middleware Market Estimates and Forecasts, By Vertical (2020-2032) (USD Billion)
10.5.1.8 Saudi Arabia
10.5.1.8.1 Saudi Arabia IoT Middleware Market Estimates and Forecasts, By Platform (2020-2032) (USD Billion)
10.5.1.8.2 Saudi Arabia IoT Middleware Market Estimates and Forecasts, By Enterprise Size (2020-2032) (USD Billion)
10.5.1.8.3 Saudi Arabia IoT Middleware Market Estimates and Forecasts, By Vertical (2020-2032) (USD Billion)
10.5.1.9 Qatar
10.5.1.9.1 Qatar IoT Middleware Market Estimates and Forecasts, By Platform (2020-2032) (USD Billion)
10.5.1.9.2 Qatar IoT Middleware Market Estimates and Forecasts, By Enterprise Size (2020-2032) (USD Billion)
10.5.1.9.3 Qatar IoT Middleware Market Estimates and Forecasts, By Vertical (2020-2032) (USD Billion)
10.5.1.10 Rest of Middle East
10.5.1.10.1 Rest of Middle East IoT Middleware Market Estimates and Forecasts, By Platform (2020-2032) (USD Billion)
10.5.1.10.2 Rest of Middle East IoT Middleware Market Estimates and Forecasts, By Enterprise Size (2020-2032) (USD Billion)
10.5.1.10.3 Rest of Middle East IoT Middleware Market Estimates and Forecasts, By Vertical (2020-2032) (USD Billion)
10.5.2 Africa
10.5.2.1 Trends Analysis
10.5.2.2 Africa IoT Middleware Market Estimates and Forecasts, by Country (2020-2032) (USD Billion)
10.5.2.3 Africa IoT Middleware Market Estimates and Forecasts, By Platform (2020-2032) (USD Billion)
10.5.2.4 Africa IoT Middleware Market Estimates and Forecasts, By Enterprise Size (2020-2032) (USD Billion)
10.5.2.5 Africa IoT Middleware Market Estimates and Forecasts, By Vertical (2020-2032) (USD Billion)
10.5.2.6 South Africa
10.5.2.6.1 South Africa IoT Middleware Market Estimates and Forecasts, By Platform (2020-2032) (USD Billion)
10.5.2.6.2 South Africa IoT Middleware Market Estimates and Forecasts, By Enterprise Size (2020-2032) (USD Billion)
10.5.2.6.3 South Africa IoT Middleware Market Estimates and Forecasts, By Vertical (2020-2032) (USD Billion)
10.5.2.7 Nigeria
10.5.2.7.1 Nigeria IoT Middleware Market Estimates and Forecasts, By Platform (2020-2032) (USD Billion)
10.5.2.7.2 Nigeria IoT Middleware Market Estimates and Forecasts, By Enterprise Size (2020-2032) (USD Billion)
10.5.2.7.3 Nigeria IoT Middleware Market Estimates and Forecasts, By Vertical (2020-2032) (USD Billion)
10.5.2.8 Rest of Africa
10.5.2.8.1 Rest of Africa IoT Middleware Market Estimates and Forecasts, By Platform (2020-2032) (USD Billion)
10.5.2.8.2 Rest of Africa IoT Middleware Market Estimates and Forecasts, By Enterprise Size (2020-2032) (USD Billion)
10.5.2.8.3 Rest of Africa IoT Middleware Market Estimates and Forecasts, By Vertical (2020-2032) (USD Billion)
10.6 Latin America
10.6.1 Trends Analysis
10.6.2 Latin America IoT Middleware Market Estimates and Forecasts, by Country (2020-2032) (USD Billion)
10.6.3 Latin America IoT Middleware Market Estimates and Forecasts, By Platform (2020-2032) (USD Billion)
10.6.4 Latin America IoT Middleware Market Estimates and Forecasts, By Enterprise Size (2020-2032) (USD Billion)
10.6.5 Latin America IoT Middleware Market Estimates and Forecasts, By Vertical (2020-2032) (USD Billion)
10.6.6 Brazil
10.6.6.1 Brazil IoT Middleware Market Estimates and Forecasts, By Platform (2020-2032) (USD Billion)
10.6.6.2 Brazil IoT Middleware Market Estimates and Forecasts, By Enterprise Size (2020-2032) (USD Billion)
10.6.6.3 Brazil IoT Middleware Market Estimates and Forecasts, By Vertical (2020-2032) (USD Billion)
10.6.7 Argentina
10.6.7.1 Argentina IoT Middleware Market Estimates and Forecasts, By Platform (2020-2032) (USD Billion)
10.6.7.2 Argentina IoT Middleware Market Estimates and Forecasts, By Enterprise Size (2020-2032) (USD Billion)
10.6.7.3 Argentina IoT Middleware Market Estimates and Forecasts, By Vertical (2020-2032) (USD Billion)
10.6.8 Colombia
10.6.8.1 Colombia IoT Middleware Market Estimates and Forecasts, By Platform (2020-2032) (USD Billion)
10.6.8.2 Colombia IoT Middleware Market Estimates and Forecasts, By Enterprise Size (2020-2032) (USD Billion)
10.6.8.3 Colombia IoT Middleware Market Estimates and Forecasts, By Vertical (2020-2032) (USD Billion)
10.6.9 Rest of Latin America
10.6.9.1 Rest of Latin America IoT Middleware Market Estimates and Forecasts, By Platform (2020-2032) (USD Billion)
10.6.9.2 Rest of Latin America IoT Middleware Market Estimates and Forecasts, By Enterprise Size (2020-2032) (USD Billion)
10.6.9.3 Rest of Latin America IoT Middleware Market Estimates and Forecasts, By Vertical (2020-2032) (USD Billion)
11. Company Profiles
11.1 Microsoft
11.1.1 Company Overview
11.1.2 Financial
11.1.3 Products/ Services Offered
11.1.4 SWOT Analysis
11.2 IBM
11.2.1 Company Overview
11.2.2 Financial
11.2.3 Products/ Services Offered
11.2.4 SWOT Analysis
11.3 PTC
11.3.1 Company Overview
11.3.2 Financial
11.3.3 Products/ Services Offered
11.3.4 SWOT Analysis
11.4 Cisco
11.4.1 Company Overview
11.4.2 Financial
11.4.3 Products/ Services Offered
11.4.4 SWOT Analysis
11.5 AWS
11.5.1 Company Overview
11.5.2 Financial
11.5.3 Products/ Services Offered
11.5.4 SWOT Analysis
11.6 SAP
11.6.1 Company Overview
11.6.2 Financial
11.6.3 Products/ Services Offered
11.6.4 SWOT Analysis
11.7 Google
11.7.1 Company Overview
11.7.2 Financial
11.7.3 Products/ Services Offered
11.7.4 SWOT Analysis
11.8 Hitachi
11.8.1 Company Overview
11.8.2 Financial
11.8.3 Products/ Services Offered
11.8.4 SWOT Analysis
11.9 Oracle
11.9.1 Company Overview
11.9.2 Financial
11.9.3 Products/ Services Offered
11.9.4 SWOT Analysis
11.10 HPE
11.10.1 Company Overview
11.10.2 Financial
11.10.3 Products/ Services Offered
11.10.4 SWOT Analysis
12. Use Cases and Best Practices
13. Conclusion
An accurate research report requires proper strategizing as well as implementation. There are multiple factors involved in the completion of good and accurate research report and selecting the best methodology to compete the research is the toughest part. Since the research reports we provide play a crucial role in any company’s decision-making process, therefore we at SNS Insider always believe that we should choose the best method which gives us results closer to reality. This allows us to reach at a stage wherein we can provide our clients best and accurate investment to output ratio.
Each report that we prepare takes a timeframe of 350-400 business hours for production. Starting from the selection of titles through a couple of in-depth brain storming session to the final QC process before uploading our titles on our website we dedicate around 350 working hours. The titles are selected based on their current market cap and the foreseen CAGR and growth.
The 5 steps process:
Step 1: Secondary Research:
Secondary Research or Desk Research is as the name suggests is a research process wherein, we collect data through the readily available information. In this process we use various paid and unpaid databases which our team has access to and gather data through the same. This includes examining of listed companies’ annual reports, Journals, SEC filling etc. Apart from this our team has access to various associations across the globe across different industries. Lastly, we have exchange relationships with various university as well as individual libraries.

Step 2: Primary Research
When we talk about primary research, it is a type of study in which the researchers collect relevant data samples directly, rather than relying on previously collected data. This type of research is focused on gaining content specific facts that can be sued to solve specific problems. Since the collected data is fresh and first hand therefore it makes the study more accurate and genuine.
We at SNS Insider have divided Primary Research into 2 parts.
Part 1 wherein we interview the KOLs of major players as well as the upcoming ones across various geographic regions. This allows us to have their view over the market scenario and acts as an important tool to come closer to the accurate market numbers. As many as 45 paid and unpaid primary interviews are taken from both the demand and supply side of the industry to make sure we land at an accurate judgement and analysis of the market.
This step involves the triangulation of data wherein our team analyses the interview transcripts, online survey responses and observation of on filed participants. The below mentioned chart should give a better understanding of the part 1 of the primary interview.

Part 2: In this part of primary research the data collected via secondary research and the part 1 of the primary research is validated with the interviews from individual consultants and subject matter experts.
Consultants are those set of people who have at least 12 years of experience and expertise within the industry whereas Subject Matter Experts are those with at least 15 years of experience behind their back within the same space. The data with the help of two main processes i.e., FGDs (Focused Group Discussions) and IDs (Individual Discussions). This gives us a 3rd party nonbiased primary view of the market scenario making it a more dependable one while collation of the data pointers.
Step 3: Data Bank Validation
Once all the information is collected via primary and secondary sources, we run that information for data validation. At our intelligence centre our research heads track a lot of information related to the market which includes the quarterly reports, the daily stock prices, and other relevant information. Our data bank server gets updated every fortnight and that is how the information which we collected using our primary and secondary information is revalidated in real time.

Step 4: QA/QC Process
After all the data collection and validation our team does a final level of quality check and quality assurance to get rid of any unwanted or undesired mistakes. This might include but not limited to getting rid of the any typos, duplication of numbers or missing of any important information. The people involved in this process include technical content writers, research heads and graphics people. Once this process is completed the title gets uploader on our platform for our clients to read it.
Step 5: Final QC/QA Process:
This is the last process and comes when the client has ordered the study. In this process a final QA/QC is done before the study is emailed to the client. Since we believe in giving our clients a good experience of our research studies, therefore, to make sure that we do not lack at our end in any way humanly possible we do a final round of quality check and then dispatch the study to the client.
Key Segments:
By Platform
Device Management
Application Management
Connectivity Management
Security Management
Data Management
By Enterprise Size
Large Enterprises
Small And Medium Enterprises
By Vertical
Government & Defense
Manufacturing
BFSI
Transportation & Logistics
Energy & Utilities
Healthcare
Retail
Other Vertical
Request for Segment Customization as per your Business Requirement: Segment Customization Request
Regional Coverage:
North America
US
Canada
Mexico
Europe
Eastern Europe
Poland
Romania
Hungary
Turkey
Rest of Eastern Europe
Western Europe
Germany
France
UK
Italy
Spain
Netherlands
Switzerland
Austria
Rest of Western Europe
Asia Pacific
China
India
Japan
South Korea
Vietnam
Singapore
Australia
Rest of Asia Pacific
Middle East & Africa
Middle East
UAE
Egypt
Saudi Arabia
Qatar
Rest of Middle East
Africa
Nigeria
South Africa
Rest of Africa
Latin America
Brazil
Argentina
Colombia
Rest of Latin America
Request for Country Level Research Report: Country Level Customization Request
Available Customization
With the given market data, SNS Insider offers customization as per the company’s specific needs. The following customization options are available for the report:
Detailed Volume Analysis
Criss-Cross segment analysis (e.g. Product X Application)
Competitive Product Benchmarking
Geographic Analysis
Additional countries in any of the regions
Customized Data Representation
Detailed analysis and profiling of additional market players
The Application Server Market was valued at USD 21.7 billion in 2023 and is expected to reach USD 66.9 billion by 2032, growing at a CAGR of 13.34% by 2032.
The Mixed Reality Market Size was valued at USD 4.5 Billion in 2023 and will reach USD 102.5 Billion by 2032, growing at a CAGR of 41.5% by 2032.
The Artificial Intelligence of Things Market was valued at USD 28.15 Bn in 2023 and is projected to grow at a CAGR of 33.13% over 2024-2032 to reach USD 369.18.
The Mobile and Wireless Backhaul Market Size was valued at USD 13.13 Billion in 2023 and will reach USD 29.20 Billion by 2032 and grow at a CAGR of 9.32% by 2032.
The Consumer IoT Market was valued at USD 243.28 billion in 2023 and is expected to reach USD 647.65 billion by 2032, growing at a CAGR of 11.53% over the forecast period 2024-2032.
The Enterprise Key Management Market was valued at USD 2.8 billion in 2023 and is expected to reach USD 14.5 billion by 2032, growing at a CAGR of 20.19% from 2024-2032.

Hi! Click one of our member below to chat on Phone
© 2025 All Rights Reserved by SNS Insider Pvt Ltd


